Affiliation(s):
1.
School of Resources and Safety Engineering, Central South University, Changsha 410083, China; moreAffiliation(s): 1.
School of Resources and Safety Engineering, Central South University, Changsha 410083, China; 2.
Kuming Prospecting Design Institute of China Nonferrous Metals Industry, Kunming 650051, China; less
Ke Zhang, Ping Cao, Rui Bao. Progressive failure analysis of slope with strain-softening behaviour based on strength reduction method[J]. Journal of Zhejiang University Science A, 2013, 14(2): 101-109.
@article{title="Progressive failure analysis of slope with strain-softening behaviour based on strength reduction method", author="Ke Zhang, Ping Cao, Rui Bao", journal="Journal of Zhejiang University Science A", volume="14", number="2", pages="101-109", year="2013", publisher="Zhejiang University Press & Springer", doi="10.1631/jzus.A1200121" }
%0 Journal Article %T Progressive failure analysis of slope with strain-softening behaviour based on strength reduction method %A Ke Zhang %A Ping Cao %A Rui Bao %J Journal of Zhejiang University SCIENCE A %V 14 %N 2 %P 101-109 %@ 1673-565X %D 2013 %I Zhejiang University Press & Springer %DOI 10.1631/jzus.A1200121
TY - JOUR T1 - Progressive failure analysis of slope with strain-softening behaviour based on strength reduction method A1 - Ke Zhang A1 - Ping Cao A1 - Rui Bao J0 - Journal of Zhejiang University Science A VL - 14 IS - 2 SP - 101 EP - 109 %@ 1673-565X Y1 - 2013 PB - Zhejiang University Press & Springer ER - DOI - 10.1631/jzus.A1200121
Abstract: Based on the strength reduction method and strain-softening model, a method for progressive failure analysis of strain-softening slopes was presented in this paper. The mutation is more pronounced in strain-softening analysis, and the mutation of displacement at slope crest was taken as critical failure criterion. An engineering example was provided to demonstrate the validity of the present method. This method was applied to a cut slope in an industry site. The results are as follows: (1) The factor of safety and the critical slip surface obtained by the present method are between those by peak and residual strength. The analysis with peak strength would lead to non-conservative results, but that with residual strength tends to be overly conservative. (2) The thickness of the shear zone considering strain-softening behaviour is narrower than that with non-softening analysis. (3) The failure of slope is the process of the initiation, propagation and connection of potential failure surface. The strength parameters are mobilized to a non-uniform degree while progressive failure occurs in the slope. (4) The factor of safety increases with the increase of residual shear strain threshold and elastic modulus. The failure mode of slope changes from shallow slip to deep slip. Poisson’s ratio and dilation angle have little effect on the results.
Darkslateblue:Affiliate; Royal Blue:Author; Turquoise:Article
Article Content
1. Introduction
In slope engineering, most geotechnical materials exhibit strain-softening behaviour (Skempton, 1964; 1985; Mesri and Shahien, 2003; Locat et al., 2011). Skempton (1964) first presented the concept of progressive failure by introducing the residual factor when investigated the long-term stability of clay slopes.
The limit equilibrium method is the most popular approach in slope stability analysis for its simplicity and high efficiency. Since this method is a statically indeterminate problem, assumptions on the inter-slice shear forces are employed to render the problem statically determinate. The classical limit equilibrium method only considers the ultimate limit state of the slope and provides no information on the development of progressive failure (Cheng and Lau, 2008). Some researchers (Law and Lumb, 1978; Miao et al., 1999; Khan et al., 2002) extended the limit equilibrium method to analyze the stability of strain-softening slopes, and assuming that the soil strength decreases directly to the residual value from the peak value. Liu (2009) investigated the progressive failure mechanism of a 1D strain-softening slope. Zhang and Zhang (2007) and Zhang and Wang (2010) expanded the concept of the Sweden method and simplified Bishop method, and presented a new strain compatibility equation to analyze the stability of strain-softening slopes.
Numerical simulation methods, e.g., finite element method (FEM), are currently adopted in strain-softening slopes to overcome the limitations of the classical limit equilibrium method (Potts et al., 1997; Troncone, 2005; Liu et al., 2006; Tang, 2008; Conte et al., 2010). However, they focused on the numerical simulation of strain-softening behaviour without calculating a factor of safety. Wang (2000) presented a contact element model to simulate the contact friction state on the slip surface, and applied this model to analyze the stability of the slope with the slip surface given. The factor of safety was evaluated by the limit equilibrium method. Wang et al. (2005) presented an element model with shear band to simulate progressive failure process on the assumption that the soil strength would drop abruptly after reaching the peak value.
In recent decades, the strength reduction method has been widely applied for slope stability analysis (Zienkiewicz et al., 1975; Dawson et al., 1999; Griffiths and Lane, 1999; Cheng et al., 2007). The strength reduction method has a number of advantages as follows: (1) the factor of safety and corresponding critical failure surface are automatically solved by the reduction of shear strength; (2) it requires no assumption on the geometry of slip surface and the distribution of internal forces; (3) it takes stress-strain and nonlinear constitutive relation into consideration, and truly reflects the failure mechanism of the slope. In this work, the strength reduction method was applied to the progressive failure analysis of slopes with strain-softening behaviour. The termination criterion was discussed, and the effects with different values of residual plastic shear strain, elastic modulus, Poisson’s ratio and dilation angle were studied.
2. Strain-softening model
The strain-softening model in FLAC3D was adopted for this study. The strain-softening model that improved from the Mohr-Coulomb model allows representation of material softening behaviour. Mohr-Coulomb model properties are defined as piecewise-linear functions of plastic shear strain κps (Itasca Consulting Group, Inc., 2005). The shear-hardening increment is given as
,
where and is the plastic shear strain increment along the direction of the maximum and minimum principal stress, respectively. is the volumetric plastic shear strain increment, .
In this study, a three-segment piecewise-linear strain-softening model was employed as shown in Fig. 1, where cp′ and φp′ are the peak strength parameters, cr′ and φr′ are the residual strength parameters, and and are the shear strain threshold (Potts and Zdravkovic, 1999; Conte et al., 2010). The properties are given as follows:
Strain-softening model
3. Strength reduction method
In the strength reduction method, the factor of safety is defined as the ratio of the actual shear strength to the reduced shear strength at failure. The material strength parameters c′ and φ′ are reduced according to Eq. (4) until the slope fails, and the corresponding reduction factor is the factor of safety of the slope.
where K is the reduction factor.
A key problem for the strength reduction method is to determine failure criterion. There are several criterions, e.g., the connectivity of plastic zone, the non-convergence of solution and the mutation of displacement.
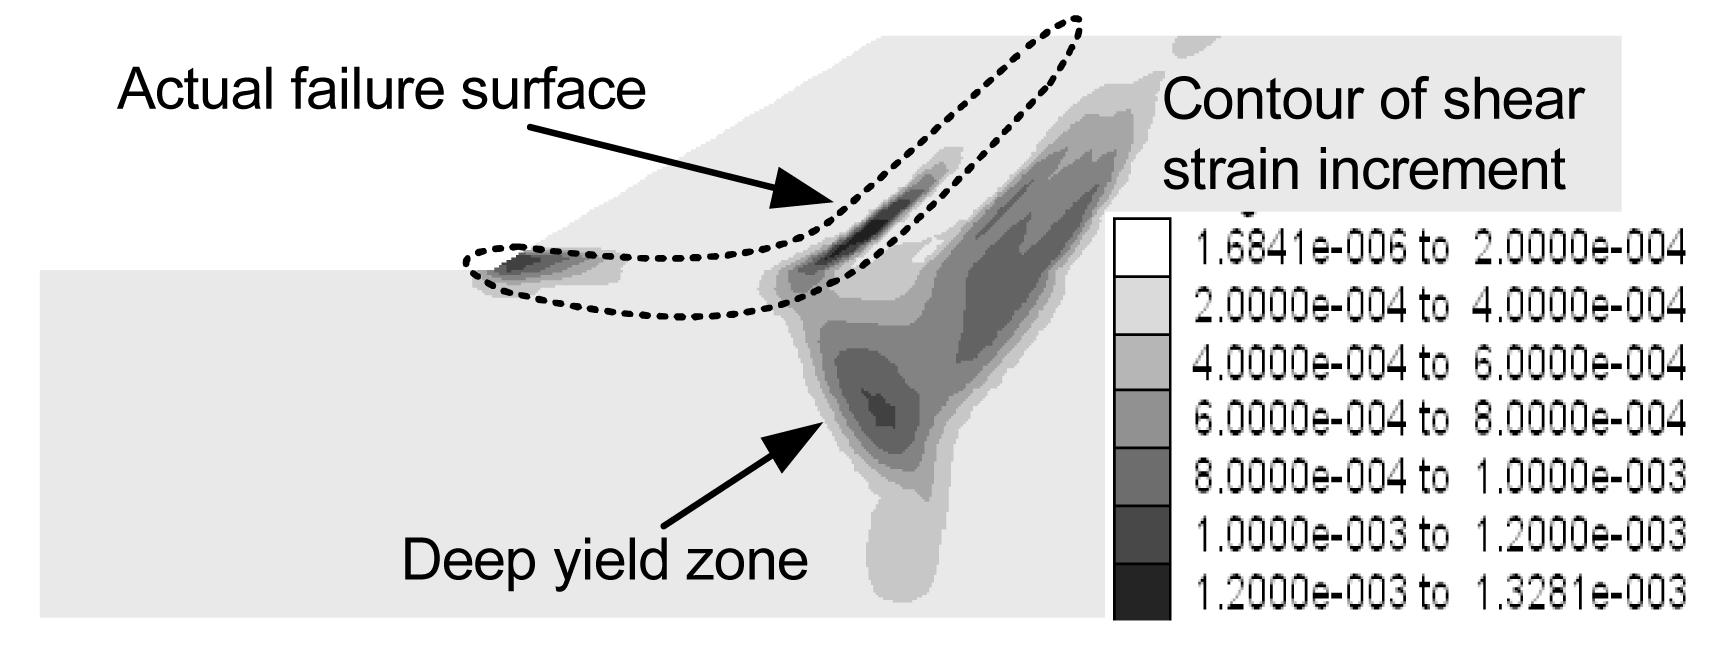
We tried to apply the second criterion to the strain-softening model by the Bisection method. The tolerance for calculation is 10−5, and 30 000 steps for the upper limit calculation steps. After a great amount of numerical experiments, we found that a deep yield zone may be formed (Fig. 2), which causes the computation to stop early. However, the continuous yield zone along the actual failure surface is not formed, resulting in a lower result. Therefore, the mutation of displacement at the slope crest is taken as the critical failure criterion.
Fig.2 Example of computation failure
4. Verification
The example shown in Fig. 3 is taken from the previous study (Zhang and Zhang, 2007); its height H and angle β are 20 m and 30°, respectively. The soil parameters are shown in Table 1. The elastic modulus E and Poisson’s ratio v are assumed to be 10 MPa and 0.3, respectively. The strain-softening model is used to describe the behaviour of the material. Gravity is taken as the initial stress. The left and right boundaries of the numerical model are constrained by vertical rollers, and the bottom boundary is constrained by both horizontal and vertical directions. Maximum shear strain increment is chosen to define the critical failure surface.
Soil strength parameters for strain-softening analysis
Parameter
Value
Unit weight, γ (kN/m3)
19.6
Peak cohesion, cp′ (kPa)
29.4
Residual cohesion, cr′ (kPa)
2.94
Peak friction angle, φp′ (°)
15
Residual friction angle, φr′ (°)
15
Peak shear strain threshold,
0
Residual shear strain threshold,
0.05
The accuracy of numerical solution could be affected by the node density. We studied the effect of mesh configuration on the factor of safety and time by designing four different mesh models (Table 2). The stability of the slope was analyzed with the peak strength parameters. The Bisection method with the non-convergence of the solution criterion was adopted. As the mesh becomes denser, the accuracy of result is higher, but more calculation time is required. When the number of elements reaches 1770, the result is insensitive to the number of elements. Taking the precision and calculation time into consideration, a FLAC3D model with 1770 elements and 3726 grid-points was chosen for the present study.
Table 2
Relationship between number of element and factor of safety
Number of element
Factor of safety
Time (s)
812
1.29
758
1271
1.28
1490
1770
1.27
1924
2351
1.27
2734
The stability of the slope was also analyzed with the peak and residual strength parameters, respectively. Horizontal displacements of the slope crest δ are monitored with different reduction factors K, as shown in Fig. 4.
Relationship between reduction factor and horizontal displacement
First, the relationship between K and δ is fitted by hyperbolic curve with the least square method (Lin et al., 2008):
,
where a, b and c are undetermined coefficients.
The slope can be considered to be failure as δ→∞. The factor of safety FS is given by
.
R2 obtained with peak and residual strength are close to 1 (Table 3), which means the curves fit the monitoring data well. However, the fitting effect for strain-softening slope is somewhat worse than that for non-softening analysis. Therefore, a failure criterion was proposed for the slope with strain-softening behaviour.
Table 3
K-δ curve-fitting result
No.
Parameter
a
b
c
R2
1
Peak strength
−0.794
0.084
−0.065
0.999
2
Residual strength
−1.664
0.016
−0.025
0.999
3
Strain-softening strength
−1.042
0.033
−0.034
0.900
Note that horizontal displacement increases with the increase of reduction factor in Fig. 4. The mutation occurs when the reduction factor increases to a certain level. When the reduction factor K is less than 0.95, K has little effect on the horizontal displacement. When K=0.955, the horizontal displacement is 24.864 m, 7313 times more than that of K=0.95 (Fig. 4c). For strain-softening slope, the mutation is more evident. The catastrophe point can be taken as the factor of safety in strain-softening analysis, and the factor of safety for this example is 0.955.
If a more accurate result is required, we could vary the reduction factor from 0.951 to 0.954, and the increment equals 0.001, then the result is listed in Table 4. The mutation occurs when K=0.954, and the more accurate factor of safety for this example is 0.954. Under such a circumstance, computation fails to converge and a continuous yield zone is formed, showing the validity of this criterion. Therefore, it is recommended to determine failure criterion by identifying the catastrophe point for strain-softening slopes.
Table 4
Values of horizontal displacement when K varies from 0.951 to 0.954 in strain-softening analysis
K
0.951
0.952
0.953
0.954
δ (m)
3.25×10⁻³
3.16×10⁻³
3.05×10⁻³
2.18×10
The results obtained by different methods in Table 5 and Fig. 5 are close to those in (Zhang and Zhang, 2007) by the Sweden method. It is not surprising to get different results by the two methods as many assumptions are used in the Sweden method. The factors of safety are also evaluated by the Spencer method to justify the applicability of the strength reduction method. Furthermore, the results from the strength reduction method and Spencer method (without considering strain-softening behaviour) coincide well.
Table 5
Comparison of results obtained by different methods
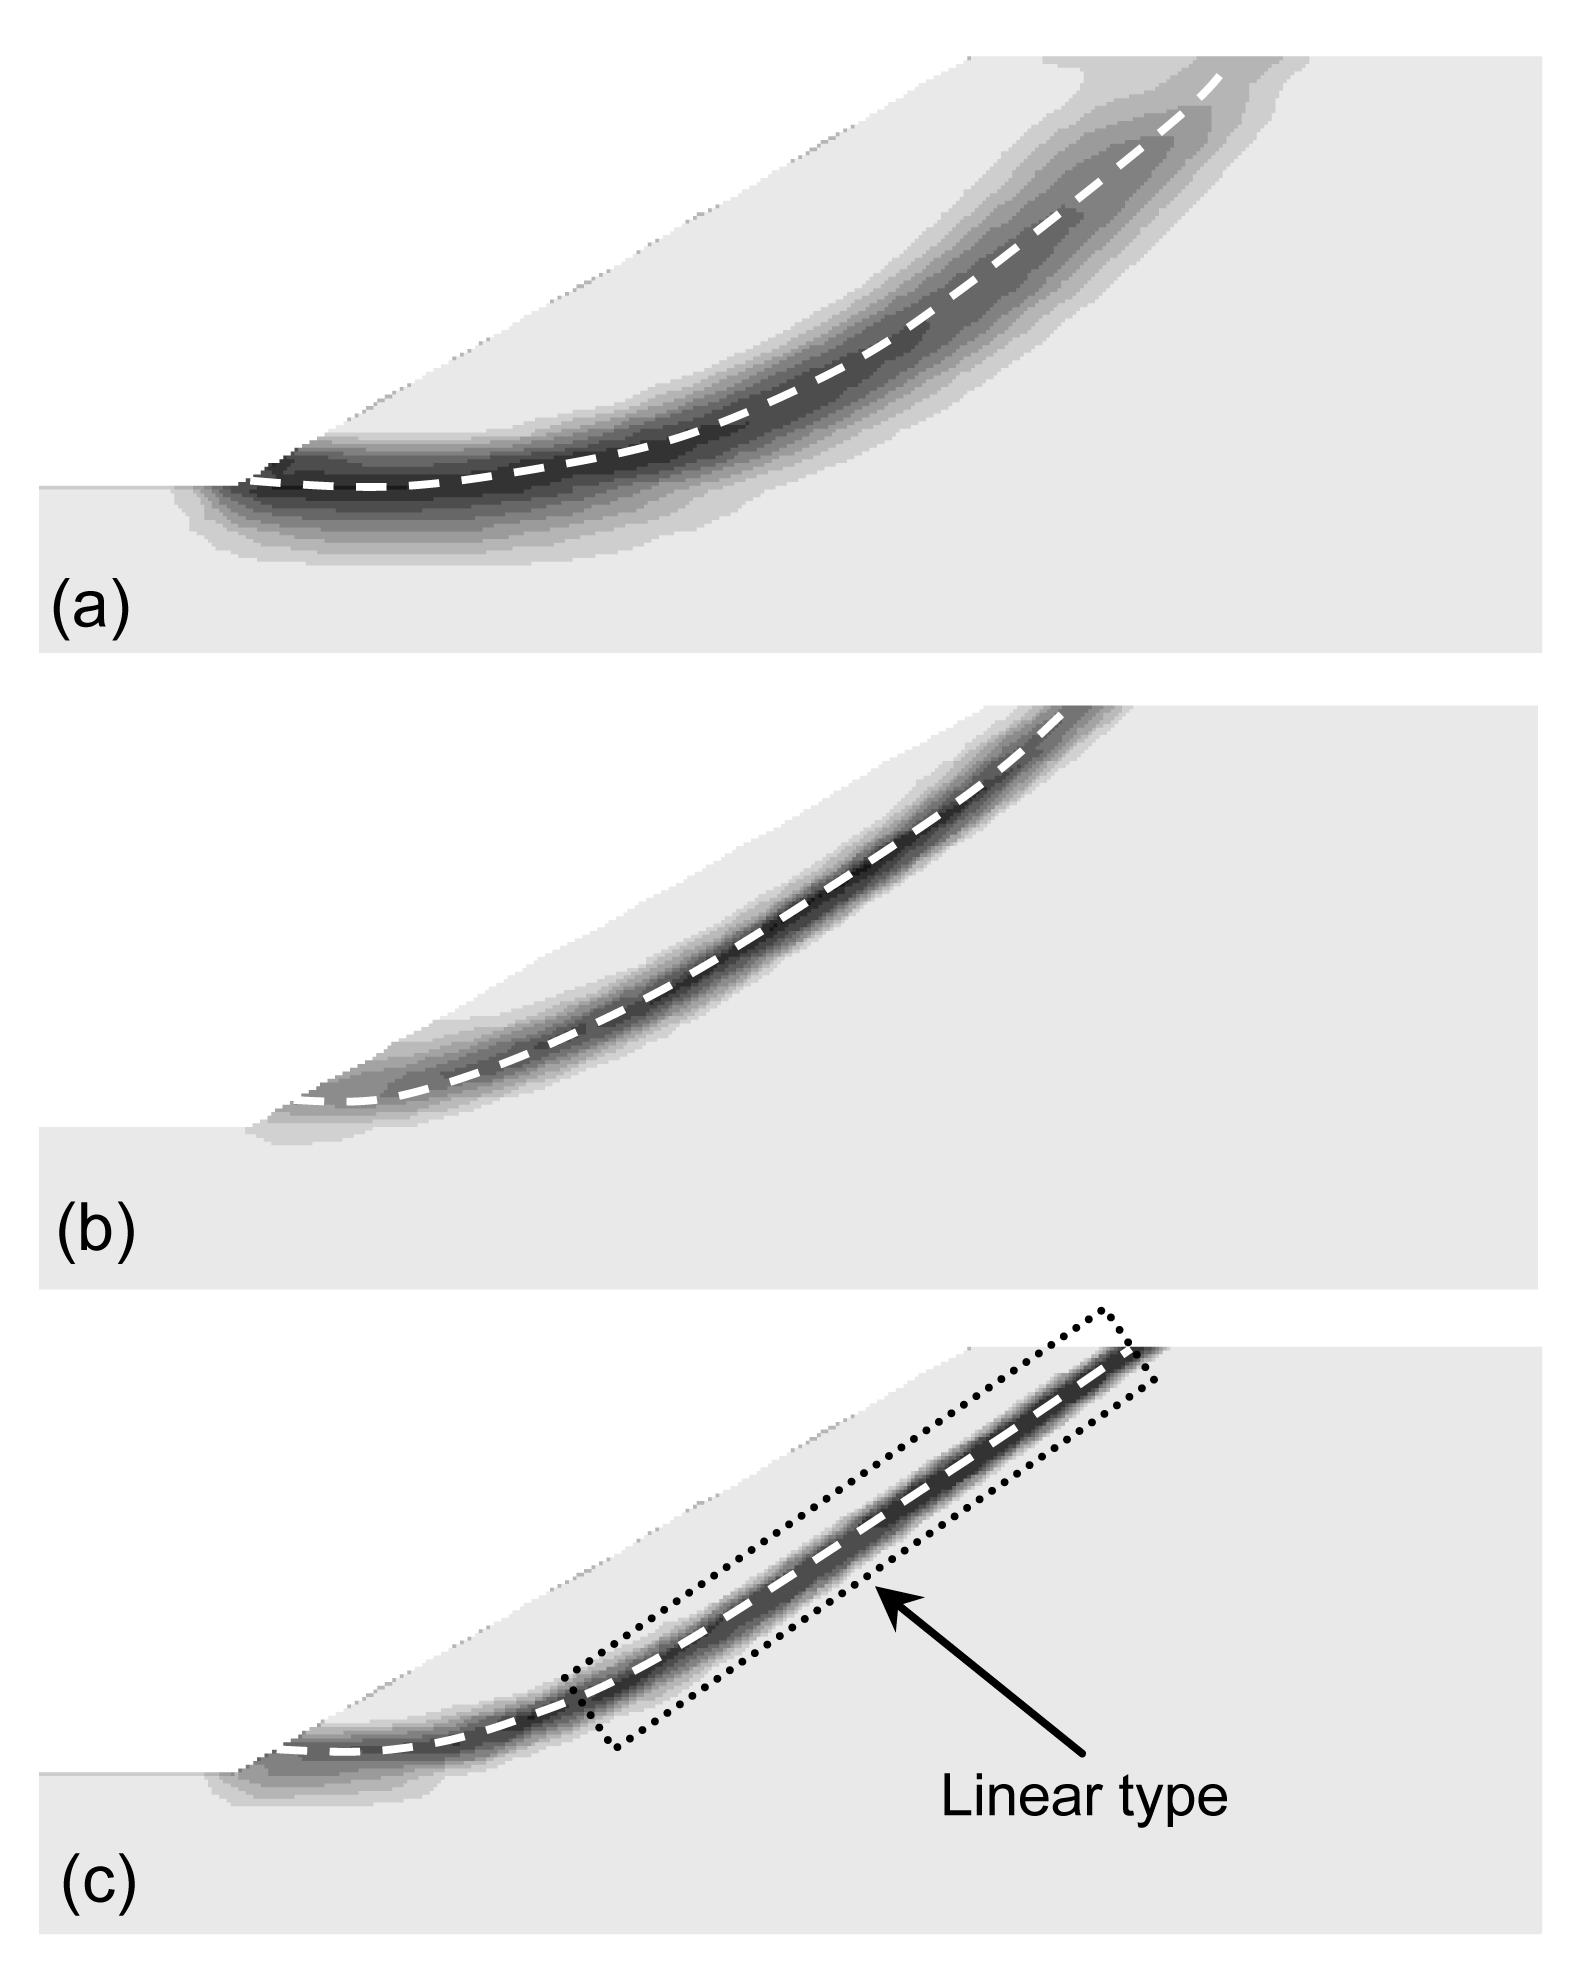
Fig.5 Shear strain increment contours and critical slip surfaces of the example (a) Peak strength; (b) Residual strength; (c) Strain-softening strength
It can be seen that the results by peak and residual strength parameters are significantly different, and the factor of safety and critical slip surface obtained by the present method are in between. Failure surfaces in non-softening analysis are circular ones. The former part of the failure surface with strain-softening strength is a circular one, and the shape of the back part is linear. The thickness of the shear zone considering strain-softening behaviour is narrower than that with non-softening analysis. If the residual strength is used for the design, the factor of safety is low. If the peak strength is used, the factor of safety is high. Analyses with residual and peak strength are likely to be unrealistic.
5. Progressive failure analysis
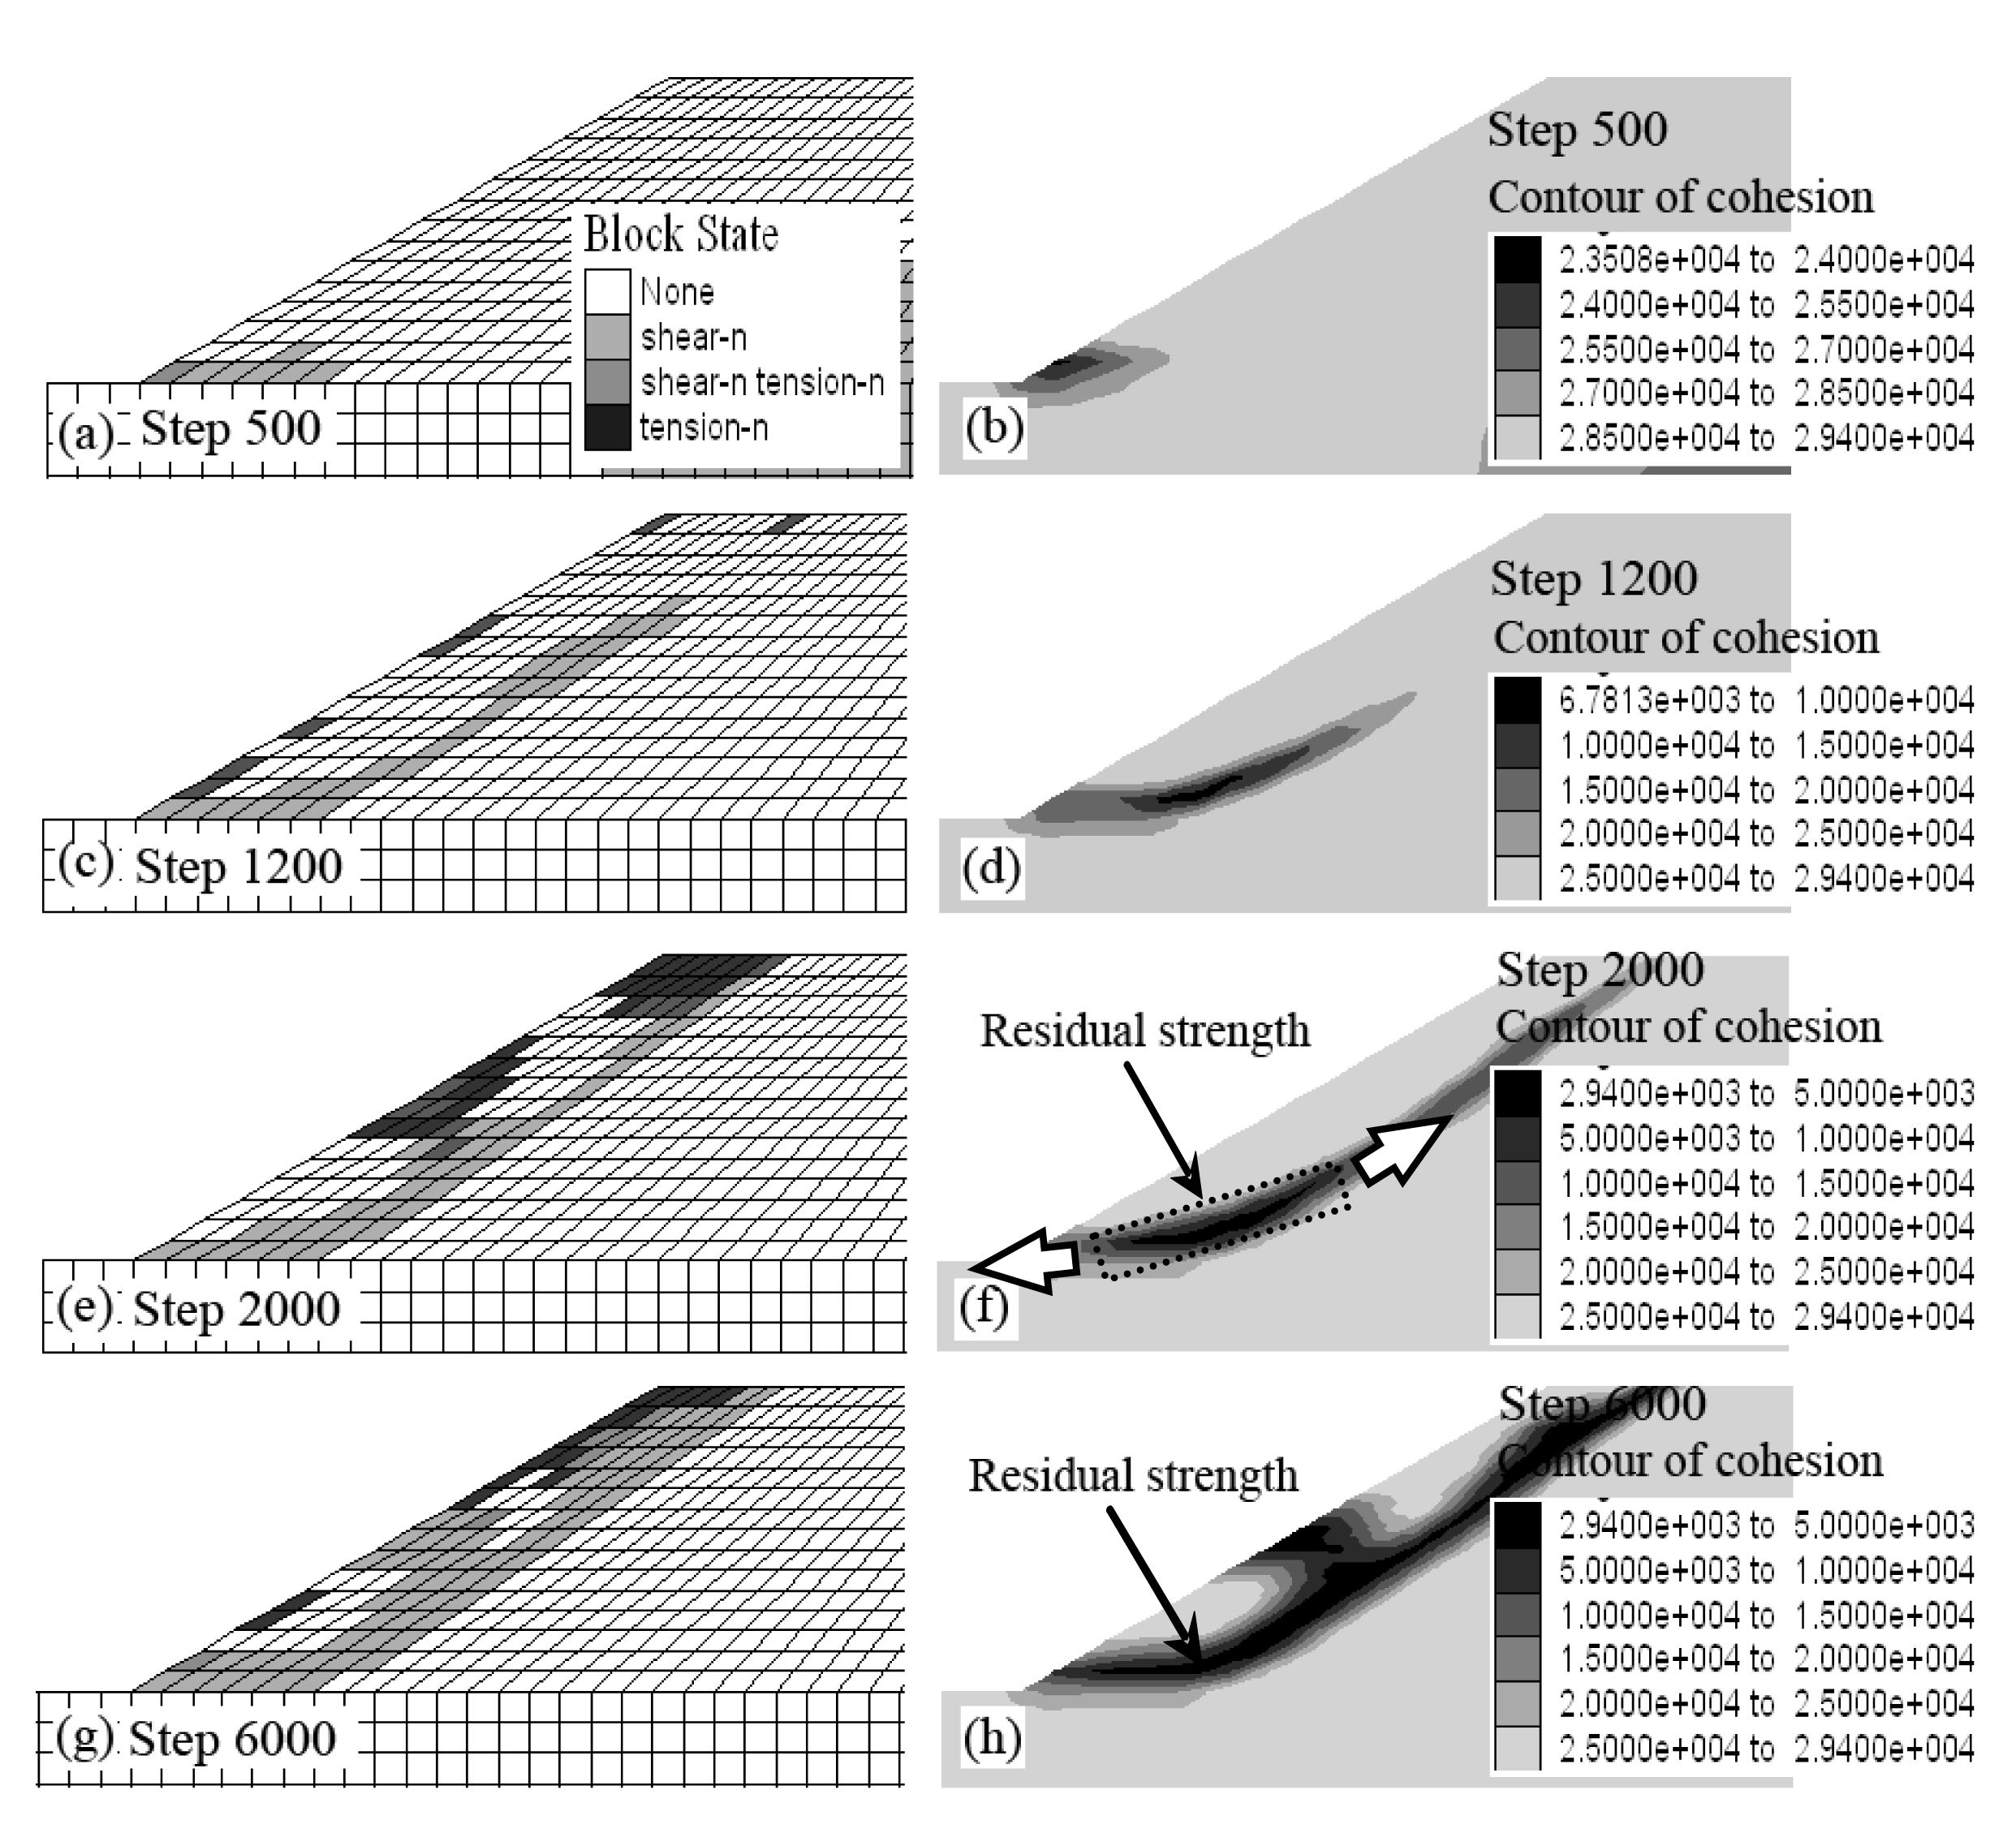
The progressive failure process of the above example (Zhang and Zhang, 2007) was studied with actual shear strength parameters. The results of analysis are shown in Fig. 6. In the figures of the distribution of failure zone, none represents the state of the zone is elastic, shear-n, tension-n and shear-n tension-n represent the state of the zone are at shear failure now, at tension failure now and at combined shear and tension failure now, respectively.
Fig.6 Progressive failure process of the slope Distribution of failure zone at step 500 (a), step 1200 (c), step 2000 (e) and step 6000 (g); Contour of cohesion at step 500 (b), step 1200 (d), step 2000 (f) and step 6000 (h)
Plastic shear failure first occurs at the bottom of the slope. With the increase of time step, shear failure gradually expands upward, and tensile failure begins to occur at the top of slope. The cohesion decreases during the plastic developing process. When time step reaches to 2000, the continuous slip surface forms with parts of strength parameters of slip soil dropping to residual parameters and others in the range of residual and peak value. With further increase of time step, the potential slip surface begins to move and the plastic strain increases. All strength parameters of slip soil drop to residual parameters when time step reaches to 6000 steps. The strength parameters along the failure surface are mobilized to non-uniform degree while progressive failure occurs in the slope.
In a word, the present method is a realistic solution, as it represents the behaviour of progressive failure.
6. Parameters analysis
6.1. Effect of residual shear strain threshold
Ignoring the stress-strain relationship in the strain-softening zone, Miao et al. (1999), Wang (2000) and Liu and Chen (2002) assumed that residual shear strain threshold
is equal to 0. But changes of will affect the values of the strength parameters, thus influencing the mechanical behaviour and the stability of the slope.
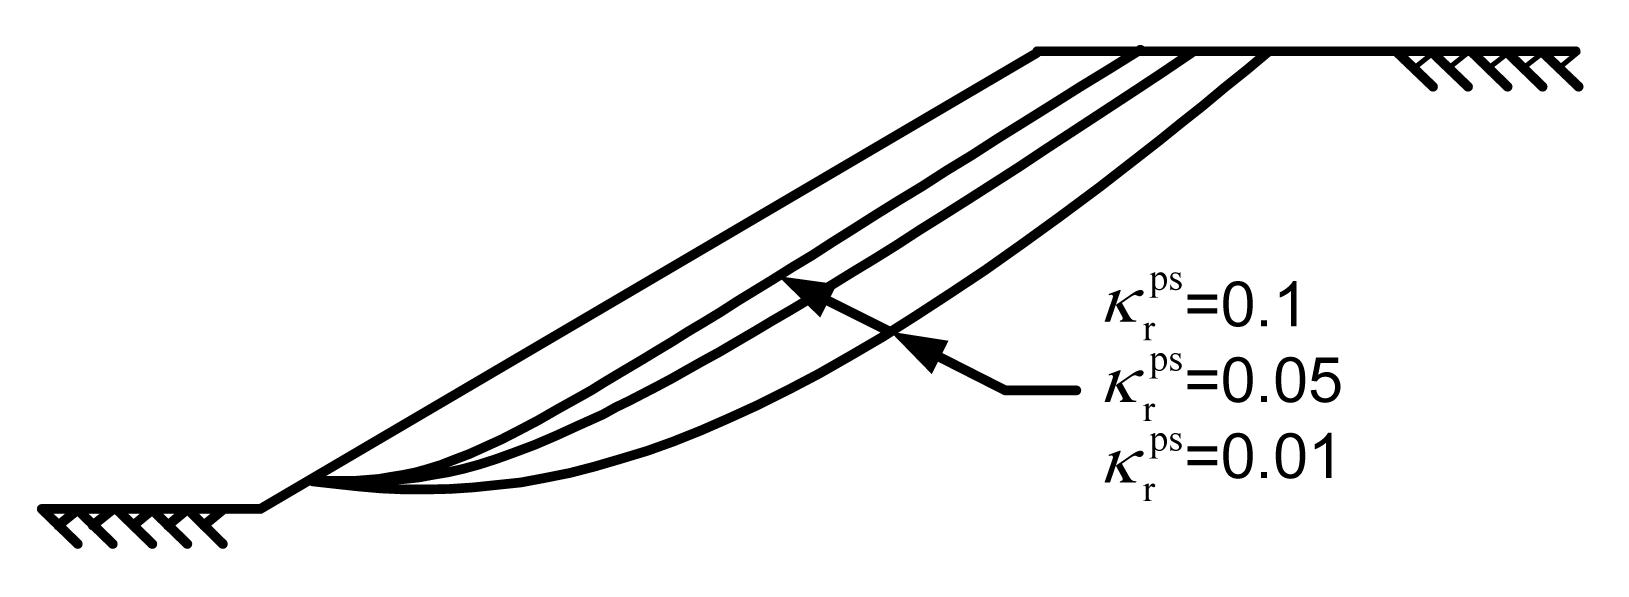
In this section, varies from 0.001 to 0.1 (i.e., =0.001, 0.01, 0.5, 0.1). The slope from (Zhang and Zhang (2007) is still selected as the analysis example. The relationship between and the factor of safety is listed in Table 6, and the relationship between and critical slip surface is shown in Fig. 7. The location of critical slip surface for =0.01 nearly coincides with that for =0.001, so it is not given in Fig. 7. It is indicated that the factor of safety increases with the increase of ; the failure mode of slope changes from shallow slip to deep slip and the shape of the latter part of the sliding surface changes from linear to circular.
Table 6
Relationship between
\documentclass[12pt]{minimal} \usepackage{amsmath}
\usepackage{wasysym} \usepackage{amsfonts} \usepackage{amssymb}
\usepackage{amsbsy} \usepackage{mathrsfs}
\setlength{\oddsidemargin}{-69pt}
\begin{document}
\[\kappa _r^{ps}\]
\end{document} and factor of safety
0.001
0.01
0.05
0.1
FS
0.68
0.70
0.96
1.06
Fig.7 Relationship between and critical slip surface
6.2. Effect of elastic modulus
Elastic modulus is purposely not selected for the strength reduction method with Mohr-Coulomb failure criterion because many research results have demonstrated that the elastic modulus had little effect on the factor of safety. The value of elastic modulus E can also be adjusted to speed up the calculation processes. It has little influence on the stress field, but the factor of safety depends on the stress field. For the slope with strain-softening behaviour, changes of elastic modulus will affect the strain field, and thereby influence the values of the strength parameters, the mechanical behaviour and the stability of slope will therefore be changed.
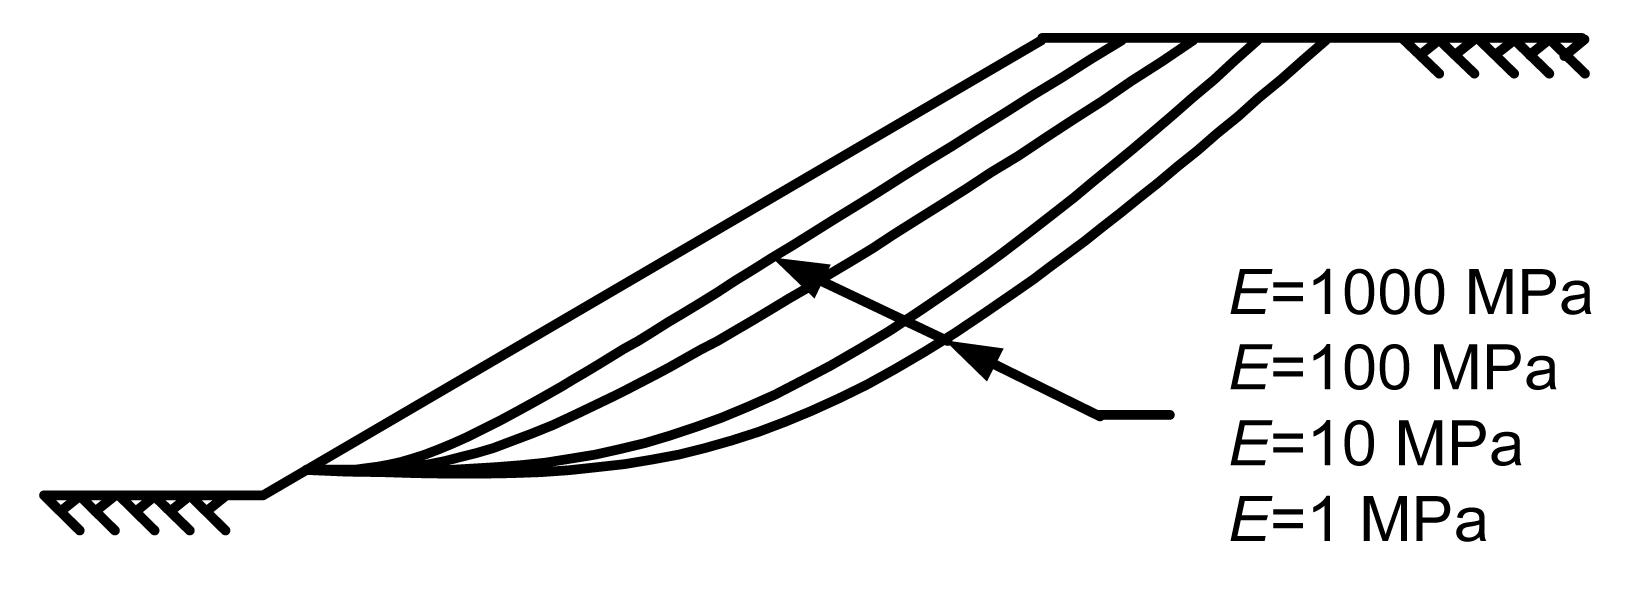
In this section, the elastic modulus varies from 1 to 1000 MPa (i.e., E=1, 10, 100, 1000 MPa). The slope from (Zhang and Zhang, 2007) is still used. The relationship between elastic modulus and the factor of safety is listed in Table 7, and the relationship between elastic modulus and critical slip surface is shown in Fig. 8. It is indicated that the factor of safety increases with the increase of elastic modulus, the failure mode of the slope changes from shallow slip to deep slip and the shape of latter part of sliding surface changes from linear to circular.
Table 7
Relationship between elastic modulus and factor of safety
E (MPa)
1
10
100
1000
FS
0.69
0.96
1.18
1.25
Fig.8 Relationship between elastic modulus and critical slip surface
6.3. Effect of Poisson’s ratio and dilation angle
In this section, the slope from (Zhang and Zhang, 2007) is still used. The Poisson’s ratio varies from 0.1 to 0.4 (i.e., v=0.1, 0.2, 0.3, 0.4). The relationship between Poisson’s ratio and the factor of safety is listed in Table 8. The dilation angle varies from 0° to 15° (i.e., ψ=0°, 5°, 10°, 15°). The relationship between dilation angle and the factor of safety is listed in Table 9. Location of critical slip surface remains little changed with different values of Poisson’s ratio and dilation angle. It is found that elastic modules, Poisson’s ratio and dilation angle have little effect on the factor of safety and location of critical slip surface.
Table 8
Relationship between Poisson’s ratio and factor of safety
Poisson’s ratio
0.1
0.2
0.3
0.4
FS
0.95
0.95
0.96
0.97
Table 9
Relationship between dilation angle and factor of safety
Dilation angle (°)
0
5
10
15
FS
0.96
0.95
0.95
0.93
7. Application
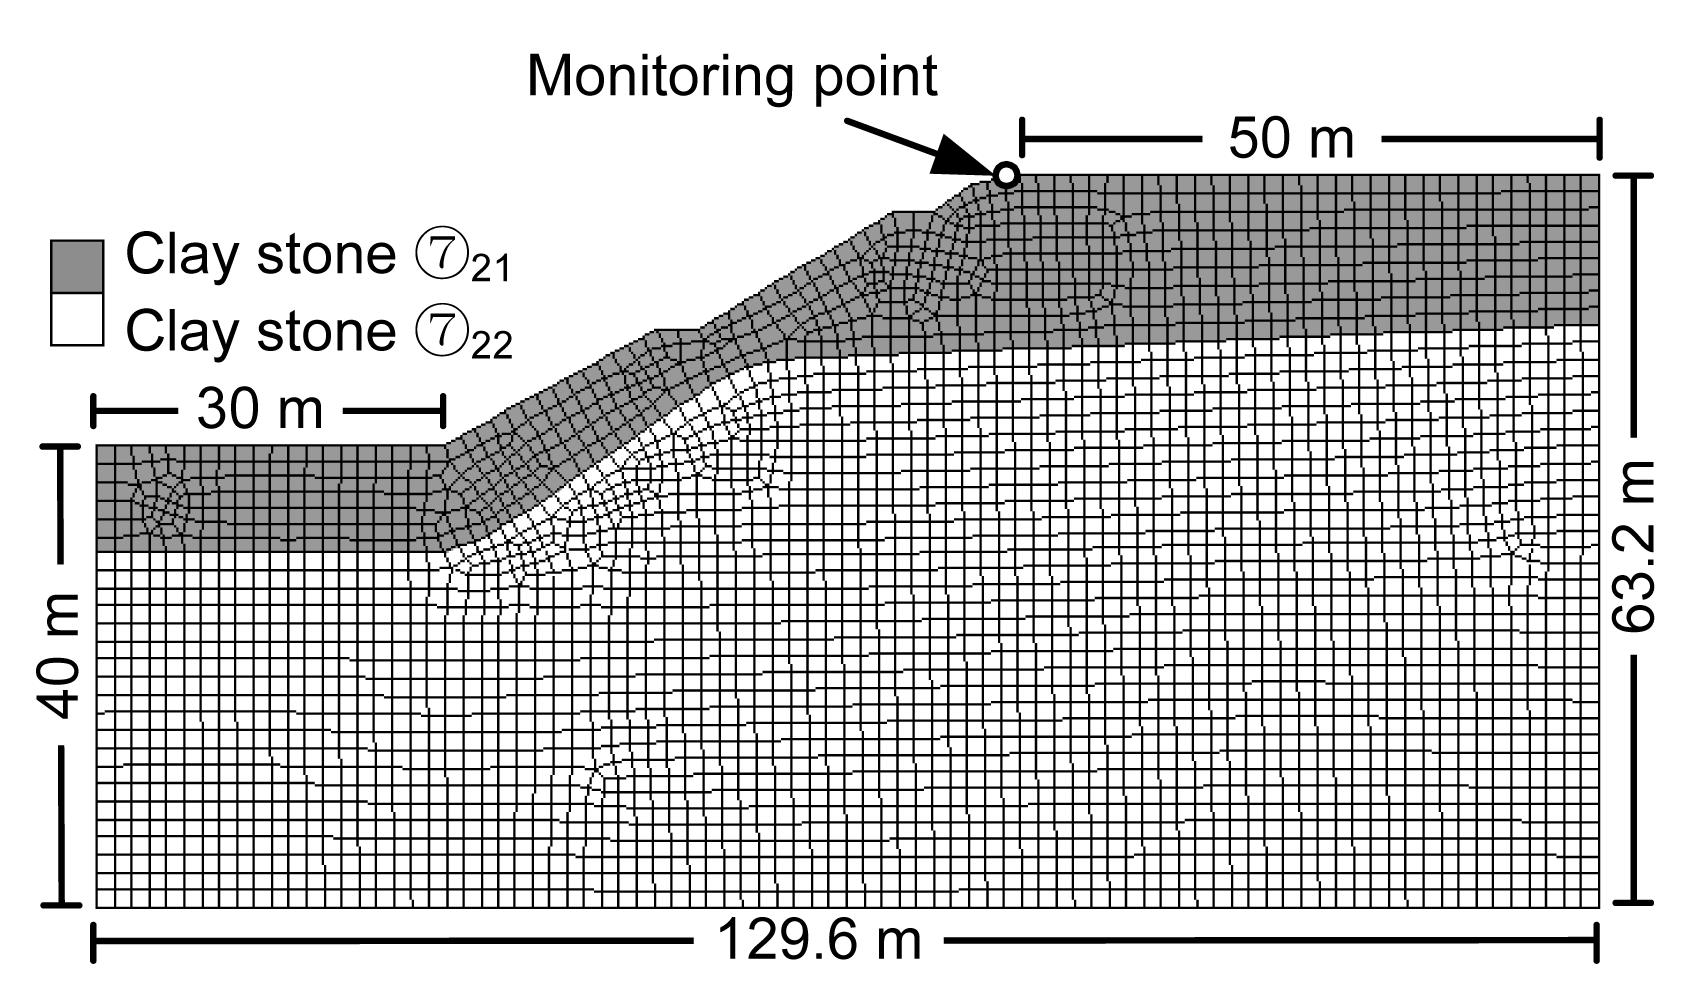
A cut slope with two soil layers in an industry site is considered, with highly weathered clay stone ⑦21 in the upper layer and moderately weathered clay stone ⑦22 in the lower layer. The mesh of cross section for this example is shown in Fig. 9 with the same boundary condition as the above example. The geotechnical parameters are listed in Table 10.
Fig.9 Calculation model
Table 10
Soil strength parameters for strain-softening analysis of example 2
Parameter
⑦21
⑦22
Unit weight, γ (kN/m3)
19.6
19.8
Elastic modulus, E (MPa)
31.2
37.5
Poisson’s ratio, v
0.30
0.28
Peak cohesion, cp′ (kPa)
30
35
Residual cohesion, cr′ (kPa)
23
27
Peak friction angle, φp′ (°)
18
20
Residual friction angle, φr′ (°)
16
17
Peak shear strain threshold,
0
0
Residual shear strain threshold,
0.015
0.015
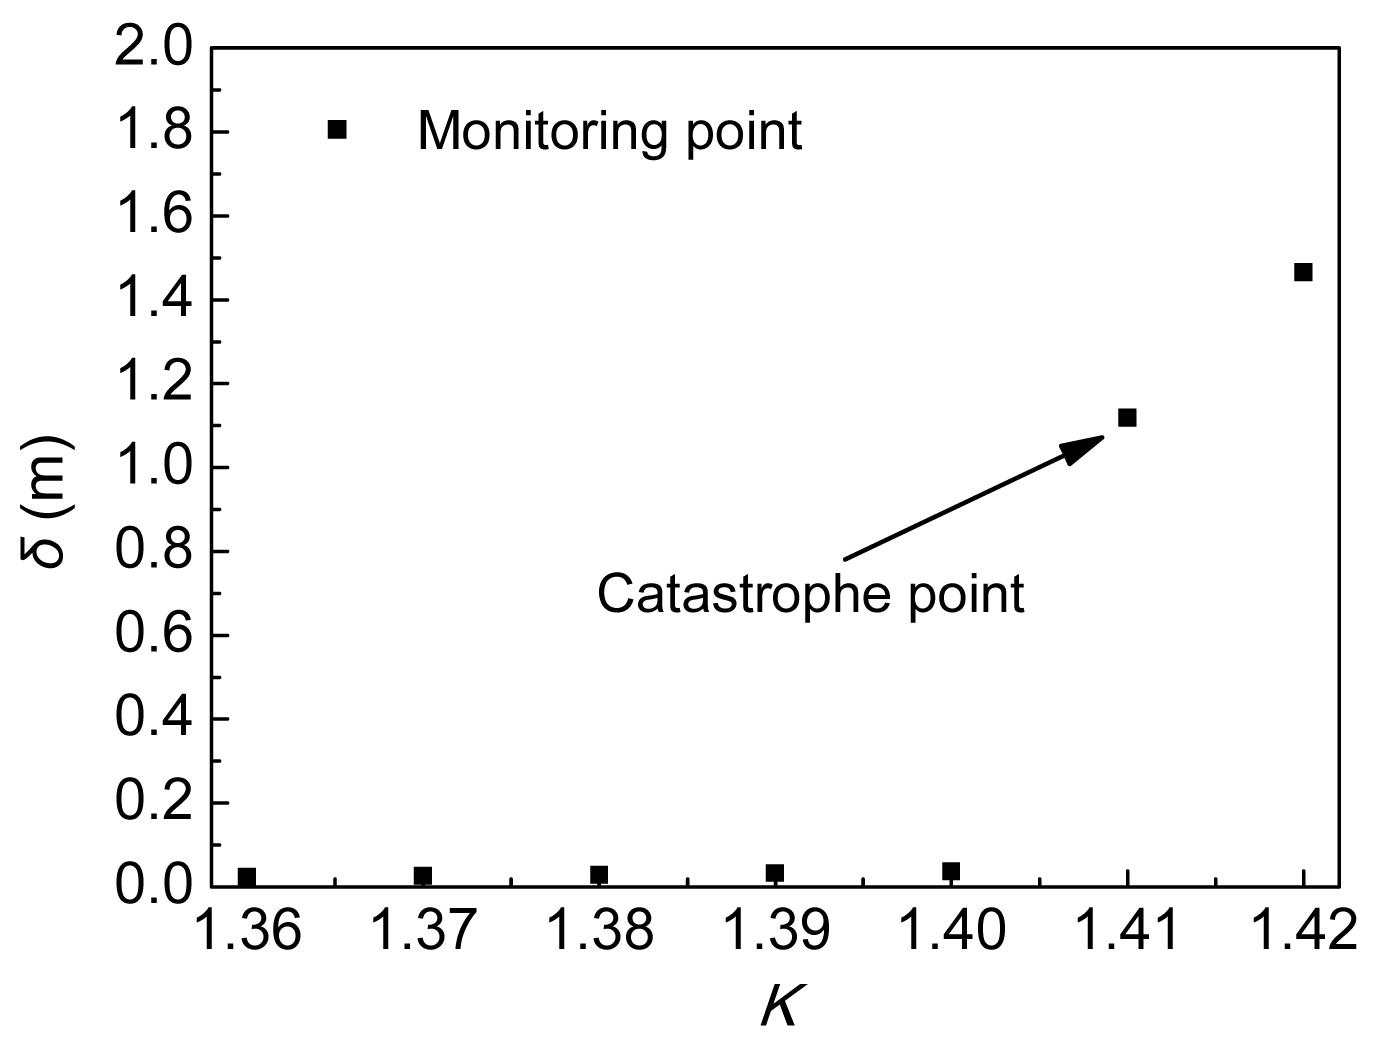
Horizontal displacements of monitoring points (Fig. 9) are monitored with different reduction factors K, as shown in Fig. 10. When the reduction factor is 1.405, the horizontal displacement is 0.76 m, 20.62 times more than that of K=1.40, which can be considered as a catastrophe point. To obtain a more accurate result, we could vary reduction factor from 1.401 to 1.404; the result is shown in Table 11. When K=1.401, mutation occurs, which means the more accurate factor of safety is 1.401. The corresponding critical slip surface is drawn in Fig. 11a with a dashed line.
Fig.10 Relationship between reduction factor and horizontal displacement
Table 11
Values of horizontal displacement when K varies from 1.401 to 1.404 in strain-softening analysis
K
1.401
1.402
1.403
1.404
δ (m)
0.406
0.469
0.564
0.720
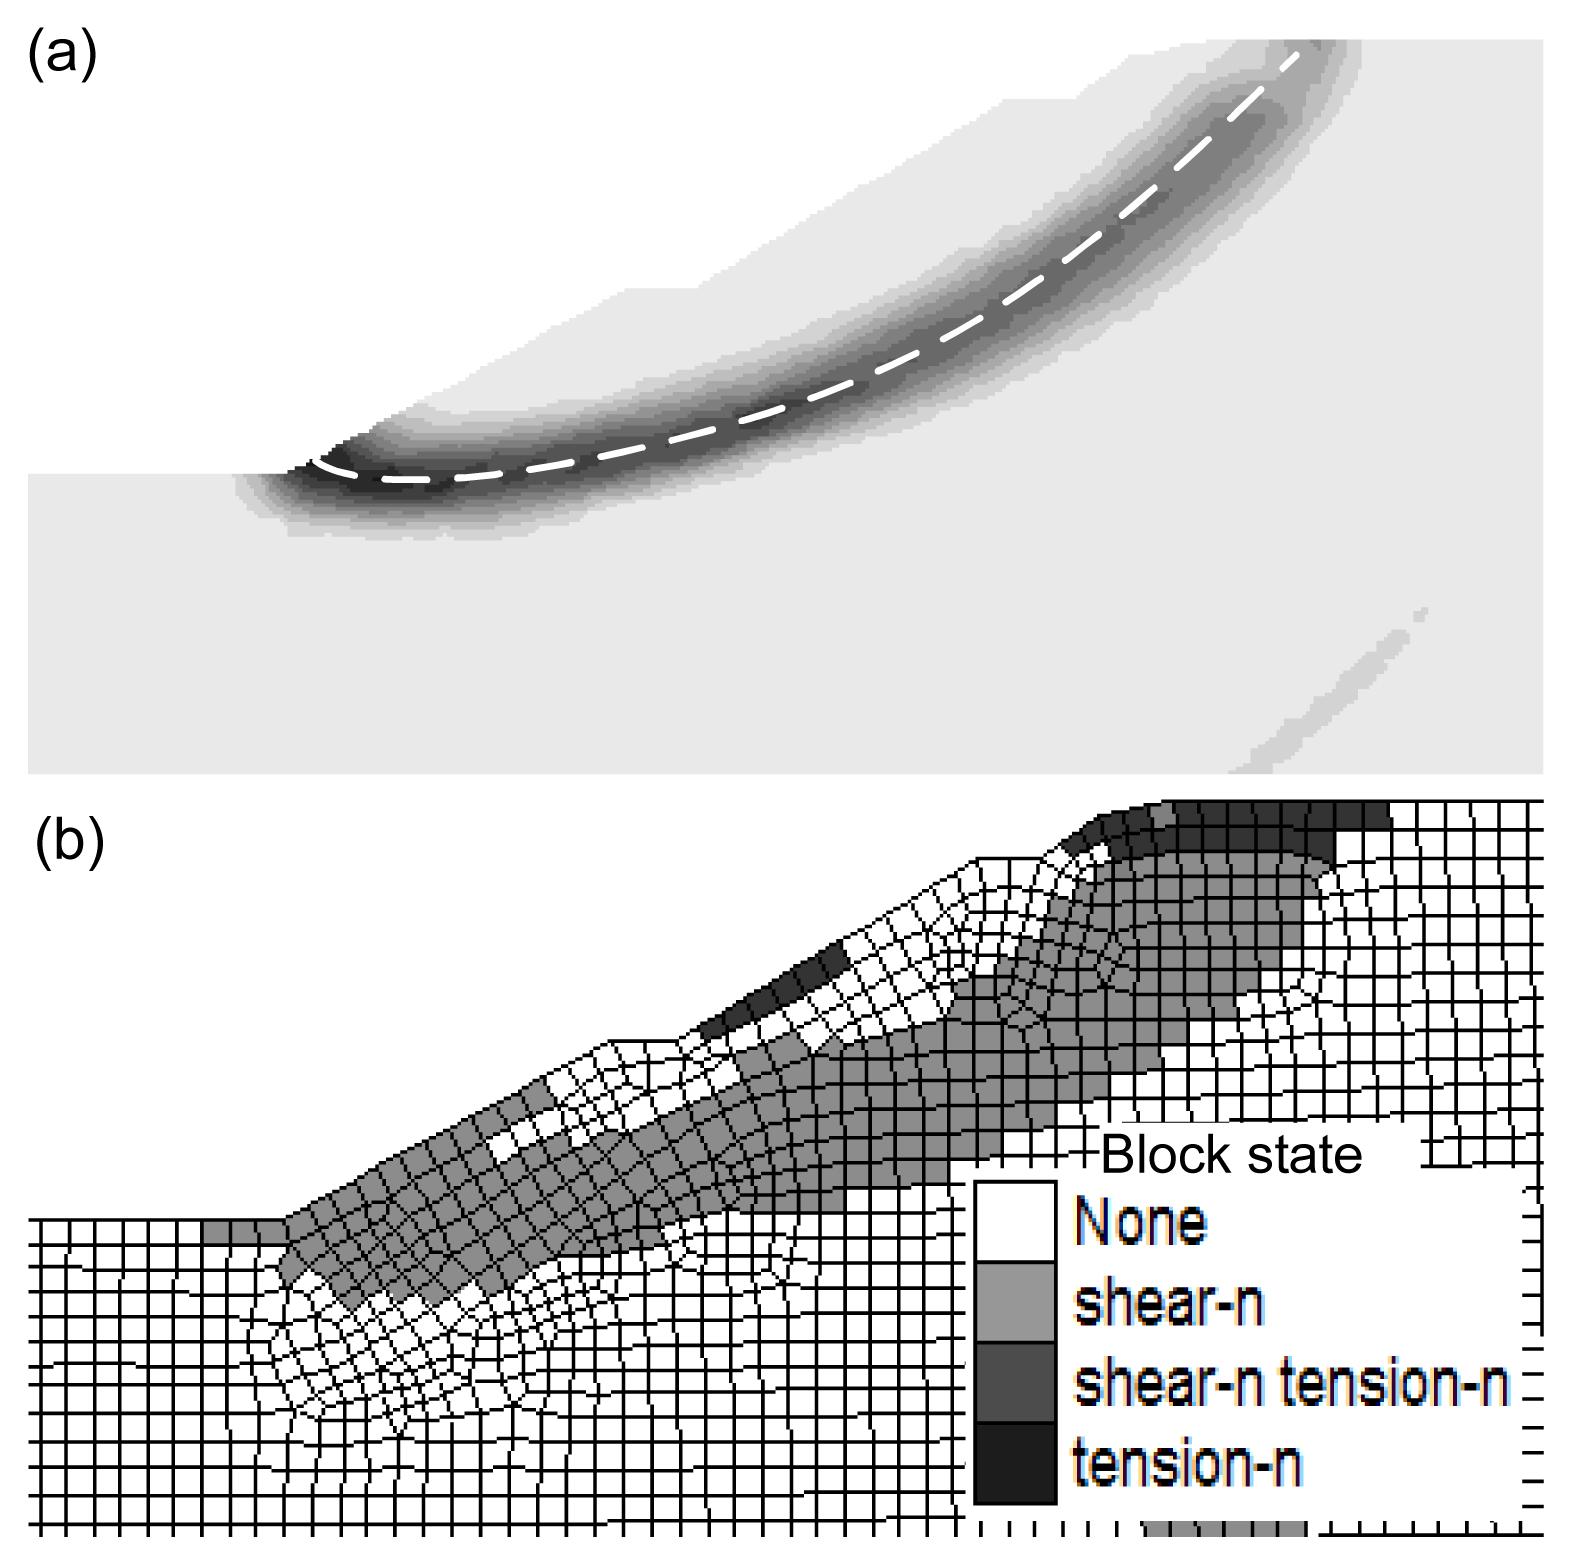
Fig.11 Calculation result (a) Shear strain increment contour and critical slip surface; (b) Distribution of failure zone
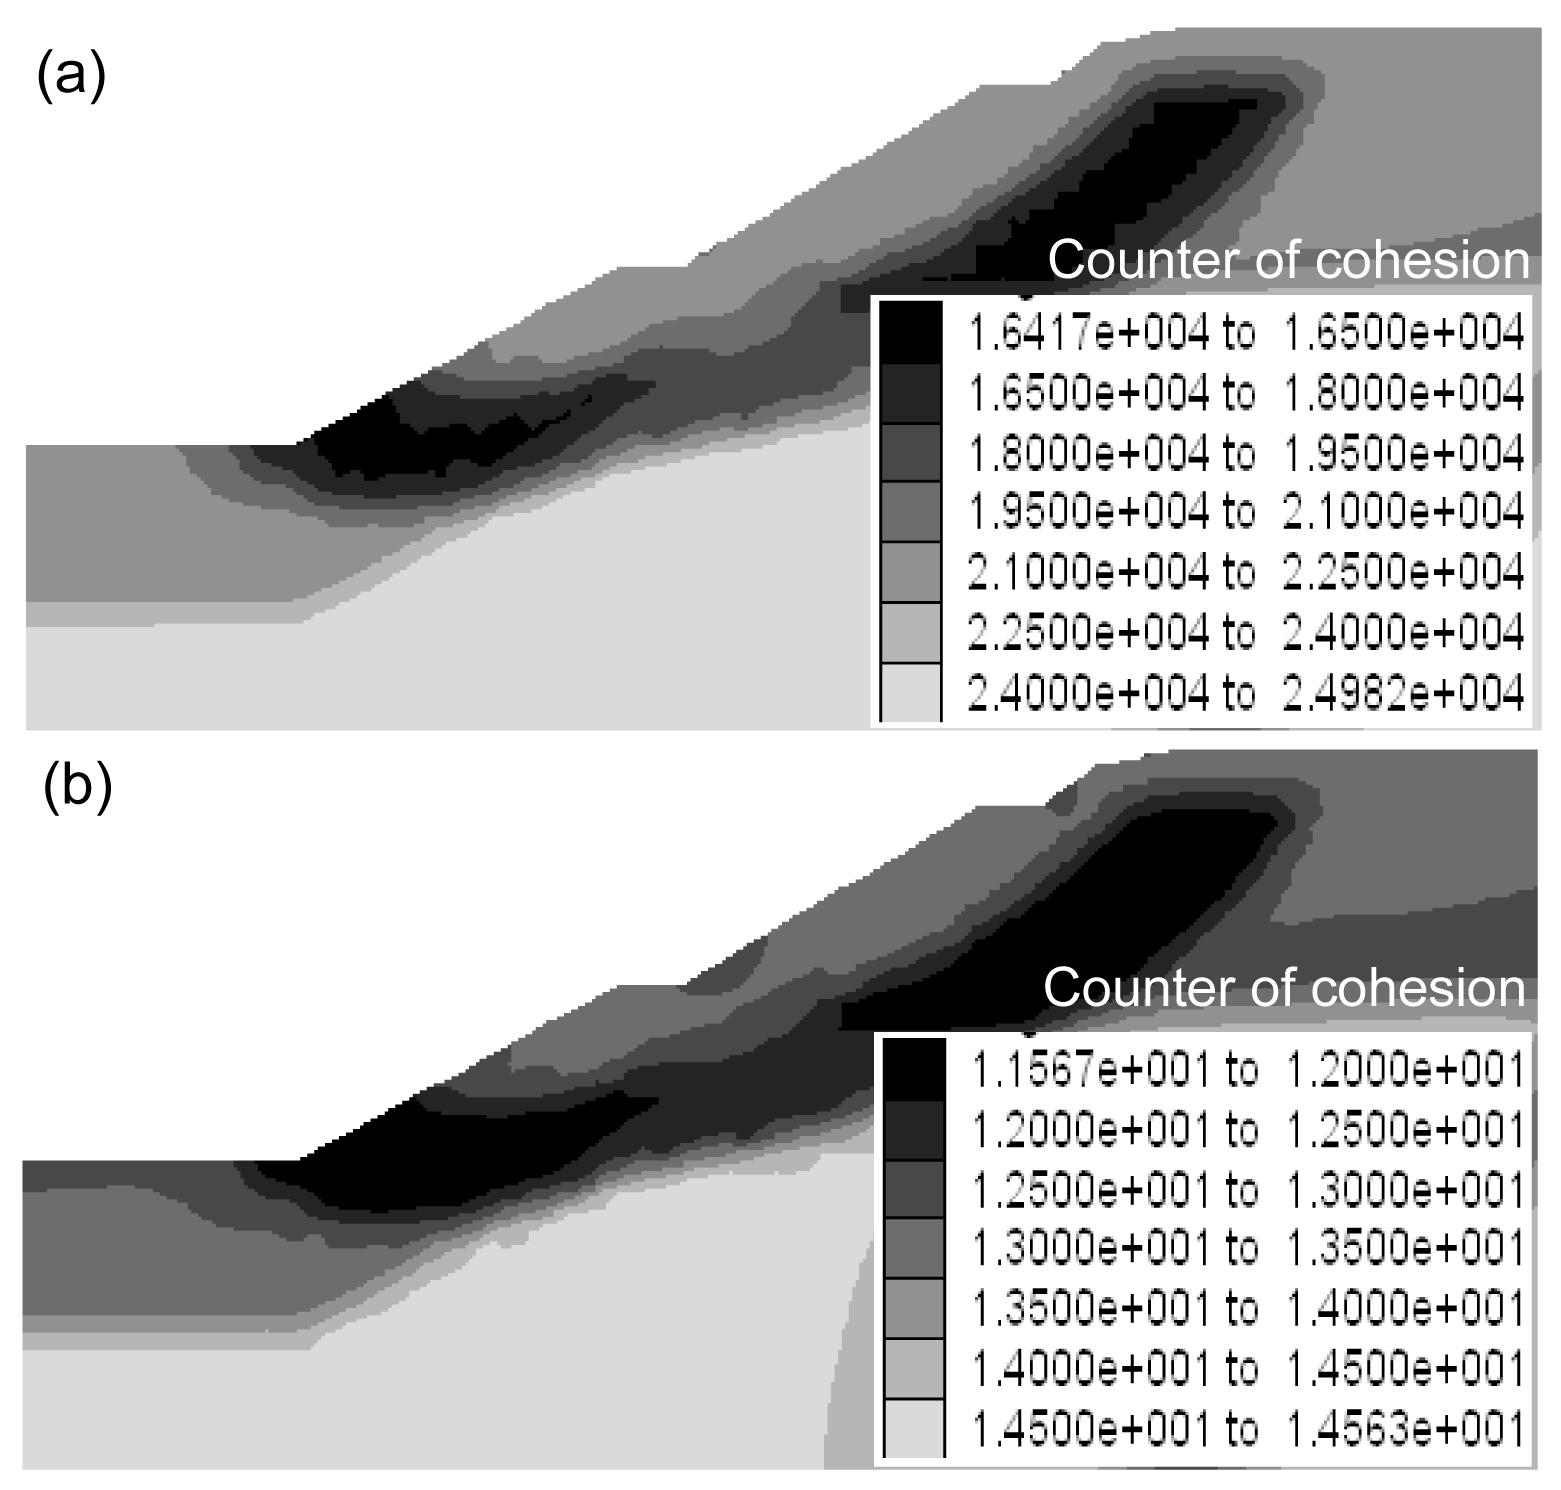
The factors of safety with peak and residual strength parameters are 1.56 and 1.28, respectively. The factor of safety obtained by the present method is in the range of these by peak and residual strength. Counters of strength parameters in the limit equilibrium state are shown in Fig. 12. The strength parameters of slip soil drop to residual parameters except for those of the soil at the crest, which is caused by tension failure (Fig. 11b).
Fig.12 Strain-softening zone in limit equilibrium state (a) Counter of cohesion; (b) Counter of friction
8. Conclusions
A slope stability analysis method based on the strength reduction method and strain-softening model is presented. Failure criterion is determined by identifying the catastrophe point for slopes with strain-softening behaviour.
The present method can truly reflect the initiation, propagation and connection of potential failure surface, as well as the effect of slip-weakening. The analysis with peak strength parameters leads to non-conservative results, while residual strength parameters results in safety.
The effects of deformation parameters are discussed, including residual shear strain threshold, elastic modulus, Poisson’s ratio and dilation angle. The location of critical slip surface and factor of safety are strongly influenced by residual shear strain threshold and elastic modulus. With the increase of residual shear strain threshold, the factor of safety increases and the failure mode of slope changes from shallow slip to deep slip. Poisson’s ratio and dilation angle have little impact on the progressive failure. More attentions should be paid to both the test of peak and residual strength parameters and that of residual shear strain threshold and elastic modulus.
[1] Cheng, Y.M., Lau, C.K., 2008. Slope Stability Analysis and Stabilization, New Methods and Insight. Taylor & Francis Group,London :18-19.
[2] Cheng, Y.M., Lansivaara, T., Wei, W.B., 2007. Two-dimensional slope stability analysis by limit equilibrium and strength reduction methods. Computers and Geotechnics, 34(3):137-150.
[3] Conte, E., Silvestri, F., Troncone, A., 2010. Stability analysis of slopes in soils with strain-softening behaviour. Computers and Geotechnics, 37(5):710-722.
[4] Dawson, E.M., Roth, W.H., Drescher, A., 1999. Slope stability analysis by strength reduction. Gotechnique, 49(6):835-840.
[6] Itasca Consulting Group, Inc., 2005. FLAC: Fast Lagrangian Analysis of Continua in 3 Dimensions User Manual (Version 3.0). Minneapolis,USA :
[7] Khan, Y.A., Jiang, J.C., Yamagami, T., 2002. Progressive failure analysis of slopes using non-vertical slices. Journal of the Japan Landslide Society, 39(2):203-211.
[8] Law, K.T., Lumb, P., 1978. A limit equilibrium analysis of progressive failure in the stability of slopes. Canadian Geotechnical Journal, 15(1):113-122.
[9] Lin, H., Cao, P., Li, J., Liu, Y., 2008. The standards for critical failure state of slope. Journal of China Coal Society, (in Chinese),33(6):643-647.
[10] Liu, C., 2009. Progressive failure mechanism in one-dimensional stability analysis of shallow slope failures. Landslides, 6(2):129-137.
[11] Liu, K., Chen, J., Xie, X., Zhu, X., 2006. Large deformation finite element analysis on excavated slopes. Chinese Journal of Geotechnical Engineering, (in Chinese),28(Supp.):1406-1410.
[12] Locat, A., Leroueil, S., Bernander, S., Demers, D., Jostad, H.P., Ouehb, L., 2011. Progressive failures in eastern Canadian and Scandinavian sensitive clays. Canadian Geotechnical Journal, 48(11):1696-1712.
[13] Mesri, G., Shahien, M., 2003. Residual shear strength mobilized in first-time slope failures. Journal of Geotechnical and Geoenvironmental Engineering, 129(1):12-31.
[14] Miao, T., Ma, C., Wu, S., 1999. Evolution model of progressive failure of landslides. Journal of Geotechnical and Geoenvironmental Engineering, 125(10):827-831.
[15] Potts, D.M., Zdravkovic, L., 1999. Finite Element Analysis in Geotechnical Engineering: Theory. Thomas Telford,London :158-160.
[16] Potts, D.M., Kovacevic, N., Vaughan, P.R., 1997. Delayed collapse of cut slopes in stiff clay. Gotechnique, 47(5):953-982.
[18] Skempton, A.W., 1985. Residual strength of clay in landslide, folded strata and the laboratory test. Gotechnique, 35(1):1-18.
[19] Tang, H.X., 2008. Analysis for Progressive Failure of the Senise Landslide Based on Cosserat Continuum Model. , Proceedings of the 10th International Symposium on Landslides and Engineered Slopes, Xian, China, 945-950. :945-950.
[20] Troncone, A., 2005. Numerical analysis of a landslide in soils with strain-softening behaviour. Gotechnique, 55(8):585-596.
[21] Wang, G., 2000. The progressive failure of slope and the stability analysis. Chinese Journal of Rock Mechanics and Engineering, (in Chinese),19(1):29-33.
[22] Wang, G., Kong, L., Guo, A., Wang, Z., 2005. Element model with shear band and its application to progressive failure analysis of slopes. Chinese Journal of Rock Mechanics and Engineering, (in Chinese),24(21):3852-3857.
[23] Zhang, G., Zhang, J., 2007. Stability evaluation of strain-softening slope based on Swedish slice method. Rock and Soil Mechanics, (in Chinese),28(1):12-16.
[24] Zhang, G., Wang, L., 2010. Stability analysis of strain-softening slope reinforced with stabilizing piles. Journal of Geotechnical and Geoenvironmental Engineering, 136(11):1578-1582.
[25] Zienkiewicz, O.C., Humpheson, C., Lewis, R.W., 1975. Associated and nonassociated visco-plasticity and plasticity in soil mechanics. Gotechnique, 25(4):671-689.
Open peer comments: Debate/Discuss/Question/Opinion


Open peer comments: Debate/Discuss/Question/Opinion
<1>