Affiliation(s):
1.
Institute of Chemical Machinery and Process Equipment, Zhejiang University, Hangzhou 310027, China; moreAffiliation(s): 1.
Institute of Chemical Machinery and Process Equipment, Zhejiang University, Hangzhou 310027, China; 2.
Hangzhou Worldwides Valve Co., Ltd., Hangzhou 311122, China; less
Zhi-jiang Jin, Lin Wei, Li-long Chen, Jin-yuan Qian, Ming Zhang. Numerical simulation and structure improvement of double throttling in a high parameter pressure reducing valve[J]. Journal of Zhejiang University Science A, 2013, 14(2): 137-146.
@article{title="Numerical simulation and structure improvement of double throttling in a high parameter pressure reducing valve", author="Zhi-jiang Jin, Lin Wei, Li-long Chen, Jin-yuan Qian, Ming Zhang", journal="Journal of Zhejiang University Science A", volume="14", number="2", pages="137-146", year="2013", publisher="Zhejiang University Press & Springer", doi="10.1631/jzus.A1200146" }
%0 Journal Article %T Numerical simulation and structure improvement of double throttling in a high parameter pressure reducing valve %A Zhi-jiang Jin %A Lin Wei %A Li-long Chen %A Jin-yuan Qian %A Ming Zhang %J Journal of Zhejiang University SCIENCE A %V 14 %N 2 %P 137-146 %@ 1673-565X %D 2013 %I Zhejiang University Press & Springer %DOI 10.1631/jzus.A1200146
TY - JOUR T1 - Numerical simulation and structure improvement of double throttling in a high parameter pressure reducing valve A1 - Zhi-jiang Jin A1 - Lin Wei A1 - Li-long Chen A1 - Jin-yuan Qian A1 - Ming Zhang J0 - Journal of Zhejiang University Science A VL - 14 IS - 2 SP - 137 EP - 146 %@ 1673-565X Y1 - 2013 PB - Zhejiang University Press & Springer ER - DOI - 10.1631/jzus.A1200146
Abstract: In this paper, a new pressure reducing valve (PRV) with an orifice plate is proposed. The main objective is to explain the mechanisms of pressure reduction and energy conversion in the new PRV. A numerical simulation method was used to investigate the PRV internal flow field and to analyze the throttling effects of the orifice plate and the transform of thermal parameters as outlet pressure, outlet temperature, velocity, and superheat. A structure improvement method for the valve body and orifice plate is put forward to reduce energy loss. The governing equations for internal flow numerical simulation are composed of the continuity, momentum, energy and k-ε transport equations, based on isotropic eddy viscosity theory. Different valve plug displacement models were built to describe the double throttling process. Our analysis shows that the steam pressure drops twice and the degree of superheat increases. There are also lots of eddies which clog the flow channel and disturb the steam flow in the valve cavity after the valve plug and the outlet cavity. After modifying the structure, the numerical results show a better performance of steam flow.
Darkslateblue:Affiliate; Royal Blue:Author; Turquoise:Article
Article Content
1. Introduction
Pressure and temperature reducing systems are energy-saving devices used to regulate steam parameters, and utilize waste heat in cogeneration and central heating engineering. As various kinds of thermal energy units with high flow and high parameters (inlet pressure≥10 MPa, inlet temperature ≥540 °C) become increasingly common in fields such as large coal and chemical industries, large capacity generating sets, and megaton ethylene projects, the performance requirements of pressure and temperature reducing systems are also increasing. A pressure reducing valve (PRV) is a kind of control valve which can change steam pressure in a pressure and temperature reducing system. However, current PRVs cannot be adapted for high parameter working conditions because of their low accuracy of pressure adjustment, large energy loss and loud noise. So a new high parameter PRV with a double throttling structure is developed.
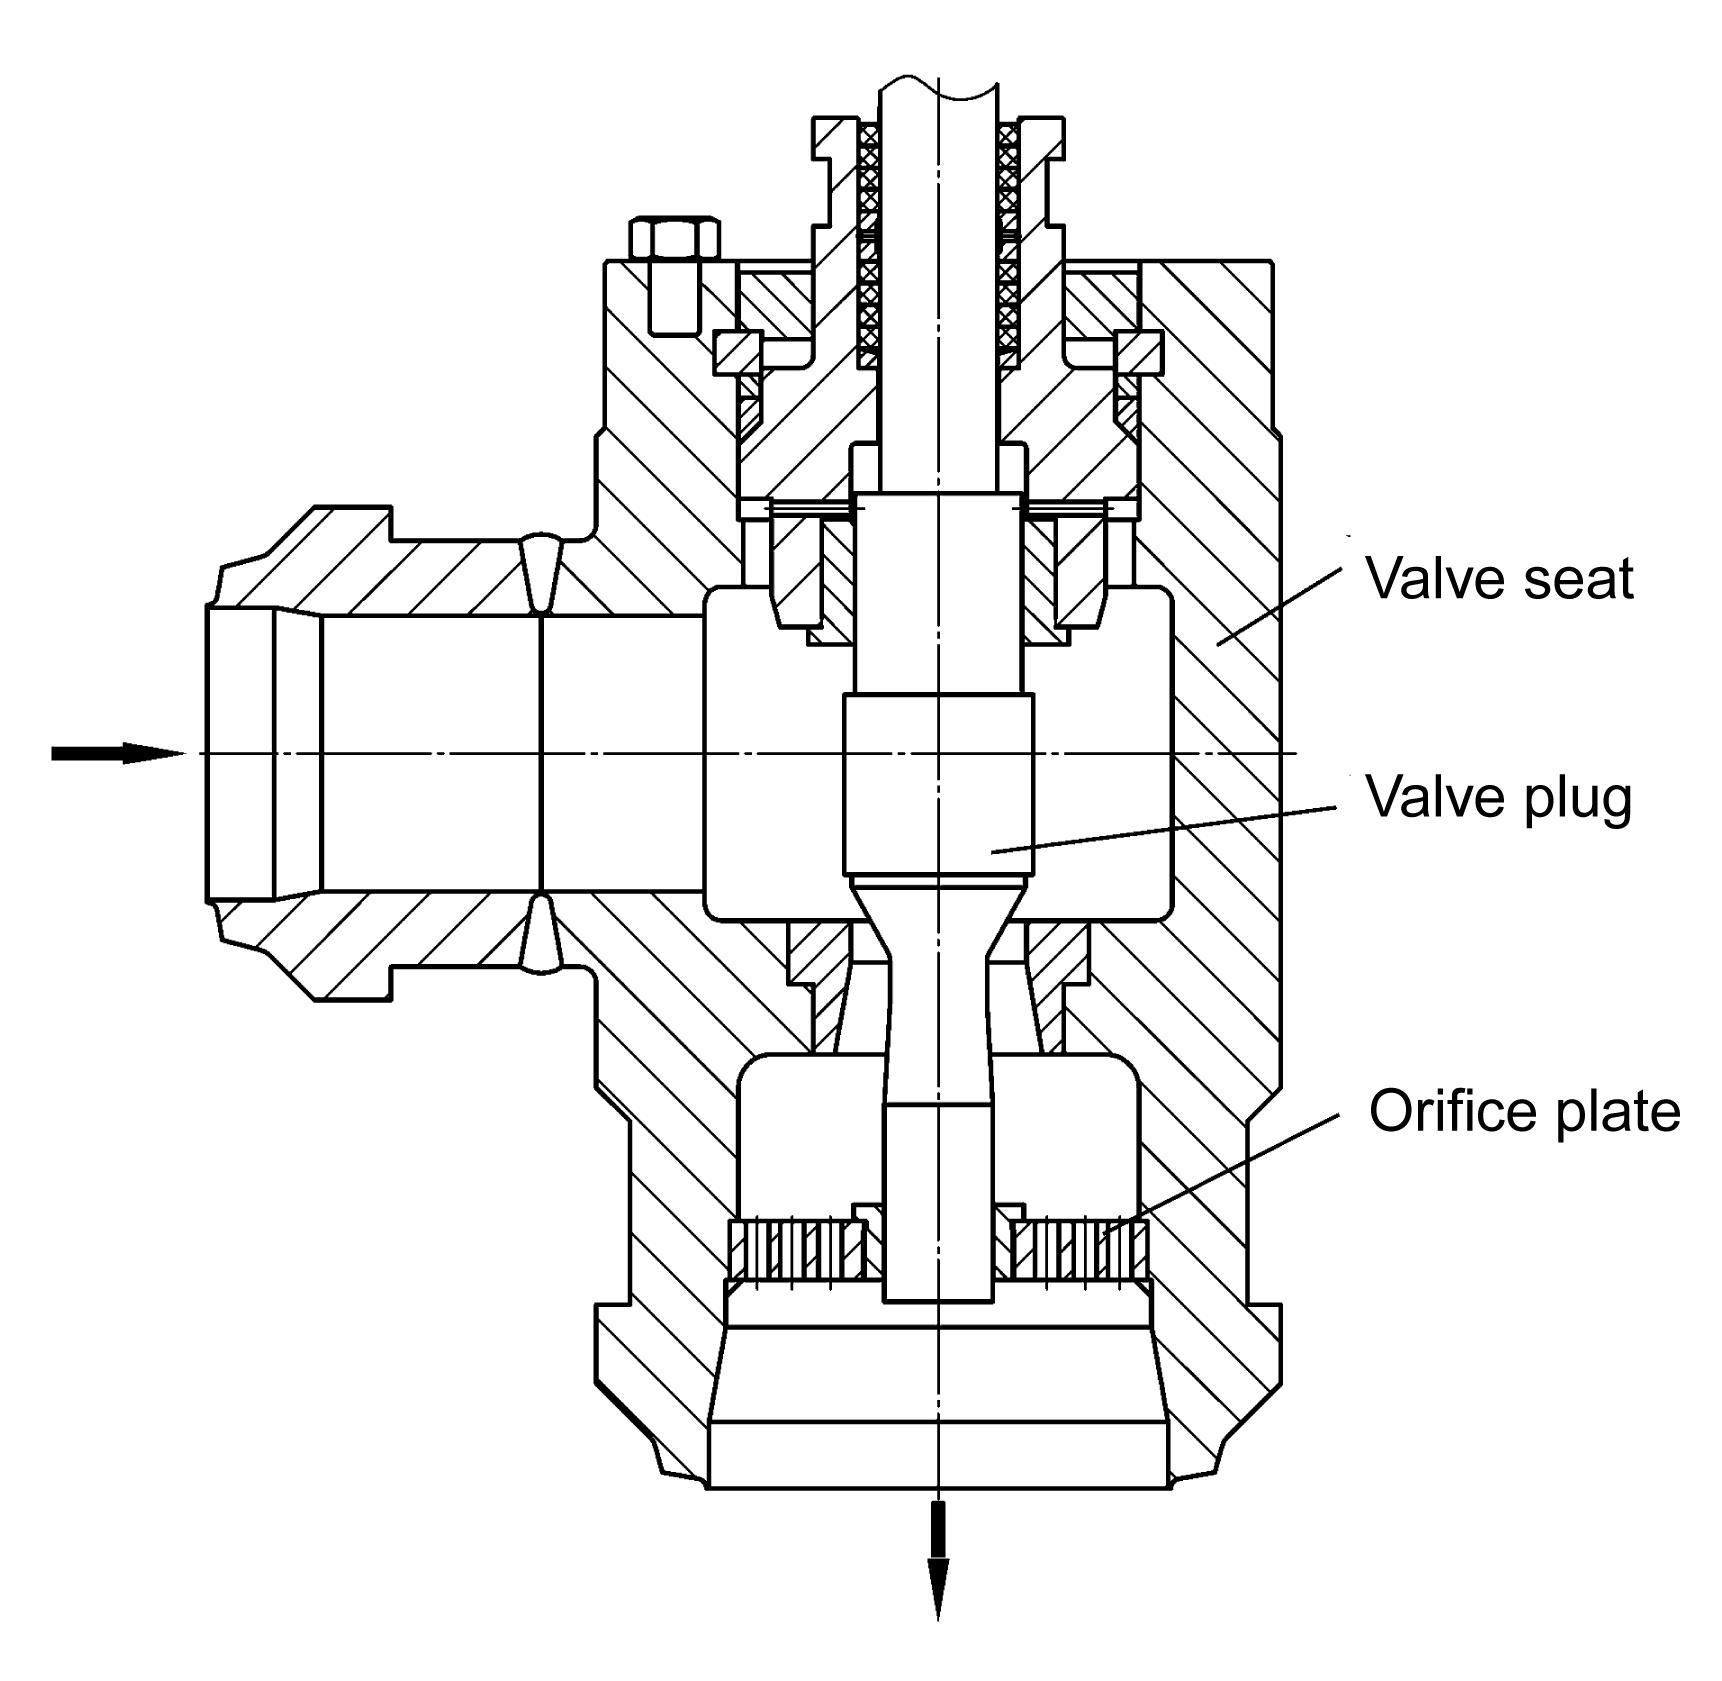
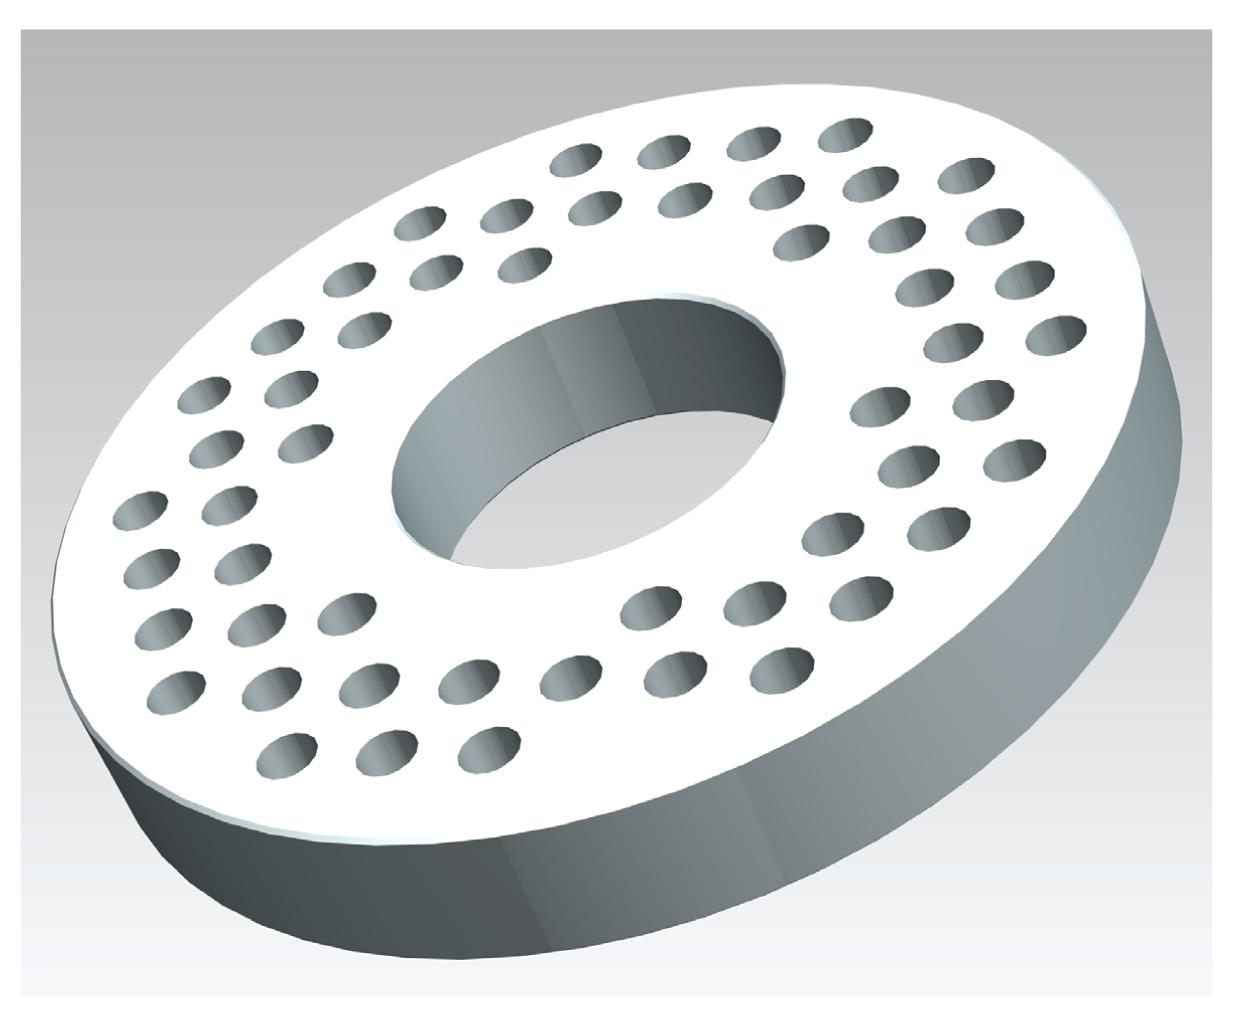
The new high parameter PRV (Fig. 1) combines a forge-welded angle-type single seat plug with a throttling orifice plate (Fig. 2). The PRV can reduce steam pressure by adjusting the displacement of the valve plug. To reduce further the steam pressure, a throttling orifice plate is fixed after the valve seat, which can realize steam expansion in the “limited space” and reduce noise. The PRV can be applied to high temperature, high pressure ratio and high flow conditions, and has characteristic features of high pressure adjustment precision, quick adjusting speed, small energy loss and low noise.
Fig.1 Structure diagram of the new high parameter PRV
Fig.2 Throttling orifice plate
Most previous studies on valves were based on experiments and mathematical models, which were time-consuming but provided reliable results. Amini and Owen (1995) provided a practical solution to the problem of noise and vibration in a PRV. By changing the design of the original flat plug and seat, noise and mechanical vibration were significantly reduced. Prescott and Ulanicki (2003) developed four dynamic models, two phenomenological, one behavioral, and one linear, to represent the behavior of PRVs. Among those models, the behavioral model is simpler and sufficient for most practical purposes. Fester et al. (2007) completed many experiments in studies of the relationship between the loss coefficient and the Reynolds number.
With the booming development of computers, the finite element method has generally been applied to research on fluid flow, since it can give a clear insight into the physics of the flow. Also, the accuracy of numerical simulation methods has been validated with experimental data (Kim et al., 2007; Chen et al., 2009). A number of studies have applied numerical techniques to flow in valves. Mokhtanadeh-Dehghan et al. (1997) obtained the velocity and pressure distributions through the value and the magnitude of the lift forces on the plunger using finite element analysis. Amirante et al. (2006a; 2006b) analyzed the driving forces on a 4/3 hydraulic open center directional control valve with experimental and numerical methods. Amirante et al. (2007) investigated the fluid dynamic behavior of a proportional valve and presented a full description of all geometric features of the valve chambers and of the effects on the flow field. Cho et al. (2007) derived a force balance equation and evaluated the pressure distribution and forces acting on the top and bottom planes of the valve plug. Some studies on transient numerical models of control valves were reported by Kerh et al. (1997) and Shin et al. (2008), which also have significance for engineering applications. Most researchers focus on the distribution of characteristics in the valve and the flow patterns. Gao et al. (2002) studied the cavitating flow through water hydraulic poppet valves using numerical and experimental methods. They obtained the binary cavitating flow field distribution which showed a good agreement with numerical results. Casoli et al. (2010) described a numerical procedure for the prediction of the performance of high pressure homogenizing valves based on a strict interaction between a computational fluid dynamics (CFD) code and a homogenizing simulation code. An et al. (2010) carried out an analysis of the incompressible turbulent flow through a high pressure drop control valve and investigated pressure drop, the effect of cavitations and the flow coefficient. Yang et al. (2011) conducted 3D numerical simulations to determine flow patterns and to measure valve flow coefficients and flow fluctuations, and provided methods to improve the performance of the valve. Beune et al. (2011) validated a numerical valve model to predict the discharge capacity and the opening characteristics of high pressure safety valves. A computational study of the flow process in a pressure regulating valve was proposed by Chattopadhyay et al. (2012) to analyze compressible flow with high levels of turbulence.
This paper uses a numerical simulation method to investigate the PRV internal flow field to reveal the mechanisms of pressure reduction and energy conversion, and proposes a structure improvement method to reduce energy loss in the PRV. The governing equations for the internal flow numerical simulation include the continuity, momentum, energy and k-ε transport equations based on isotropic eddy viscosity theory. Different valve plug displacement models were built to describe the double throttling process. Then, according to the results of numerical simulation, the structure was modified. This study can provide technological support for energy saving and noise reduction in PRVs.
2. Mathematical model
Since the actual steam flow in the PRV is a turbulent flow, we used the standard k-ε model. The governing equations to be solved were:
Continuity equation:
,
where v is the velocity vector, and ρ is the density.
Momentum equation:
,
where p is the static pressure, and ρg is the gravitational body force. The viscous shear stress tensor τ is given by
,
where μ is the kinetic viscosity, and I is the unit tensor.
Energy equation:
,
where λeff is the effective conductivity, which consists of the thermal conductivity and the turbulent thermal conductivity, τeff is the effective stress tensor, and T is the static temperature. E represents the fluid energy and is defined as
,
where h is the sensible enthalpy.
The turbulent kinetic energy, k, and its rate of dissipation, ε, are obtained from the following transport equations:
,
,
where x is the displacement vector, i is the free index and j is the dummy index. Gk represents the generation of turbulent kinetic energy due to mean velocity gradients, Gb is the generation of turbulent kinetic energy due to buoyancy, and YM represents the contribution of the fluctuating dilatation in compressible turbulence to the overall dissipation rate. The quantities αk and αε are the inverse effective Prandtl numbers for k and ε, respectively. The model coefficients are given by C1ε=1.42, C2ε=1.68.
The effective turbulent viscosity, μeff, is computed by combining k and ε as follows:
,
where Cμ=0.0845.
The Rε term which could yield a lower turbulent viscosity in a rapidly strained flow, is the main difference between the RNG k-ε model (based on renormalization group theory) and standard k-ε model.
For compressible flows, the gas law is as follows:
,
where pop represents environmental pressure, R is the universal gas constant, Mw is the molecular weight. The density ρ is a variable quantity which is calculated from the static pressure and temperature, and the temperature T is computed from the energy equation.
3. Mesh and boundary conditions
For the complex internal structure of the PRV, a 3D solid model was created in the modeling software UG-NX. Then the model was imported into Gambit, the CFD pre-processing software, for mesh generation. Models were of different valve plug displacements. For a clearer expression, valve opening is defined as
,
where l and lmax is the displacement and maximum displacement of the valve plug, respectively.
Then valve openings of 20%, 40%, 60%, 80% and 100% were analyzed. Taking the 60% opening as an example, Fig. 3 shows the PRV internal flow model. Because the structure is symmetrical, only half of the flow field model was built. There are three cavities, the inlet cavity, outlet cavity and the cavity after valve plug. The valve plug is in the middle of the valve body. Around the conical surface of the valve plug is the valve seat. The inlet diameter is 175 mm, the outlet diameter is 275 mm and the half conical angle of the valve plug is 29°.
Fig.3 Computational model for steam flow
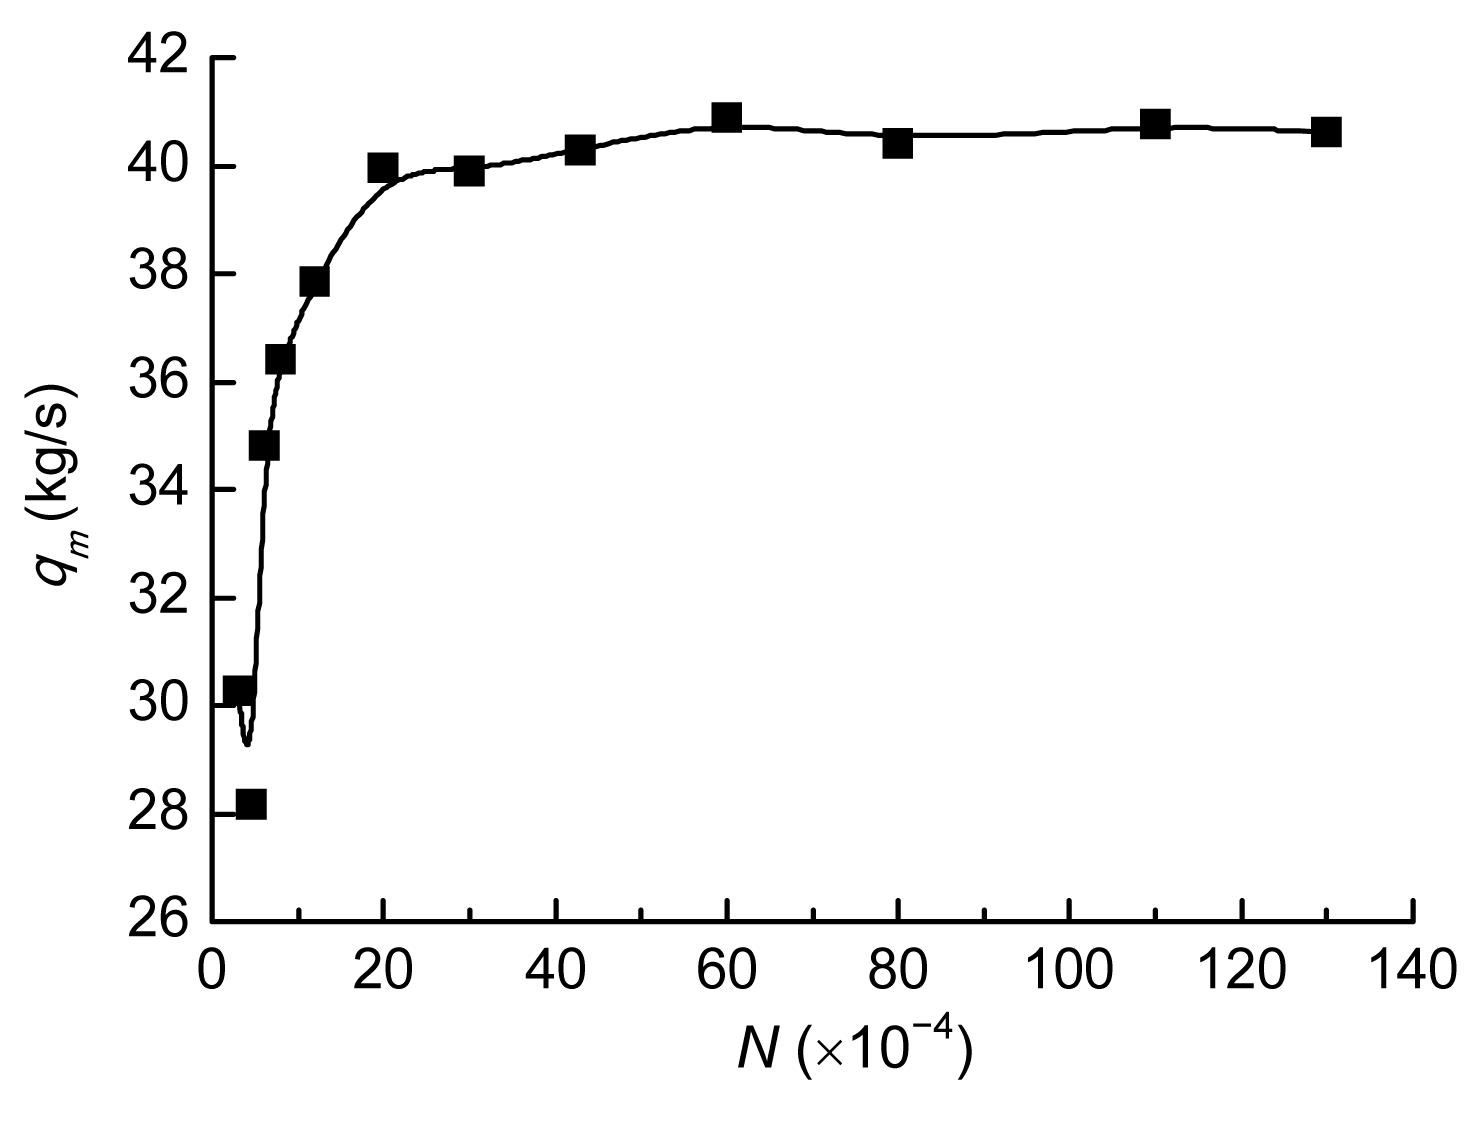
The flow field was divided into six parts: four parts were meshed with structured grid while the other two were meshed with unstructured grid. The mesh quality was rigorously checked for parameters such as skewness and aspect ratio. Grid independence was also checked (Fig. 4). As the number of grids N increases, the mass flow rate qm becomes stable. Considering both accuracy and computational efficiency and limiting the deviation within 2%, a mesh of about 430 000 cells was chosen.
Fig.4 Grid independence check
For the 3D simulations, the boundary conditions were:
(a) Inlet: on this surface, the total pressure value was set to 1×10⁷ Pa, and the total temperature was set to 813.15 K.
(b) Outlet: on this surface, the static pressure value was set to 1×10⁶ Pa. Because the flow is isentropic expansion, the outlet temperature was also set to 813.15 K. Moreover, a target flux was appointed and the velocity vector was normal to the boundary.
(c) Wall: except for the inlet, outlet and symmetry planes, other surfaces were wall surfaces. No-slip boundary condition was assumed.
An ideal compressible gas model was used and the energy equation was activated. According to the geometric parameters and physical properties of steam under working status, the Reynolds number is higher than 105, so the flow is classified as severe turbulent flow. In addition, the RNG k-ε model proved to be the more accurate to describe the flow inside the valve (Xu et al., 2011). Thus, the RNG k-ε turbulent model and density-based solver were used to simulate the compressible gas flow of high Reynolds number.
4. Results and discussion
To observe the steam flow regime inside, an accurate analysis of the fluid dynamic status in the valve was performed. For a high parameter pressure reducing valve, valve openings of 20%, 40%, 60%, 80%, 100% were simulated. Four aspects were observed and the results are described below.
4.1. Phenomenon of choked flow
For high pressure reducing valve, choked flow is a challenging flow phenomenon (Beune et al., 2011). When fluid at a given pressure and temperature passes through a restriction into a lower pressure environment, the fluid velocity increases. At initially subsonic upstream conditions, the conservation of mass principle requires the fluid velocity to increase as it flows through the smaller cross-sectional area of the restriction. When the pressure ratio is large enough, the fluid velocity equals the velocity of sound at the restriction and does not increase further. Thus, the mass flow rate will not increase with a further decrease in the downstream pressure environment while the upstream pressure is fixed. This phenomenon is called choked flow.
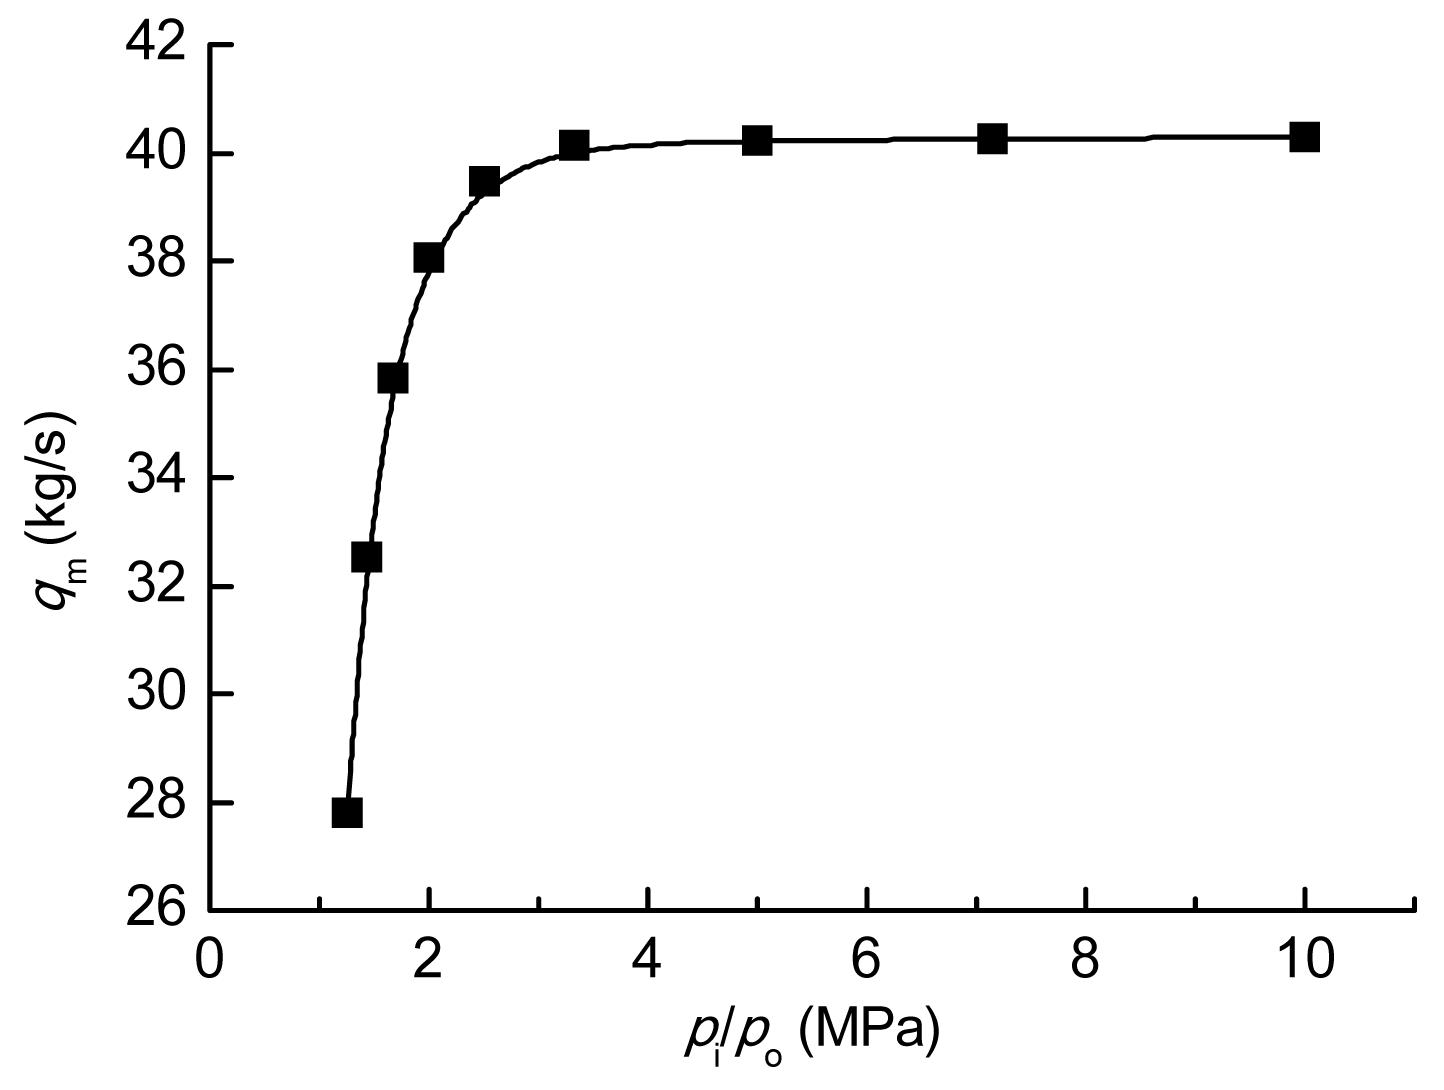
In this work, different outlet pressure models were built to investigate the phenomenon of choked flow. Fig. 5 taking 60% open model as an example, shows the relationship between the mass flow rate and the pressure ratio (while pi=10 MPa). When the pressure ratio is lower than about 3.3, the mass flow rate increases with the decrease in outlet pressure, and when the pressure ratio is larger than 3.3, the mass flow rate almost stabilizes. Thus, in the work conditions (where the outlet pressure equals 1 MPa) the pressure is 10, and choked flow occurs. Therefore, during the process of throttling, the steam is in the status of supersonic flow.
Fig.5 Phenomenon of choked flow of a 60% open valve
4.2. Effects of throttling structures on pressure
Through the throttling structures the steam pressure decreases, and remains stable in the inlet cavity, outlet cavity and the cavity after valve plug. Pressure changes greatly when the steam travels through the throttling components. The numerical results are shown in Figs. 6–8.
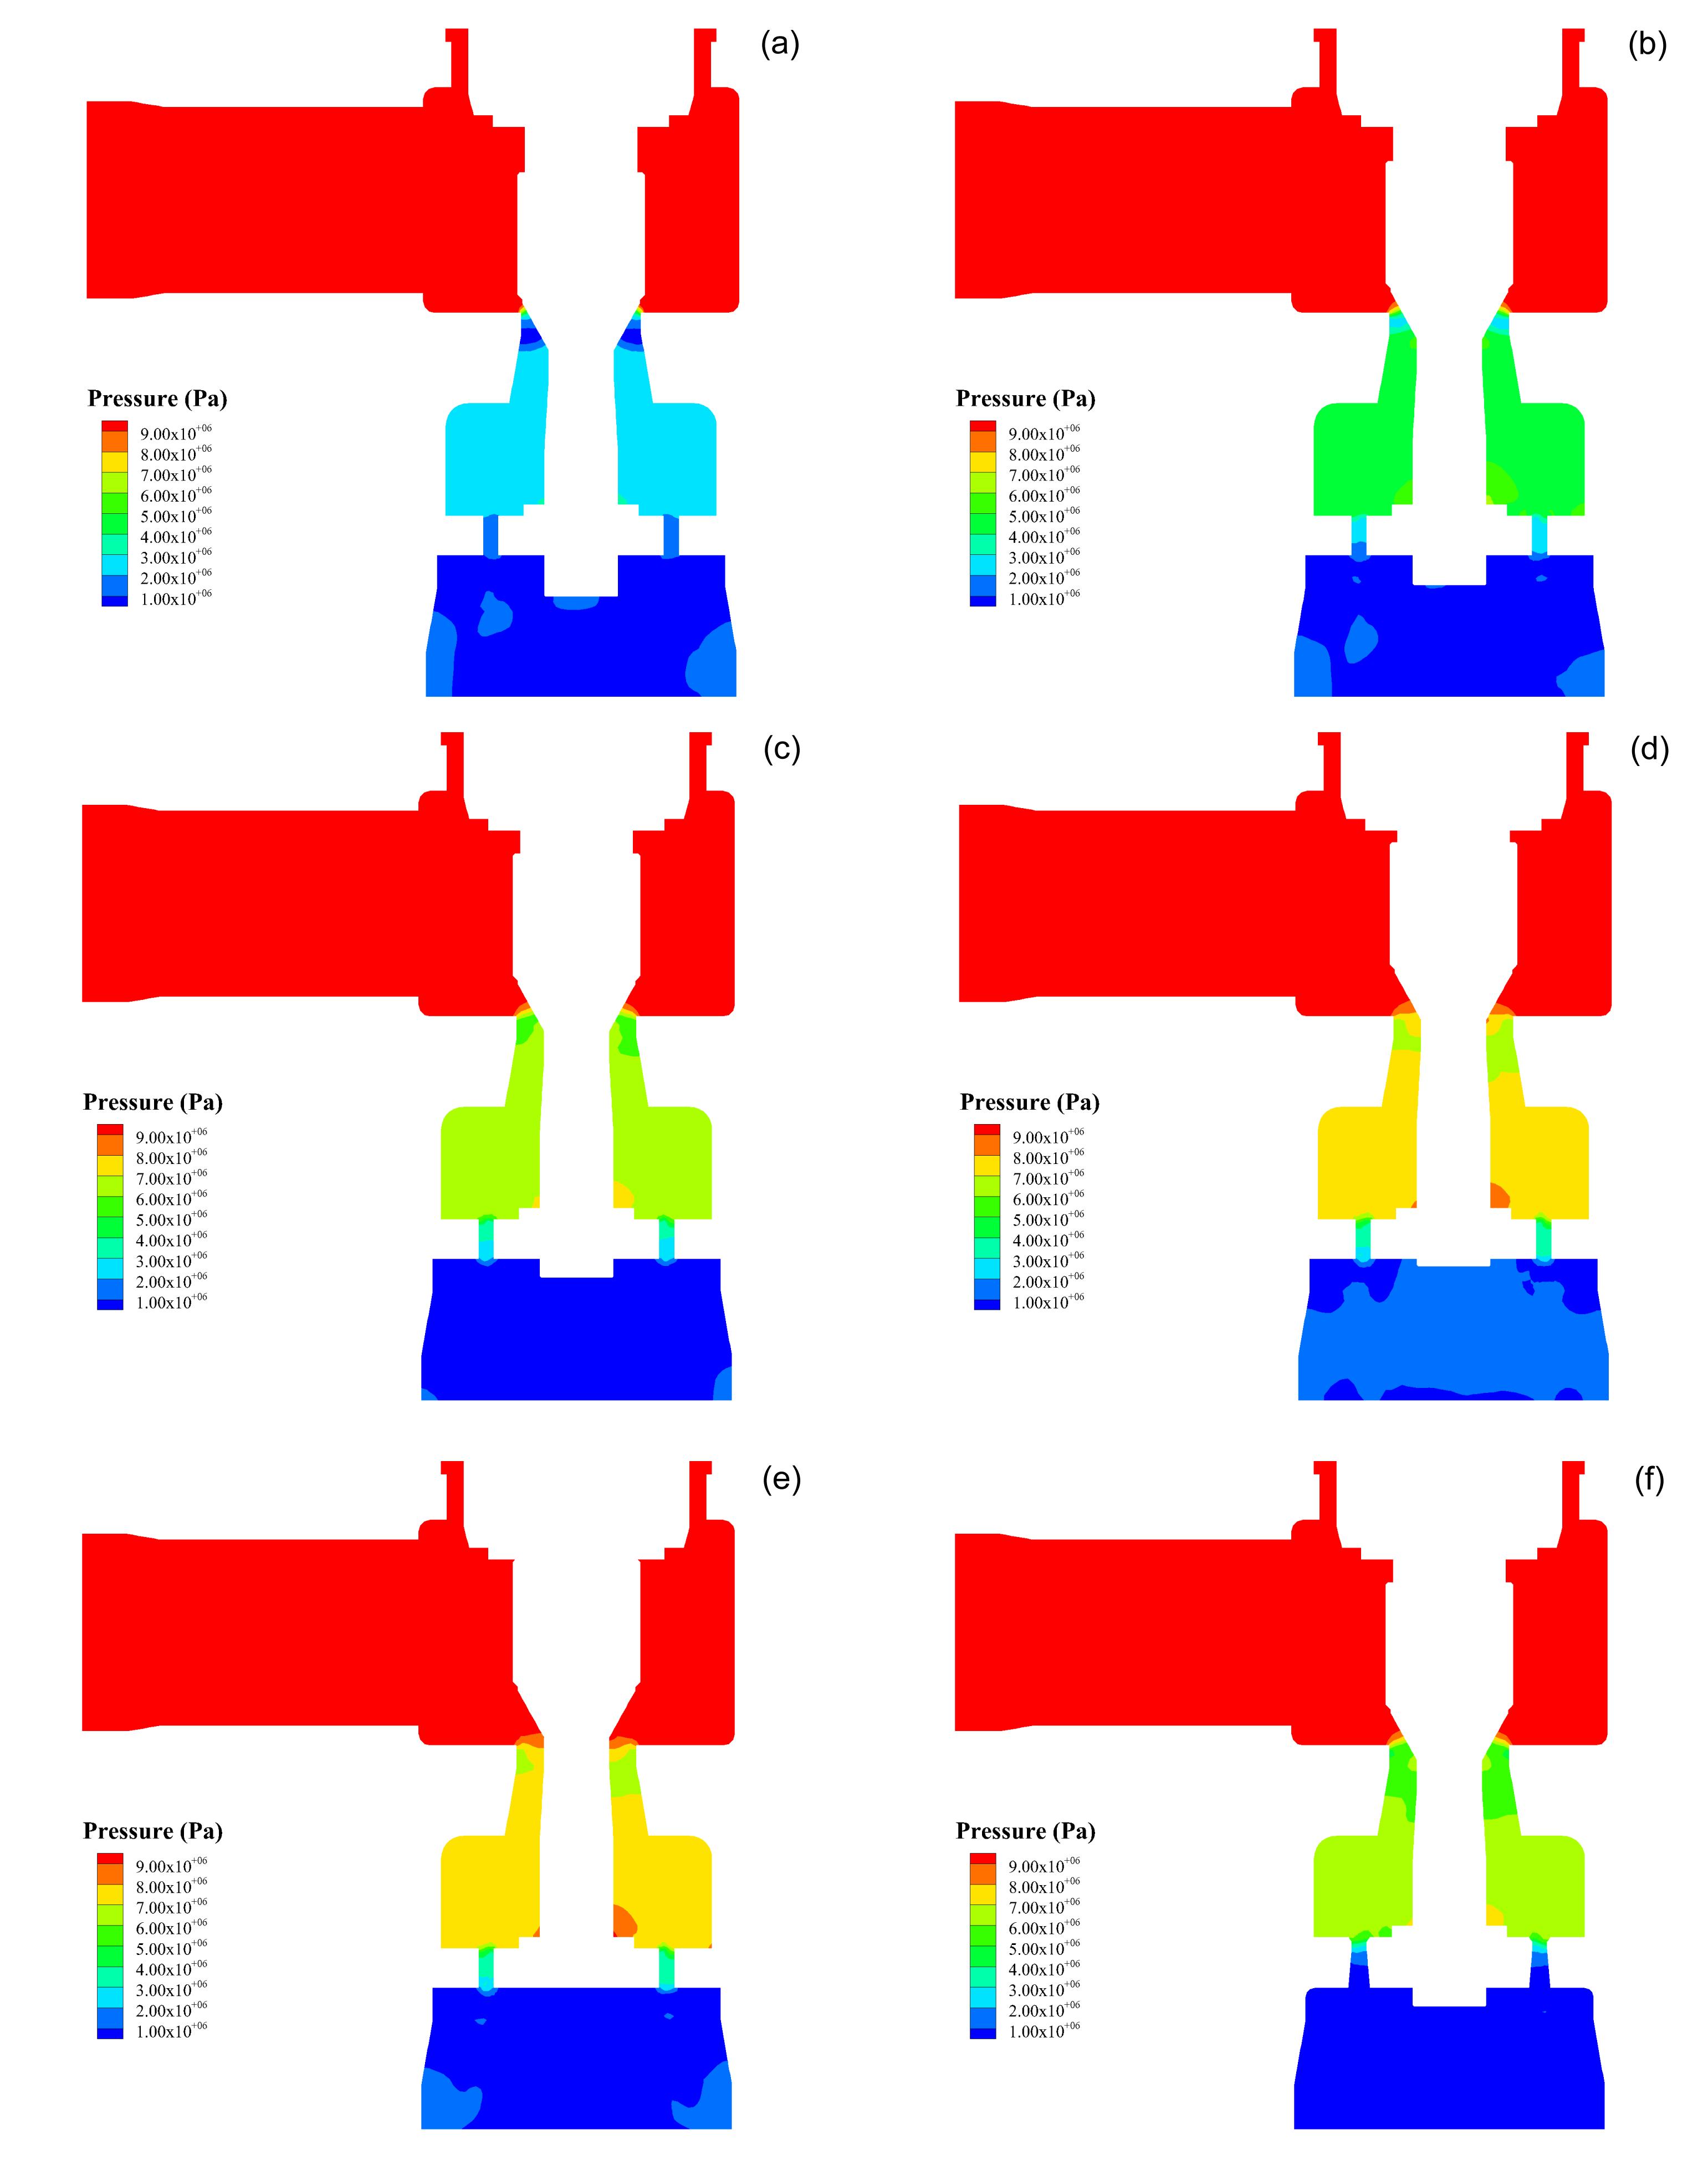
As the valve opening increases, the maximum point of the pressure gradient transfers from the valve plug to the orifice plate (Fig. 6). Through the valve plug, the pressure first reduces then increases again, but the pressure does not return to the original value. Take Fig. 6b for example. From the entry to the valve plug the steam pressure changes very little. Around the conical surface of the valve plug the flow area decreases suddenly, and the steam is compressed isentropically, so the pressure and temperature suddenly rise. At the same time, the steam turbulent intensity becomes very high and the energy dissipation of the turbulence is very high. When the steam flows beyond the valve plug, because the flow area increases, it expands adiabatically. Due to the severe turbulence, too much energy is dissipated, so the pressure cannot reach the value before throttling. As the steam flows through the orifice plate, its pressure shows the same pattern of an initial drop followed by a micro increase.
Fig.6 Contours of pressure for different valve openings (a) 20% open; (b) 40% open; (c) 60% open; (d) 80% open; (e) 100% open; (f) 60% open improved
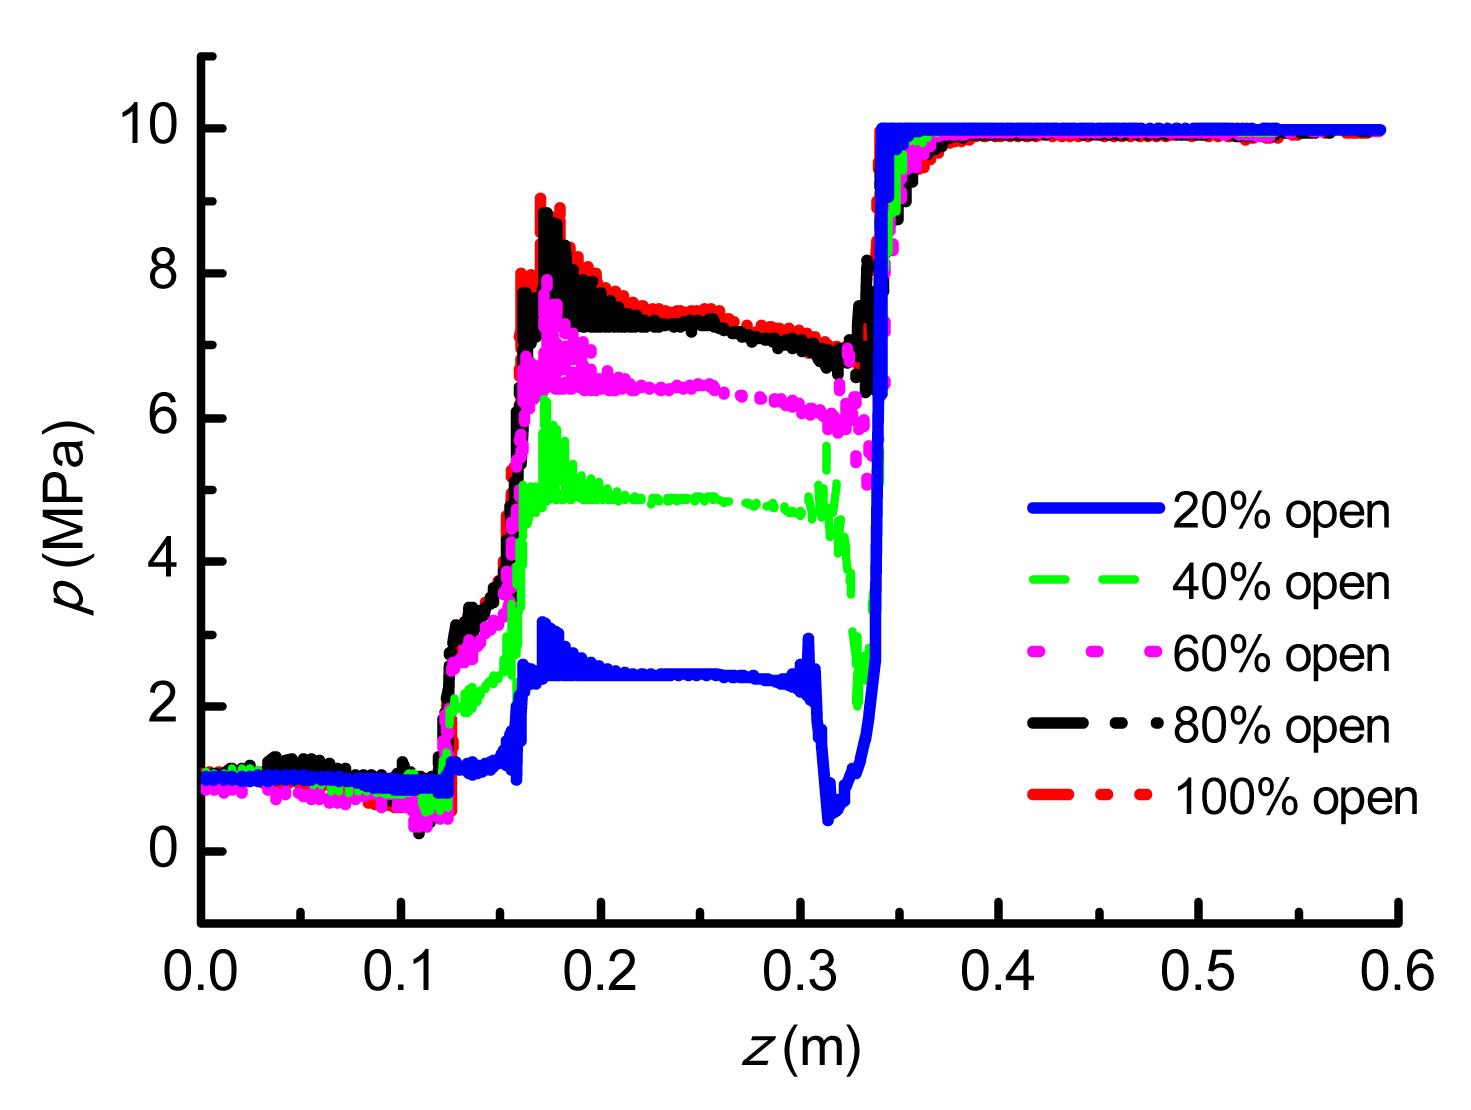
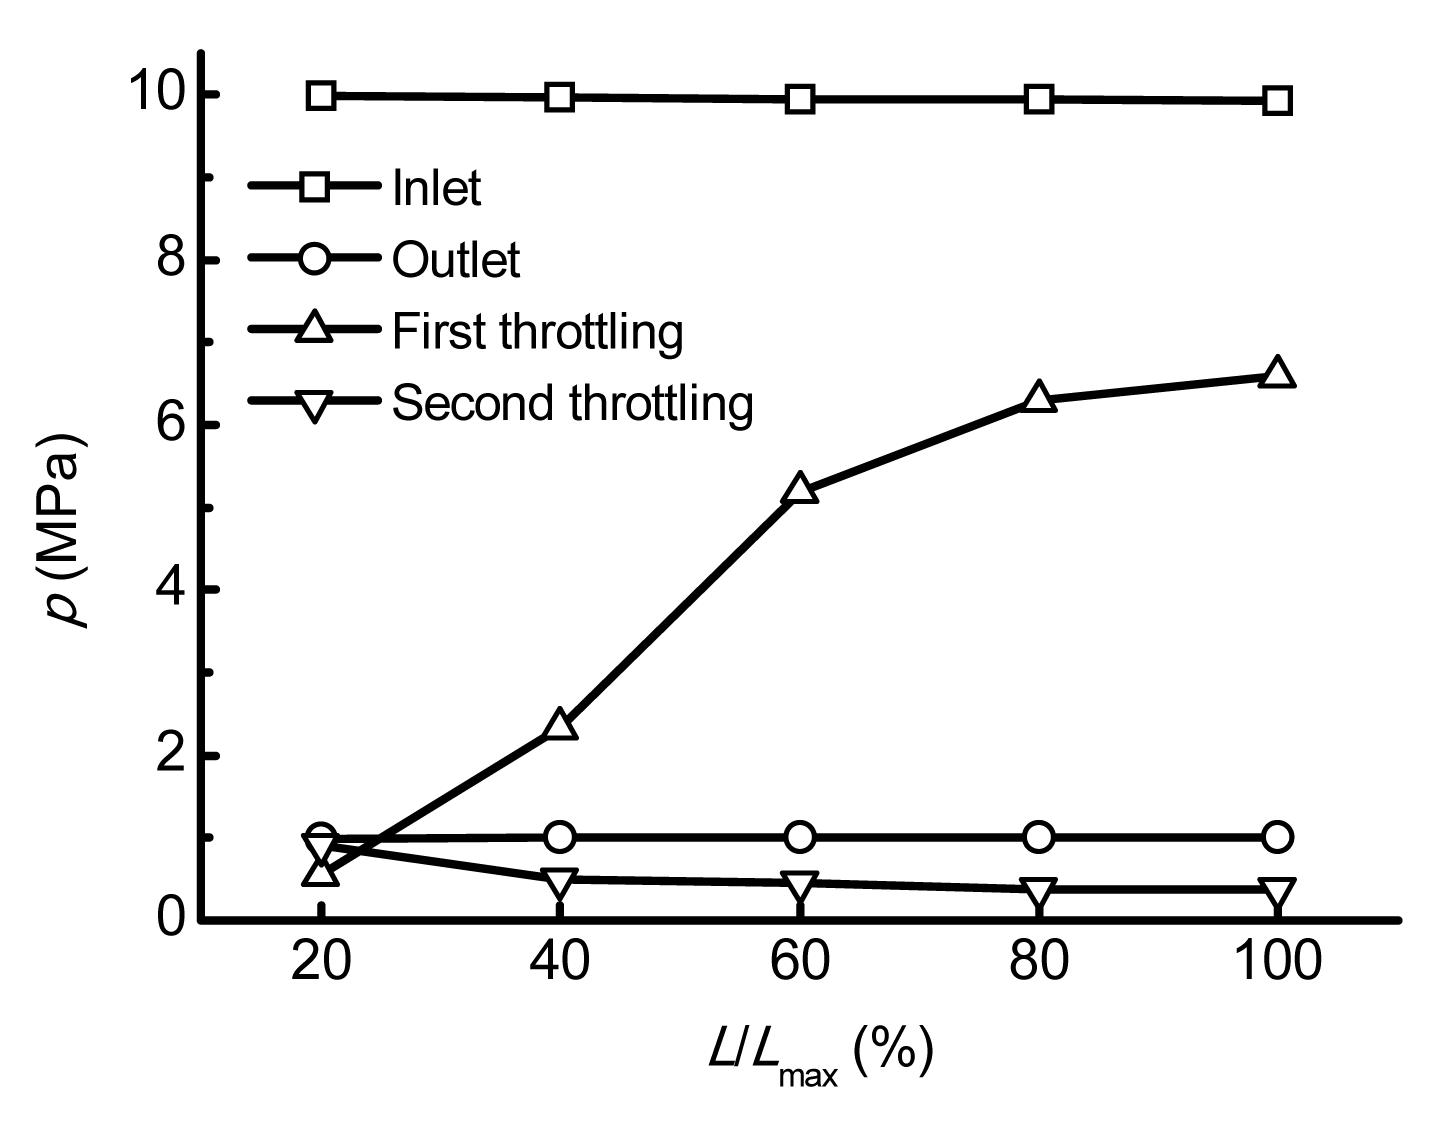
The steam pressure changes along the z direction (Fig. 7), decreasing in two stages. The orifice plate and the valve plug work together to transfer pressure potential energy to kinetic energy. In the process of pressure reduction, a supersonic flow appears in the throttling parts. Because the supersonic flow pressure is extrapolated from the flow in the interior, instead of being specified by the set value, the outlet pressure shows only a small deviation. Fig. 8 shows that as the valve opening increases, pressure after the first throttling rises and pressure after the second throttling falls. The results indicate that the effect of the valve plug on throttling has weakened, but the effect of the orifice plate has been enhanced. When the opening is larger than 60%, the orifice plate takes a leading role in reducing the pressure.
Fig.7 Pressure variation along the z direction
Fig.8 Pressure variation along the valve opening
4.3. Effects of throttling structures on velocity and structure improvement
In the PRV, velocity changes with the variation in the flow area, and thus the steam pressure is regulated. Therefore, the analysis of steam velocity is important. The simulation results are shown in Figs. 9 and 10.
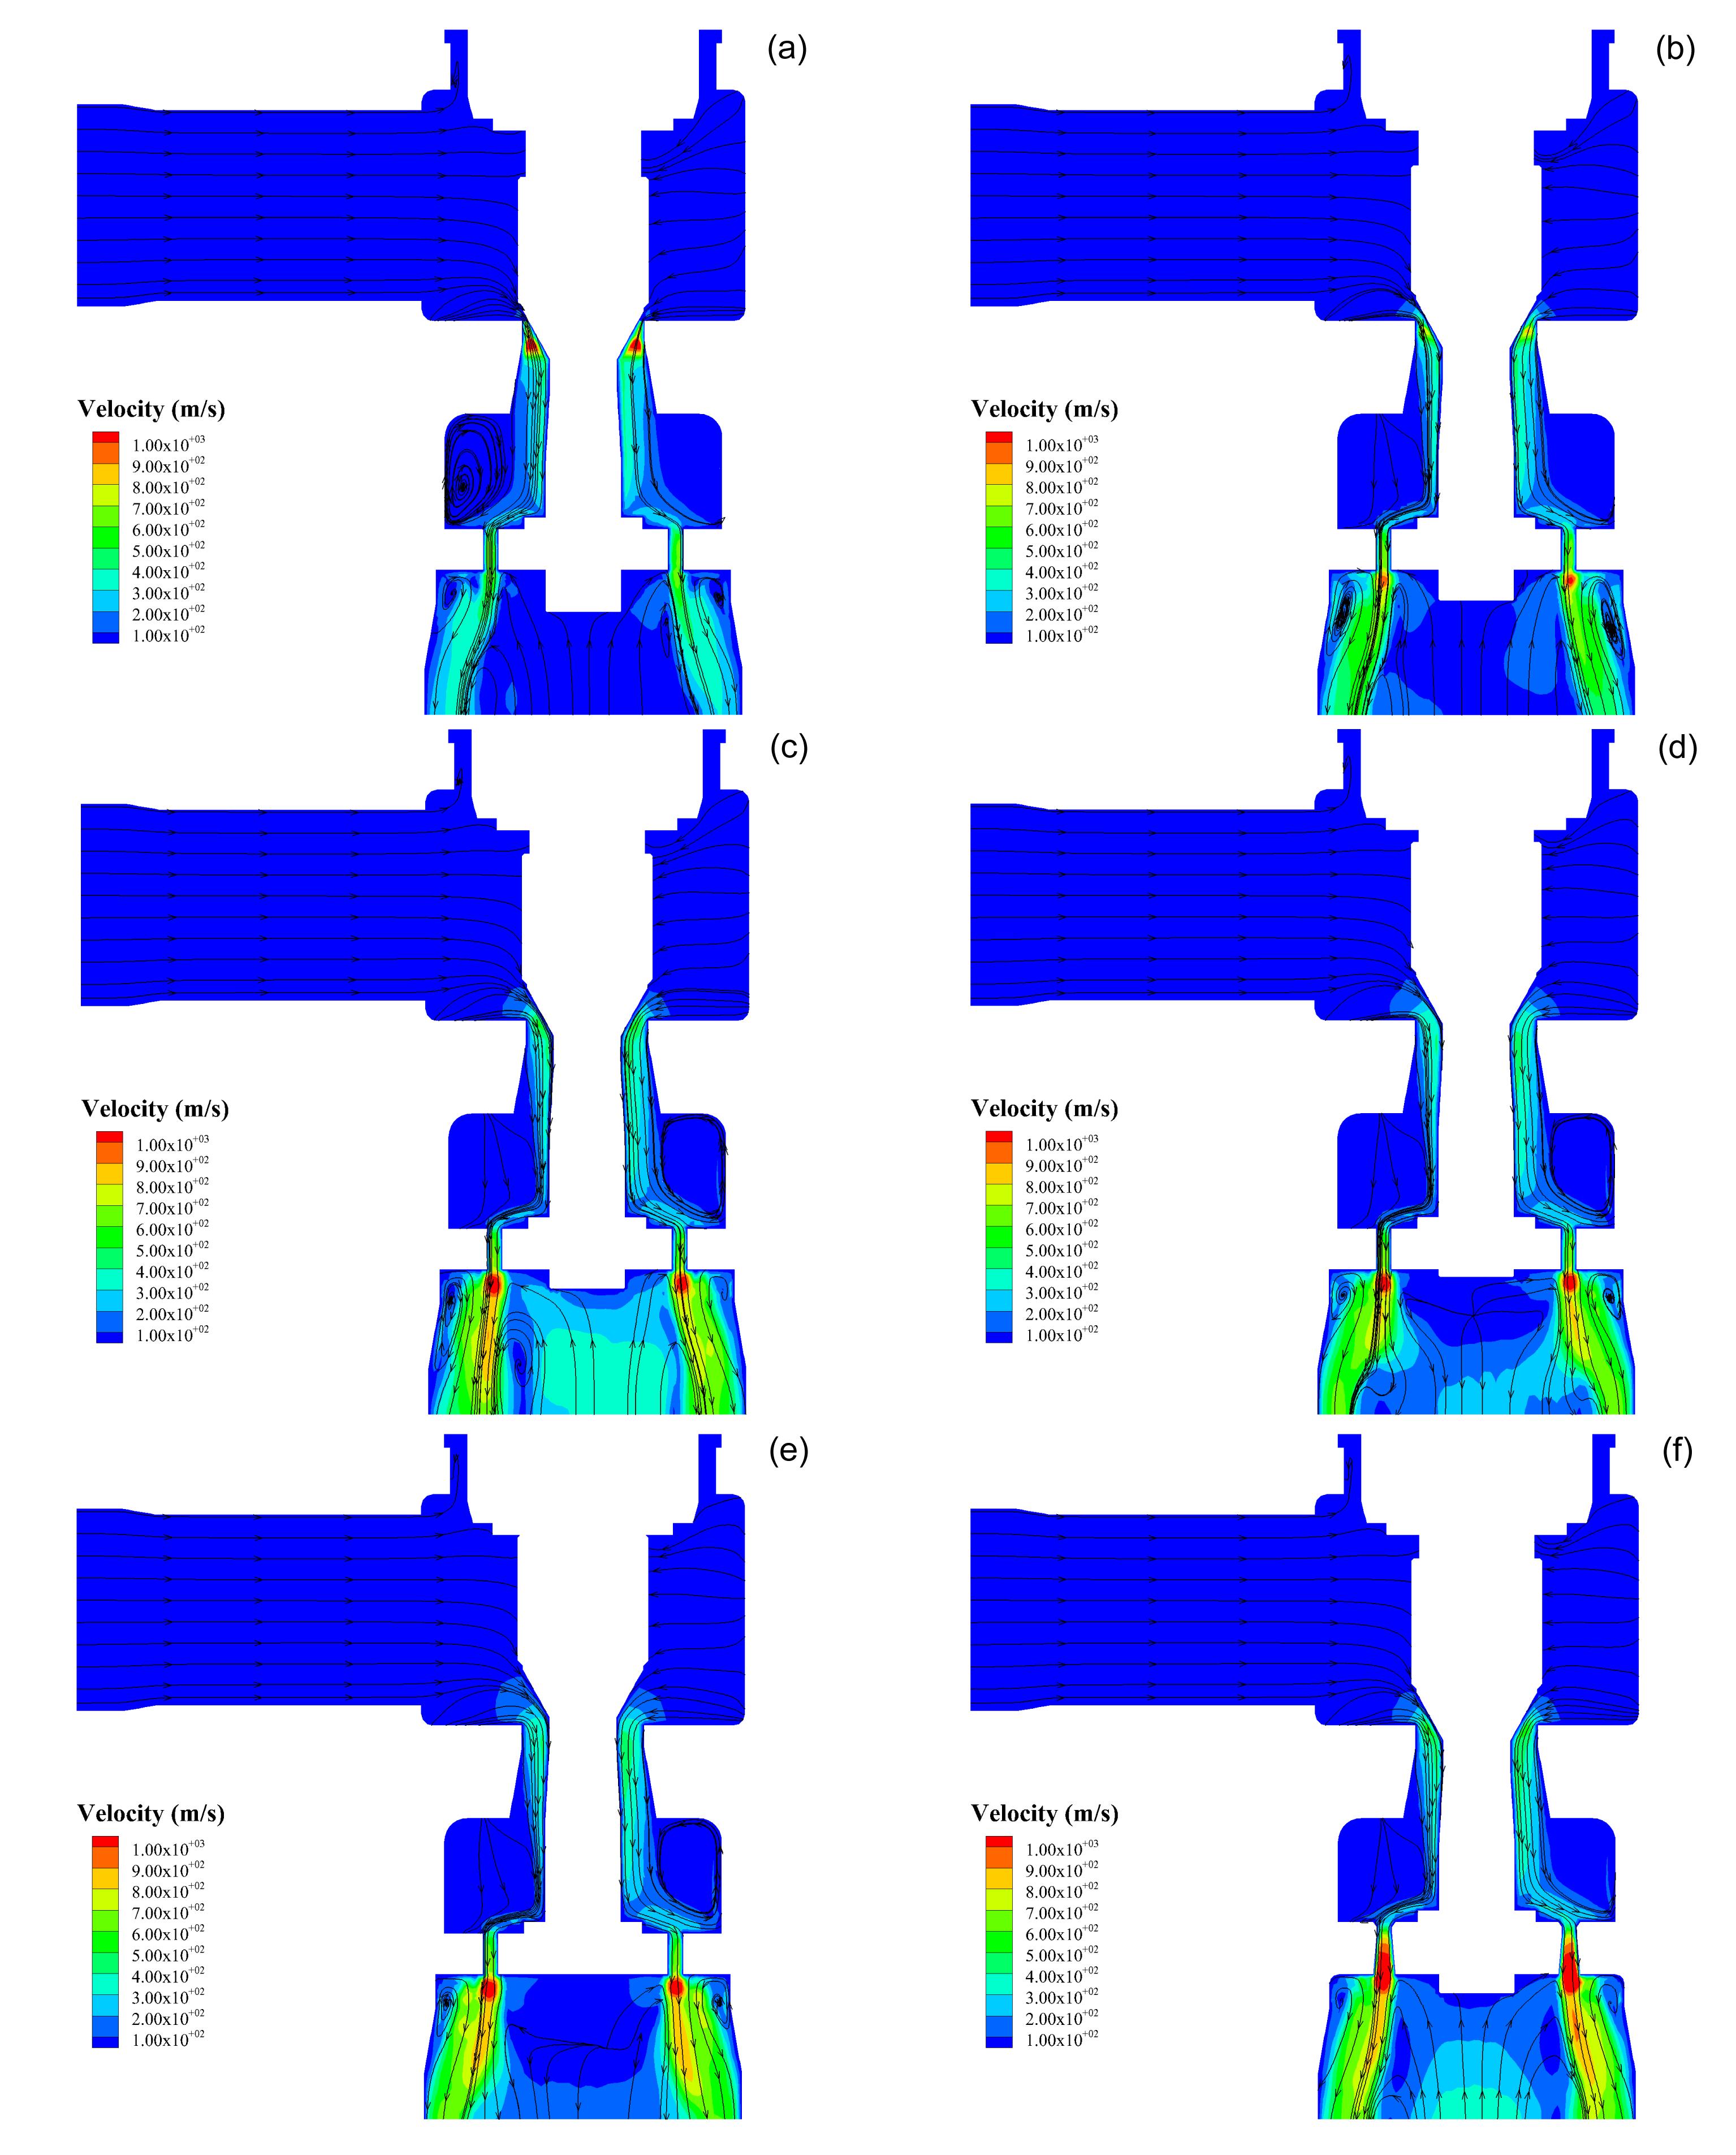
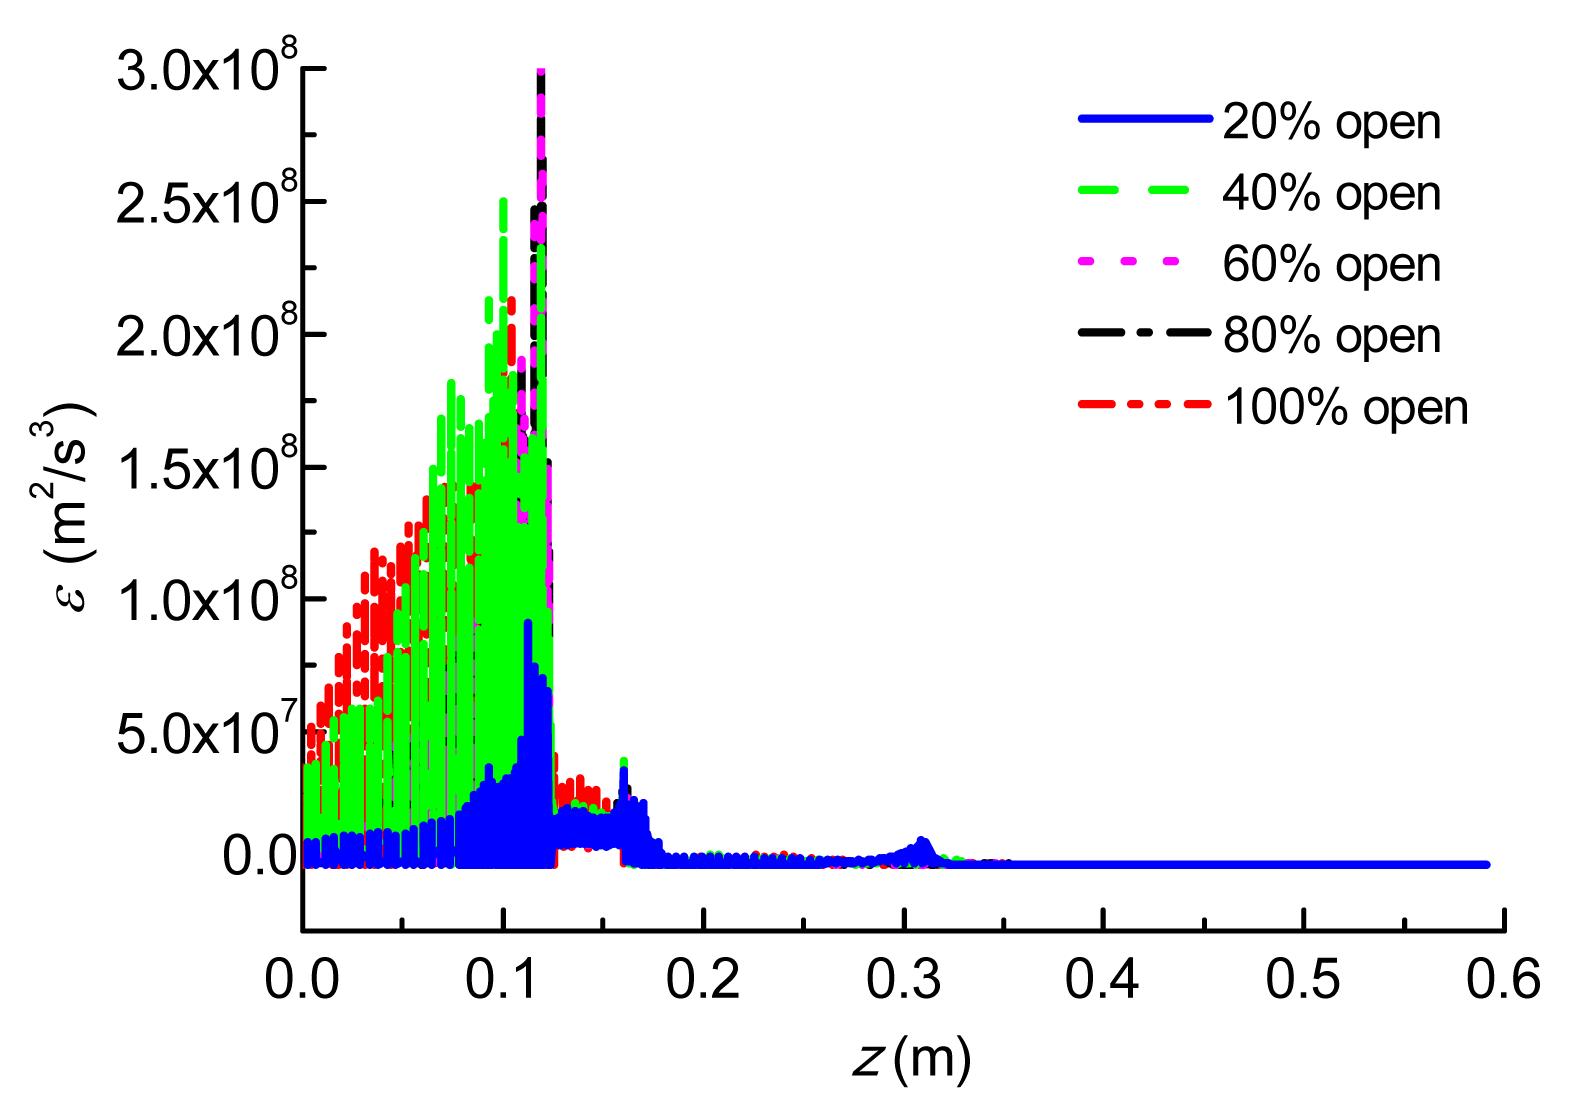
Fig. 9 compares the numerical flow rate data of different valve openings. Coincident with the change in the pressure gradient, the point of maximum velocity moves from the valve plug to the orifice plate with the rise of the valve plug. Near the throttling structures, the turbulent intensity is higher and velocity is faster. The positions of the maximum velocity point and the lowest pressure point coincide. The streamlines indicate that some eddies always exist in the cavity after the valve plug and the outlet cavity. Those eddies would dissipate most of the kinetic energy, and produce a backflow area which would block the flow and reduce the flow area. Fig. 10 indicates the variation in the steam turbulent dissipation rate ε along the z direction. The value of ε represents the dissipation of turbulent pulsation kinetic energy. The greater the value of ε, the smaller are the turbulent pulse length and time scale, the more severe is the turbulent intensity, and the more energy is dissipated. The results demonstrate that turbulent intensity is high at the orifice plate and much kinetic energy is consumed. Also, as the valve opening increases, energy dissipation increases. This phenomenon was also found by Palau-Salvador et al. (2008) in a control valve. The flow field contained several vortexes and a wall jet that hit the piston with high velocity. Vibrations and strong forces on the piston were then produced. To reduce vibrations and forces, they modified the geometry of the piston in the control valve.
Fig.9 Contours of velocity for different valve openings (a) 20% open; (b) 40% open; (c) 60% open; (d) 80% open; (e) 100% open; (f) 60% open improved
Fig.10 Turbulent dissipation rate variation along the z direction
Based on the principles of fluid mechanics, when fluid passes through place such as the orifice plate where section suddenly narrows or expands, the flow direction changes and mechanical energy reduces. To solve this problem, we have improved the structure of the orifice plate: a cross section of gradual change is used instead of a section of sudden change, and the height of the orifice plate is increased.
Taking the 60% opening as an example, the improved streamline is shown in Fig. 9f. Eddies in the cavity after valve plug are reduced significantly but there are still little eddies in the outlet cavity. Fig. 11 compares the turbulent dissipation rate of the improved flow and of the original flow. At the outlet cavity, turbulent dissipation is markedly reduced, but around the orifice plate the reduction is less obvious and needs further improvement.
Fig.11 Comparison of turbulent dissipation rate of the improved flow and the original flow
4.4. Effects of throttling on temperature
The steam pressure is reduced after throttling, at the same time as the volume expands. The steam temperature drops rapidly, which may lead to steam condensation in the PRV. So analysis of steam temperature is necessary.
Fig. 12 compares the steam temperature in the PRV with the saturated temperature corresponding to the steam pressure. The difference between the two curves represents the degree of superheating. The degree of superheating at the outlet is larger than that at the inlet. The results indicate that the steam is overheated, so the condensation phenomenon does not occur in the PRV. Near the orifice plate the degree of superheating declines sharply. In this study, the inlet degree of superheating is rather large. However, if the degree of superheating at the inlet is relatively small, condensation may appear in the valve.
Fig.12 Comparison of steam temperature for a 60% opening
In the throttling components, the steam pressure decreases and density increases so, according to Eq. (9), the range of the temperature decrease is larger than that of the pressure decrease, and thus is larger than that of the saturated steam temperature decrease. The degree of superheating then decreases at the throttling components, especially at the orifice plate. Because the whole process is regarded as isentropical, the outlet temperature is almost equal to the inlet temperature, while the outlet pressure is less than the inlet pressure, so the degree of superheating increases overall.
Because the superheated steam has to cool to saturated temperature before it releases evaporation enthalpy, the heat quantity of cooling to saturated temperature is small compared with the evaporation enthalpy of the saturated steam. Although superheated steam is convenient for transportation in a pipeline, it is rarely used in industrial processes of heat transfer. In practical applications, a temperature reducing device is usually arranged after the PRV.
. 5 Conclusions
This study presents a numerical investigation of the fluid dynamic behavior of a high parameter pressure reducing valve, including a full description of the geometric features of the orifice plate and of the effects on the fluid flow field and on the variation in temperature.
With a high pressure ratio, choked flow occurs in the valve and steam flow is transonic.
The execution element valve plug and orifice plate could work together to play a throttling role and reduce steam pressure. When the opening is large, the effect of the orifice plate on throttling is more significant.
A mass of eddies exists in the cavity after the valve plug and the outlet cavity. The flow channel is blocked and part of the mechanical energy is consumed by those eddies. Especially at the perforated plate, the turbulent dissipation rate is relatively high.
By gradually changing the section and increasing the height of the orifice plate, the consumption of mechanical energy is reduced. To further improve the flow state, the size and number of the orifices could also be changed.
The internal steam is in a state of overheating and does not condense. But if the degree of superheating at the inlet is relatively small, condensation may appear in the valve. After the throttling process, the degree of superheating of the steam increases.
[1] Amini, A., Owen, I., 1995. A practical solution to the problem of noise and vibration in a pressure-reducing valve. Experimental Thermal and Fluid Science, 10(1):136-141.
[2] Amirante, R., Del Vescovo, G., Lippolis, A., 2006. Flow forces analysis of an open center hydraulic directional control valve sliding spool. Energy Conversion Management, 47(1):114-131.
[3] Amirante, R., Del Vescovo, G., Lippolis, A., 2006. Evaluation of the flow forces on an open centre directional control valve by means of a computational fluid dynamic analysis. Energy Conversion Management, 47(13-14):1748-1760.
[4] Amirante, R., Moscatelli, P.G., Catalano, L.A., 2007. Evaluation of the flow forces on a direct (single stage) proportional valve by means of a computational fluid dynamic analysis. Energy Conversion Management, 48(3):942-953.
[5] An, Y.J., Kim, B.J., Shin, B.R., 2010. Numerical analysis of 3-D flow through LNG marine control valves for their advanced design. Journal of Mechanical Science and Technology, 22(10):1998-2005.
[6] Beune, A., Kuerten, J.G.M., Schmidt, J., 2011. Numerical calculation and experimental validation of safety valve flows at pressures up to 600 bar. AIChE Journal, 57(1):3285-3298.
[7] Casoli, P., Vacca, A., Berta, G.L., 2010. A numerical procedure for predicting the performance of high pressure homogenizing valves. Simulation Modelling Practice and Theory, 18(2):125-138.
[8] Chattopadhyay, H., Kundu, A., Saha, B.K., Gangopadhyay, T., 2012. Analysis of flow structure inside a spool type pressure regulating valve. Energy Conversion and Management, 53(1):196-204.
[9] Chen, P.L., Yu, X.L., Liu, L., 2009. Simulation and experimental study of electro-pneumatic valve used in air-powered engine. Journal of Zhejiang University-SCIENCE A, 10(3):377-383.
[10] Cho, T.D., Yang, S.M., Lee, H.Y., Ko, S.H., 2007. A study on the force balance of an unbalanced globe. Journal of Mechanical Science and Technology, 21(5):814-820.
[11] Fester, V.G., Kazadi, D.M., Mbiya, B.M., Slatter, P.T., 2007. Loss coefficients for flow of newtonian and non-newtonian fluids through diaphragm valves. Chemical Engineering Research and Design, 85(9):1314-1324.
[12] Gao, H., Fu, X., Yang, H.Y., Tsukiji, T., 2002. Numerical investigation of cavitating flow behind the cone of a poppet valve in water hydraulic system. Journal of Zhejiang University-SCIENCE A, 3(4):395-400.
[13] Kerh, T., Lee, J.J., Wellford, L.C., 1997. Transient fluid-structure interaction in a control valve. Journal of Fluids Engineering, 199(2):354-359.
[14] Kim, S.W., Kim, J.H., Choi, Y.D., 2007. Flow Characteristics of Butterfly Valve by PIV and CFD. , Proceedings of the Fifth International Conference on Fluid Mechanics, Shanghai, China, 463-466. :463-466.
[15] Mokhtanadeh-Dehghan, M.R., Ladommatos, N., Brennan, T.J., 1997. Finite element analysis of flow in a hydraulic pressure valve. Applied Mathematical Modelling, 21(7):437-445.
[16] Palau-Salvador, G., Gonzalez-Altozano, P., Arviza-Valverde, J., 2008. Three-dimensional modeling and geometrical influence on the hydraulic performance of a control valve. Journal of Fluids Engineering, 13001):011102
[17] Prescott, S.L., Ulanicki, B., 2003. Dynamic modeling of pressure reducing valves. Journal of Hydraulic Engineering, 129(10):804-812.
[18] Shin, C.H., Ha, J.M., Lee, C.G., 2008. Transient pressure characteristics in a pressure regulating system by using 1-D analytic valve modeling. Journal of Mechanical Science and Technology, 22(2):374-381.
[19] Xu, H., Guang, Z.M., Qi, Y.Y., 2011. Hydrodynamic characterization and optimization of Contra-push check valve by numerical simulation. Annals of Nuclear Energy, 38(6):1427-1437.
[20] Yang, Q., Zhang, Z., Liu, M., Hu, J., 2011. Numerical simulation of fluid flow inside the valve. Procedia Engineering, 23:543-550.
Open peer comments: Debate/Discuss/Question/Opinion


Open peer comments: Debate/Discuss/Question/Opinion
<1>