Zhao-dong Xu, Chen-hui Weng. Track-position and vibration control simulation for strut of the Stewart platform[J]. Journal of Zhejiang University Science A, 2013, 14(4): 281-291.
@article{title="Track-position and vibration control simulation for strut of the Stewart platform", author="Zhao-dong Xu, Chen-hui Weng", journal="Journal of Zhejiang University Science A", volume="14", number="4", pages="281-291", year="2013", publisher="Zhejiang University Press & Springer", doi="10.1631/jzus.A1200278" }
%0 Journal Article %T Track-position and vibration control simulation for strut of the Stewart platform %A Zhao-dong Xu %A Chen-hui Weng %J Journal of Zhejiang University SCIENCE A %V 14 %N 4 %P 281-291 %@ 1673-565X %D 2013 %I Zhejiang University Press & Springer %DOI 10.1631/jzus.A1200278
TY - JOUR T1 - Track-position and vibration control simulation for strut of the Stewart platform A1 - Zhao-dong Xu A1 - Chen-hui Weng J0 - Journal of Zhejiang University Science A VL - 14 IS - 4 SP - 281 EP - 291 %@ 1673-565X Y1 - 2013 PB - Zhejiang University Press & Springer ER - DOI - 10.1631/jzus.A1200278
Abstract: Vibrations inherently generated by on-board disturbance sources degrade the performance of the instruments in an on-orbit spacecraft, which have stringent accuracy requirements. The stewart platform enables both track-positioning and vibration control. The strut of the stewart platform is designed as a piezoelectric (PZT) element in series with a voice coil motor (VCM) element and a viscoelastic element. The track-positioning system uses a VCM as the main positioning control driver and a PZT as the positioning compensator. The vibration control system uses the characteristics of struts including active and passive control elements to attenuate the vibration. Simulation results indicate that the stewart platform with the designed struts has good performance in tracking and vibration attenuation with different interference waves.
Darkslateblue:Affiliate; Royal Blue:Author; Turquoise:Article
Article Content
1. Introduction
Multiple instruments hosted in a satellite use gimbals, scanning or articulating components, so specific attitude is required to obtain fine pointing, such as the space interferometer, the next generation space telescope, and the mid-wavelength infrared camera on the Space Technology Research Vehicle 2 (STRV-2). However, the existing dynamic supporting equipment brings a micro-vibration environment, which degrades the performance of satellite instruments. Developing inexpensive platforms with high performance in vibration attenuation isolation and track-positioning for space applications is therefore of primary interest. Smart structures with vibration isolation and attenuation systems for space launch and on-orbit applications were used (Sullivan et al., 2000). Specifically, the Stewart platform, which was proposed as a simulator of the flight conditions for safe training of helicopter pilots (Stewart, 1965), has been receiving much attention. A series of experiments has been carried out using different types of struts to validate the feasibility of the Stewart platform in space. For instance, an experiment about space-borne optical interferometers has made much improvement in vibration control by setting up a fringe tracker control system as a feed forward through dynamically measuring the displacement error. Neat et al. (1998) used piezoelectric (PZT) and a voice coil motor (VCM) in parallel to significantly attenuate the vibration. Then, the Satellite Ultraquiet Isolation Technology Experiment (SUITE) was carried out in succession for the PicoSAT spacecraft to show that small vibrations of a spacecraft instrument can be reduced significantly, in which the strut was based on PZT and VCM (Anderson et al., 2000). As far as the track-positioning controller is concerned, the conventional control method for VCM and PZT is the proportional-integral-derivative (PID) algorithm. Considering the coupling motion of VCM and PZT, however, it is a tricky problem that researchers have been making efforts to explore a simple way to address this issue. Besides, an algorithm was proposed in which the independent components of link lengths are used as a medium to analyze the forward kinematics of a Stewart platform with six degrees-of-freedom (DoFs). Experimental results showed that the proposed algorithm achieves better performance than the algorithms in the literature (Wang et al., 2011). Many methods that use decoupled or sequential single input single output (SISO) classical frequency shaping design techniques have been proposed, including the master-slave method, power quality method, and parallel design method. Li and Horowitz (2002) discussed two track-following controller designs for a dual-stage servo system and verified their performance by tests. To achieve high stability, Huang et al. (2005) proposed a dual-stage servo system with vibration control, and demonstrated its superiority to the conventional dual-stage servo system. Mukherjee et al. (2007) proposed a dynamic stability index of the Stewart platform and validated its performance through the response subjected to base excitations at different frequencies. Fraguela et al. (2012) applied output integral sliding mode control to a perturbed Stewart platform and considerably improved the stabilization of the desired position of the platform, even with small errors. Zhang et al. (2011) conducted an experiment of a real-time Linux based controller for active vibration isolation of a Stewart platform and showed that disturbances from the base can be attenuated by more than 75%. Mura (2012) converted a Stewart platform into a 6-DoF micro-electro-mechanical system (MEMS) sensor to measure displacement. The measurements were conducted by the optical sensors, and the absolute positions and orientations of the platform were estimated using a dedicated algorithm. Grewal et al. (2012) adopted a linear quadratic Gaussian (LQG) controller in the practical application of the Stewart platform for vibration control with reference tracking.
In this paper, we introduce integration technology to the Stewart platform, of which the strut is an integrated system that enables track-positioning and vibration attenuation. The primary objective of this research is to design a track-positioning controller to obtain fine pointing during mission and evaluate the vibration control system under the expected disturbance source of the reaction wheel. The decoupled systems of VCM and PZT are described to design the PID controller respectively, together with the responses of tracking simulation, the predominant disturbance and its simulation process, a specific vibration control strategy and its dynamic equation, and the prediction of the strut performance using the strategy implemented by a linear quadratic regulator (LQR) algorithm.
2. Track-position control for strut of the Stewart platform
2.1. Strut assembly
The Stewart platform contains six identical struts. In this paper, to allow SISO control, the Stewart platform has been designed to decouple the action of each strut from the others, when the angle between two struts is 90°. In this case, a motion sensor and an actuator can change only their lengths within each strut. Also, each strut is designed to be a single-axis member; that is, loads are transmitted along the axis of the strut but not in the other five axes.
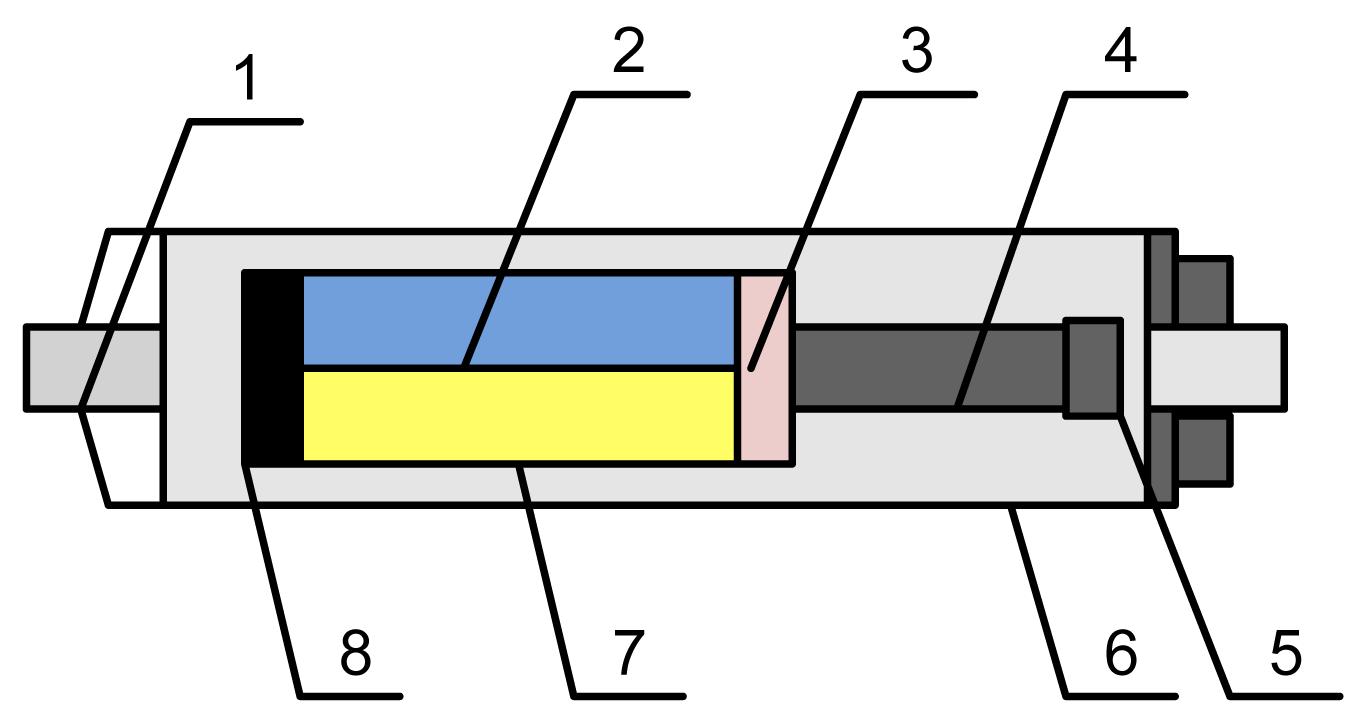
Fig. 1 shows the specific architecture of the strut. Each strut is a series of active and passive elements. From the top of the strut assembly, below the top hinge, a preload system ensures that the piezoceramic device remains in compression throughout its lifetime. The piezoelectric actuator is next in the strut stack, driving the macro-positioning stage. This is followed by the voice coil stage of the strut, driving the micro-positioning stage. The motion sensor makes up half of the volume of the strut. The bottom of the strut uses a viscoelastic material for passive isolation and the end hinge. It is extremely beneficial that the direct drive characteristic of the VCM can provide high acceleration to maintain the position, and the PZT actuator can compensate for the error to achieve accurate position.
Fig.1 Single strut architecture of the Stewart platform 1: end hinge; 2: capacitance micrometer; 3: voice coil; 4: piezoelectric stacks; 5: setup spring; 6: magnetic shielding; 7: grating scale; 8: viscous-elastic damper
2.2. Control decoupling analysis
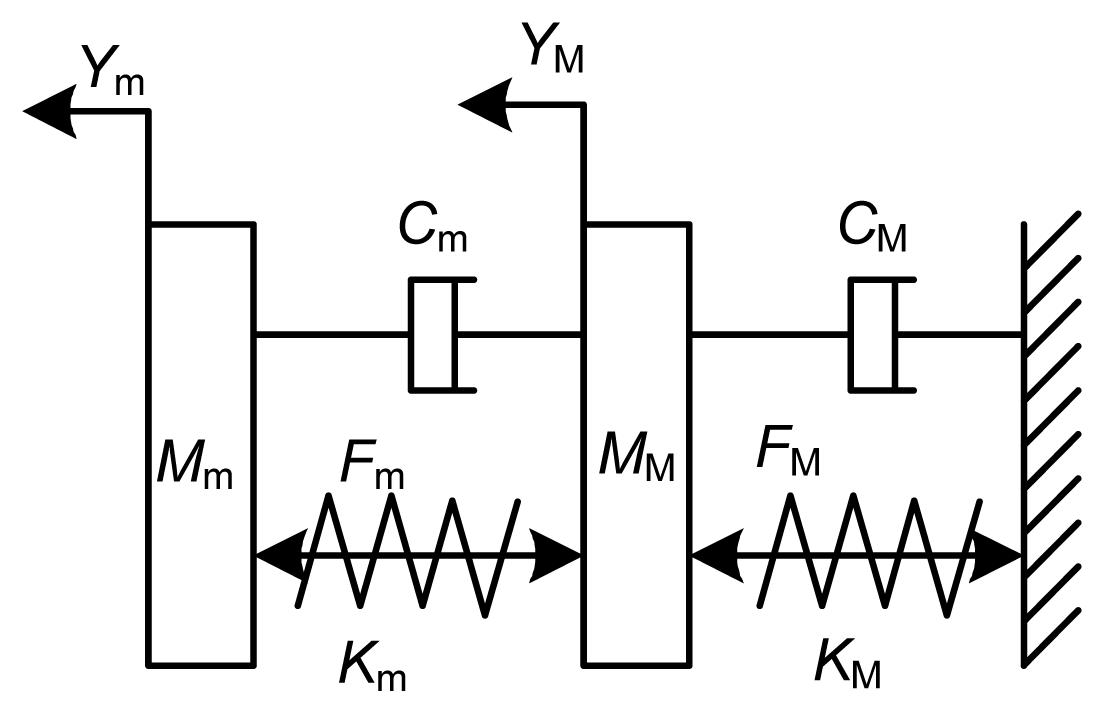
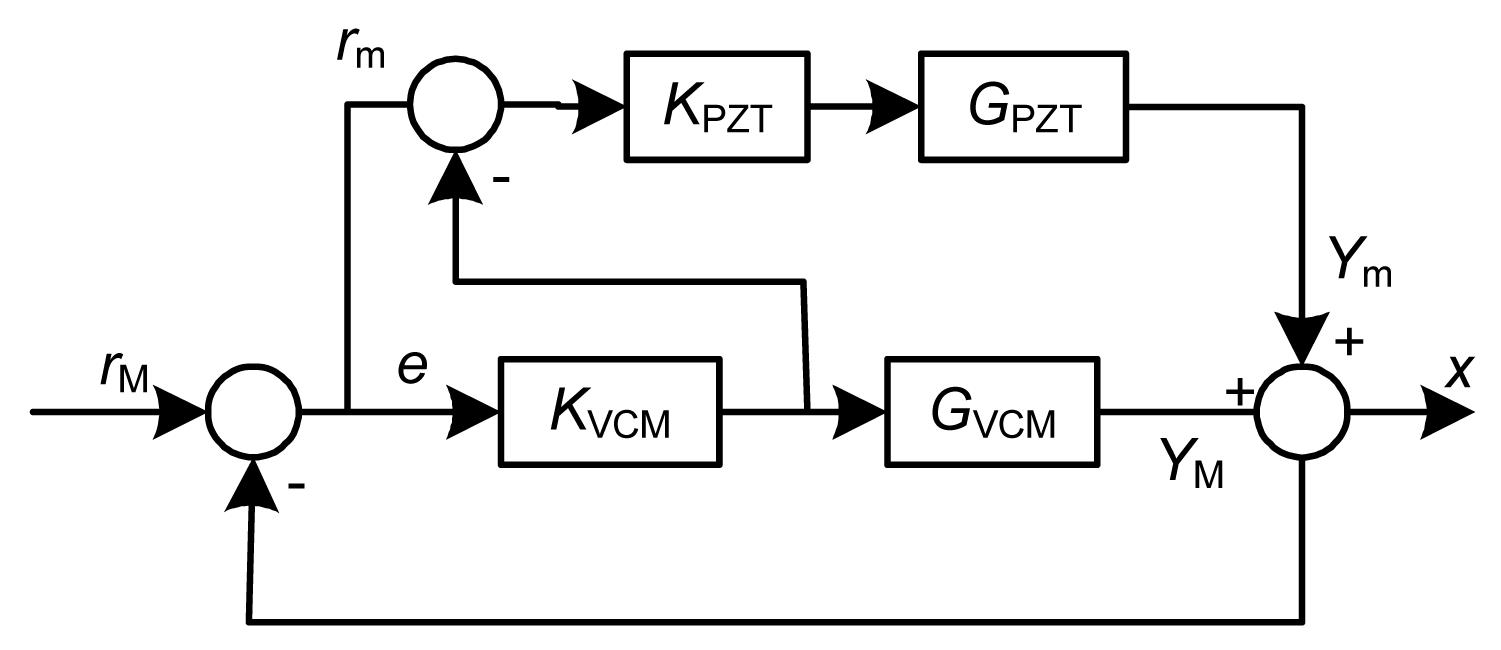
The active stage plays a crucial role in track-position control. This section focuses on its working behavior. The track-position controller has two stages: VCM driving macro-position and PZT driving micro-position. It can be simplified to a mass-damping system (Fig. 2). Mm, Km, Cm, and Fm are the equivalent mass, stiffness, damper, and force of PZT, respectively; MM, KM, CM, and FM are the equivalent mass, stiffness, damper, and force of VCM, respectively. As the micro-position stage is situated on the macro-position stage, there will clearly be force acting on the micro-position stage when the macro-position actuator is moving, and vice versa. Liu et al. (2009) analyzed the motion coupling characteristics and found that the system can be decoupled when the stiffness of micro-position is far more than the damping of macro-position. Therefore, the controller is designed to treat the macro-micro system as two separate positioning stages. Fig. 3 shows a block diagram for the dual-stage controller design using the SISO method. GVCM and GPZT are the VCM and PZT model transfer functions, respectively; KVCM and KPZT are the VCM and PZT loop controllers, respectively; rM represents the motion of the head relative to the data track and rm represents the motion of the PZT relative to the VCM. The open-loop transfer function from r to x in Fig. 3 (without the feedback loop being closed) is
.
An expression is given further:
.
Thus, the closed-loop sensitivity transfer function is
.
Fig.2 Dynamic model of the active part of the strut Mm, Km, Cm, and Fm are the equivalent mass, stiffness, damper, and force of PZT, respectively; MM, KM, CM, and FM are the equivalent mass, stiffness, damper, and force of VCM, respectively
Fig.3 Block diagram of a dual-stage controller design GVCM and GPZT are the VCM and PZT model transfer functions, respectively; KVCM and KPZT are the VCM and PZT loop controllers, respectively; rM represents the motion of the head relative to the data track and rm represents the motion of the PZT relative to the VCM
The total closed-loop transfer function of the macro-micro system is the product of the VCM and PZT closed loop. Thus, the dual-stage control system design can be decoupled into two independent controller designs: the VCM closed loop and the PZT closed loop. The VCM closed-loop controller can be designed using a PID controller with an LQG filter to restrain the vibration caused by the linearity friction of VCM. The PZT closed-loop controller is designed to provide additional error rejection as the feedback system using a PID controller.
2.3. Macro-position stage of strut
2.3.1. Model of the macro-position stage
Based on Kirchhoff’s law, an electrical equivalent model of the VCM can be expressed by the voltage balance equation:
,
where U is the voltage across the coil, is the induction voltage, UB=KBv is the electromotive force due to the motion of the coil, and UR=Ri is the resistance voltage, while i is the circuit current, ν is the speed of movement, and KB is the back electromotive force constant.
In addition, the effect of linearity friction is considered and treated as system damping, and the model of friction force is written as
,
where B is the coefficient of friction.
Then, the force balance equation is
,
where , KF is the force sensitivity of the VCM. From Eq. (5), .
According to Eqs. (4)–(6), the transfer function of the macro-position stage is
,
where M=MM+Mm is the sum of masses at the macro-position stage and micro-position stage.
The LQG filter is used as feedback to restrain the vibration. The state space model of the transfer function GLM is given as
where, and the state vector .
2.3.2. Simulation of the macro-position stage
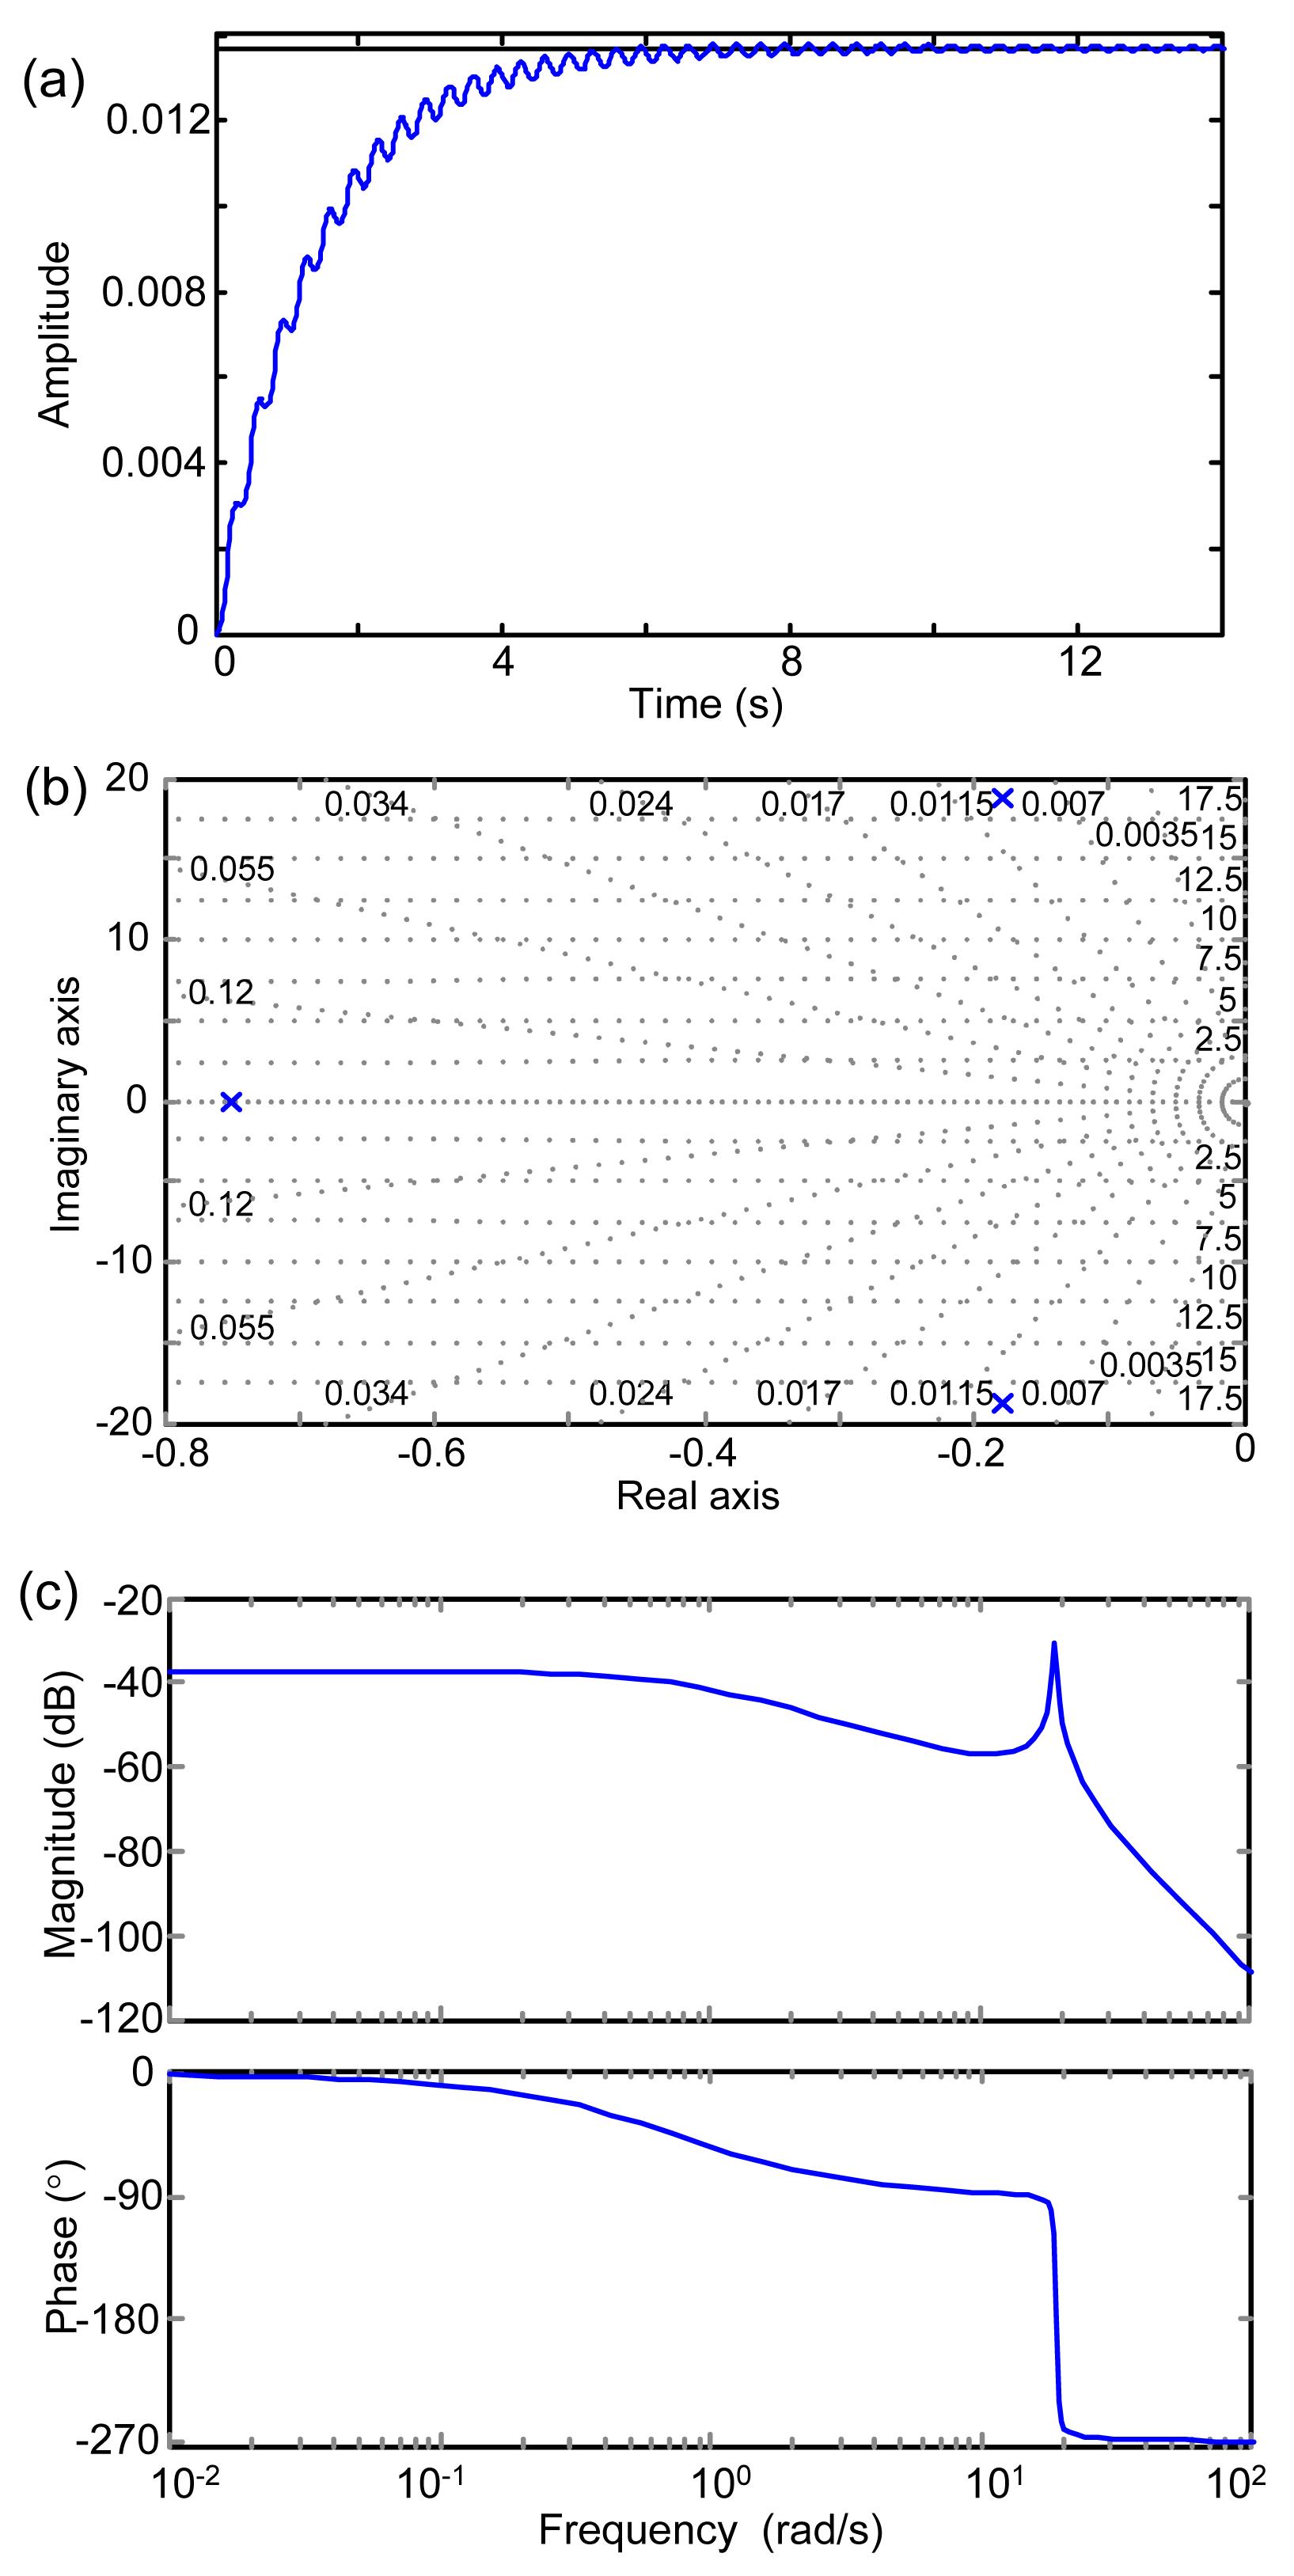
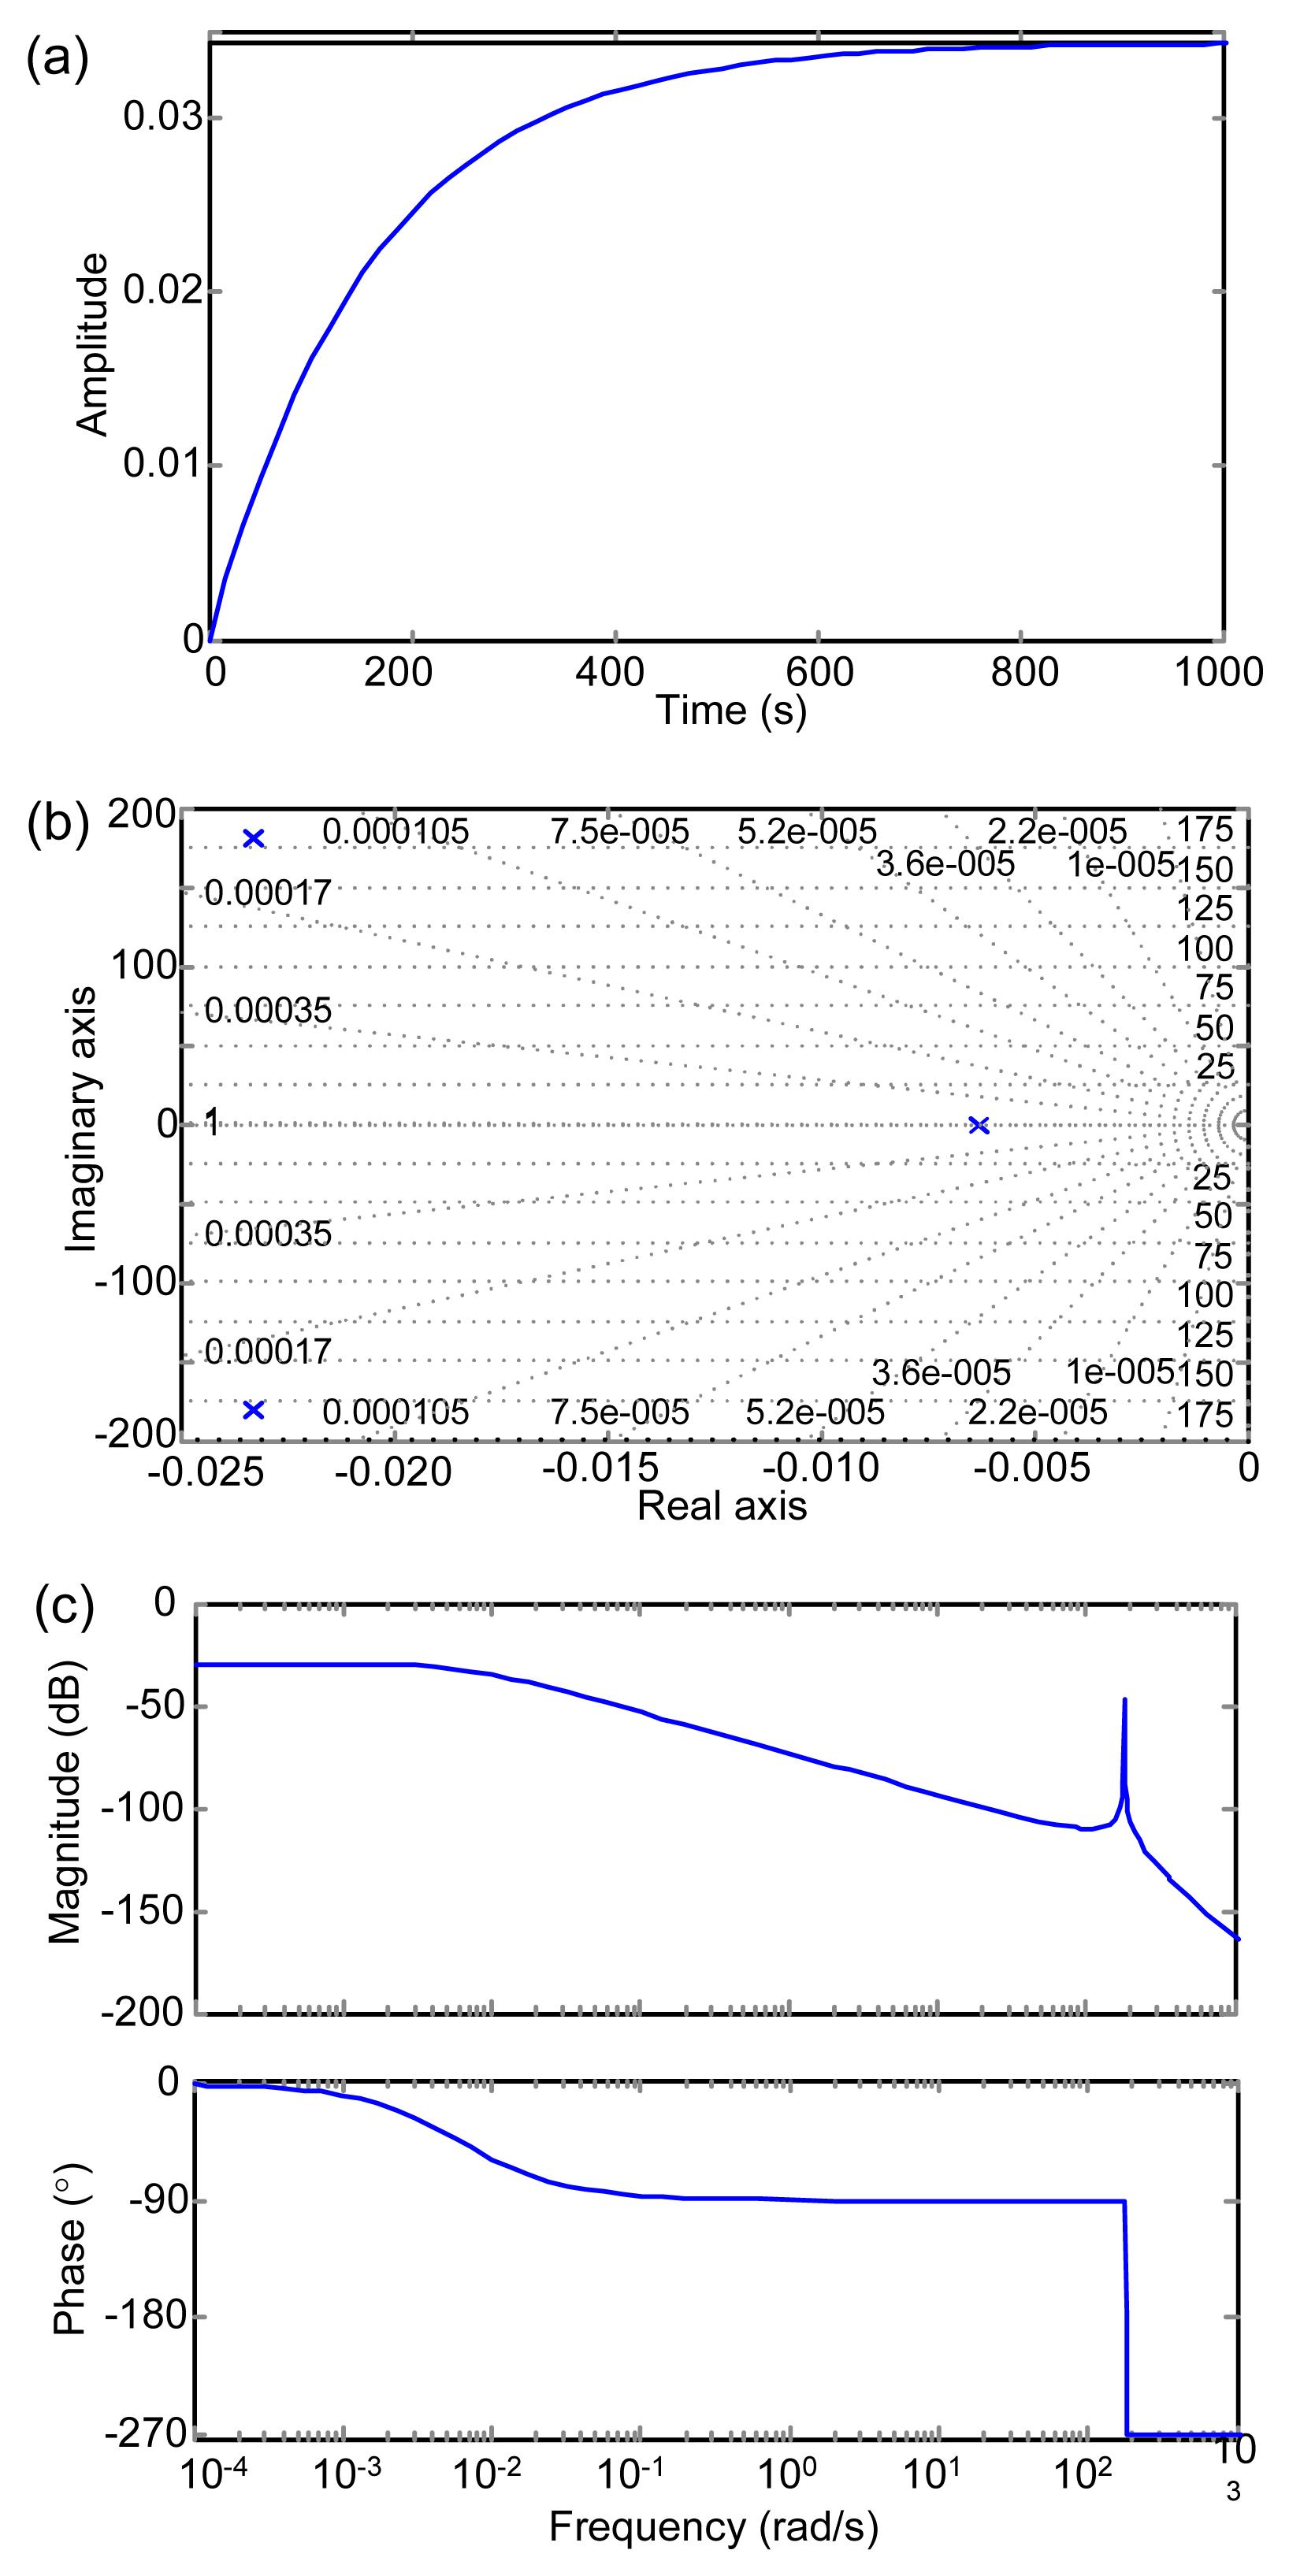
Time domain analysis, frequency domain analysis, root locus analysis, and state space analysis should be executed in advance to show the controllability, stability, and observability of a linear system. Fig. 4 shows the step response of the system, result of root locus analysis, and bode image of frequency domain analysis. The step response is plotted with zero overshoot and short rise time (Fig. 4a), which explains why the VCM system has a quick response and less overshoot. Serious vibration exists during movement, which leads to inconsistency between the certain degree of flexibility of the component and the assumption. A controller with an LQG filter is designed to attenuate the lingering vibration. Fig. 4b shows that three poles are distributed in the left complex plane, which confirms the stability of the system with a convergence solution. Fig. 4c shows that the amplification has a sharp rise across a certain frequency, which is the so-called resonance.
Fig.4 Linear analysis of the VCM system: (a) step response; (b) pole-zero map; (c) bode diagram
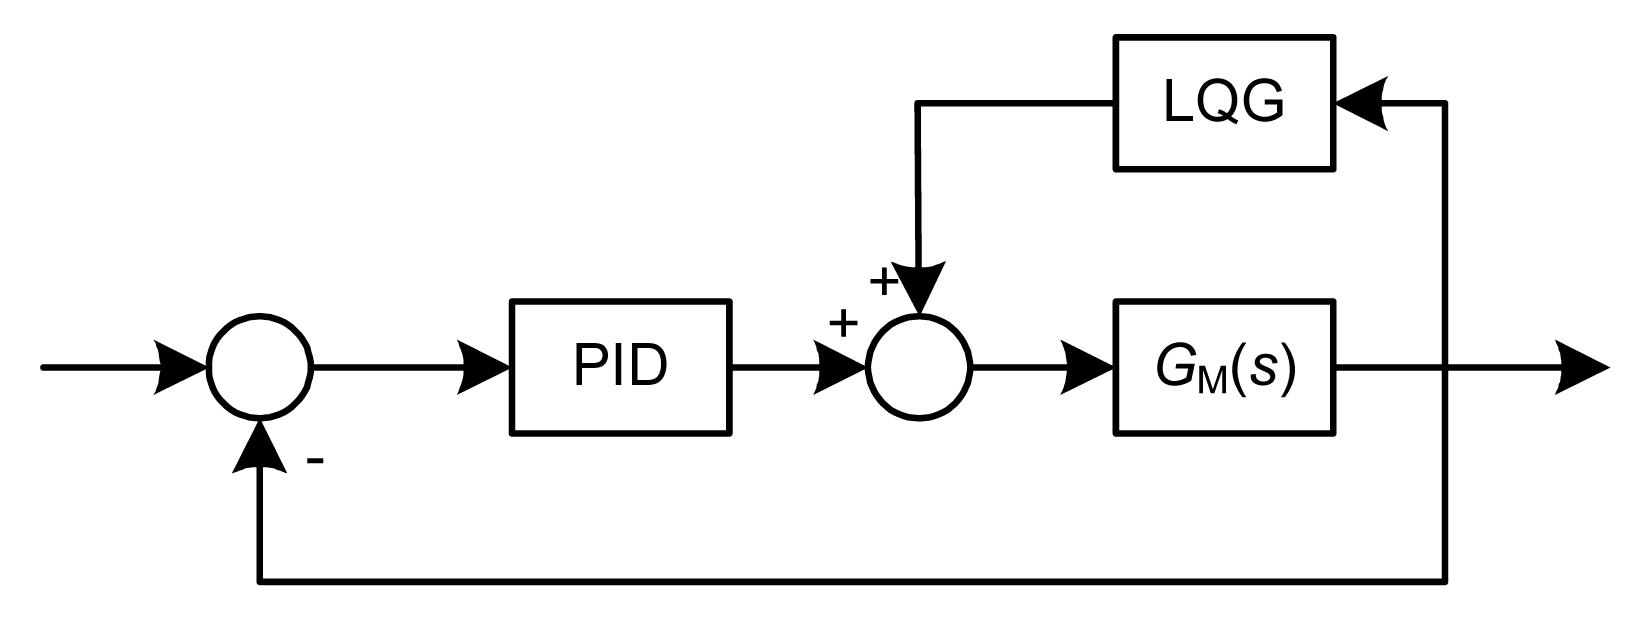
Fig. 5 shows a block diagram of the controller for VCM.
Fig.5 Block diagram of the controller for the VCM
The method used for controlling the macro-position stage is increasing PID, of which the parameters of proportional plus integral plus derivative are tuned by experience (Li et al., 2006). The cost function for LQ design in the LQG filter is
,
where uLQG is the calculated optimal control force.
The covariance of disturbance in the stage equation and measured noise in the observation equation for the Kalman filter model are 100 and 10−4, respectively.
Then, the macro-position stage is simulated in MATLAB/SIMULINK. Fig. 6 shows the response of the system with the step input under the PID plus LQG controller. The tracking signal gradually grows from zero to its peak value, then falls back to the step value, and then swings around its balance value. After about 6 s, the tracking signal and step signal reach general agreement.
Fig.6 Step response of the VCM system under PID plus LQG control
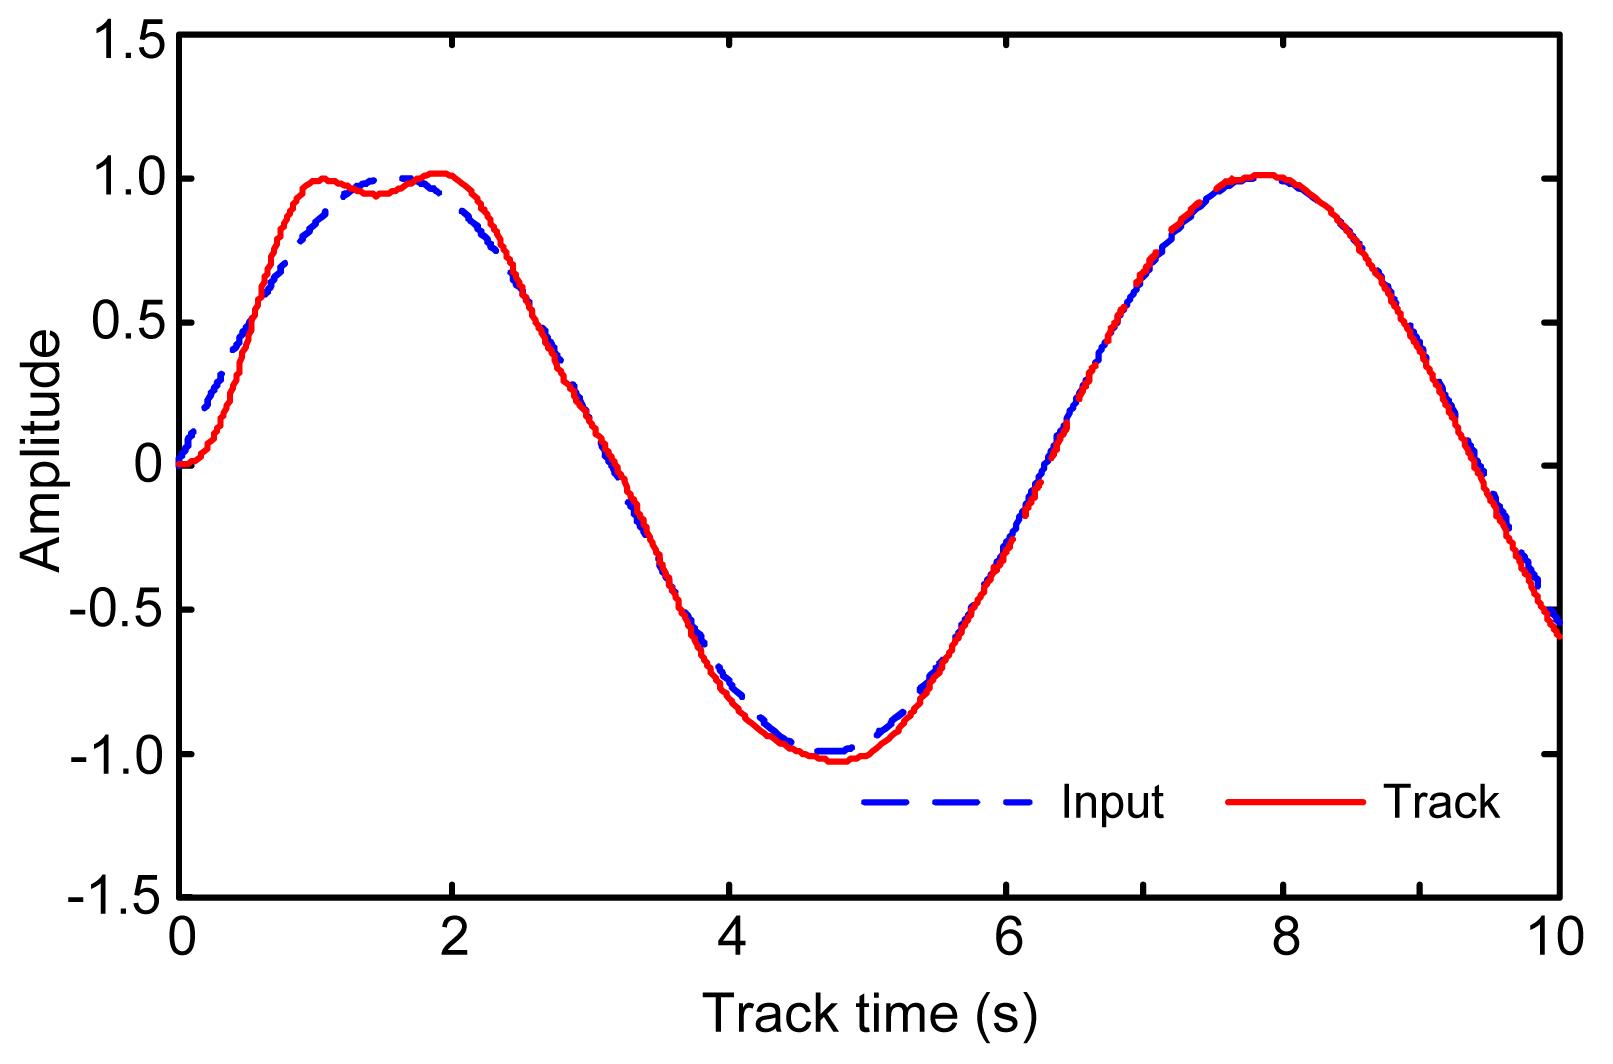
Similarly, a sinusoidal signal is adopted to test the PID plus LQG controller (Fig. 7). The tracking signal follows the input signal with small relative errors, and oscillation caused by friction occurs after about 8 s. This indicates that the macro system has tracking ability under the macro-positioning controller. Note that the vibration caused by friction still exists with small amplitude even if the LQG feedback controller is added. But the accuracy is enough for engineering applications and the error rejection of positioning will be compensated by the PZT actuator.
Fig.7 Sinusoidal response of the VCM system under PID plus LQG control
2.4. Micro-position stage of strut
2.4.1. Model of the micro-position stage
Based on Kirchhoff’s law, an electrical equivalent model of the PZT can be expressed by the electric current balance equation:
,
where , , , and Up is the voltage of the PZT. In view of linearity relationship between voltage and displacement without considering the nonlinearity characteristic of PZT,
,
where x is the displacement of PZT and a is the linearity proportionality coefficient.
The force balance equation is
,
where Kt is the stiffness of electric capacity, and K=KM+Km is the sum of macro- and micro-position stiffness.
Thus, the transfer function of the micro-position stage derived from the Laplace transformation is
.
where Kp is the proportion coefficient.
2.4.2. Simulation of the micro-position stage
The linear system of PZT is analyzed in the same way. Fig. 8 shows the step response of the system, result of root locus analysis, and bode image of frequency domain analysis. The step response is perfect with zero overshoot and long rise time (Fig. 8a), which explains why the PZT system just completes the positioning with a slower response and more precision. The root locus analysis illustrates that the system has a stable convergence solution with three poles in the left complex plane (Fig. 8b). A resonance occurs around the natural frequency and the magnitude is below 0 dB across all frequencies (Fig. 8c), which indicates that there is no amplification. Thus, the PZT system is controllable, stable, and observable.
Fig.8 Linear analysis of the PZT system: (a) step response; (b) pole-zero map; (c) bode diagram
Fig. 9 shows the block diagram of the controller for PZT. The closed loop of PZT uses the macro-positioning error as the input signal of the PID controller. Simulation is executed to justify the proportion element, integrating element, and derivative element for step response and sinusoidal response.
Fig.9 Block diagram of the controller for PZT
Fig. 10 shows the step response of the PZT system under PID control. The tracking signal grows from zero to its maximum overshoot, falls back to negative overshoot, swings around the input step signal with decreasing overshoot, and finally coincides with the input signal. Fig. 11 shows the sinusoidal response of the PZT system under PID control. The tracking signal starts from the same point as the input signal, tracks along the sinusoidal signal with small errors at the beginning, and finally matches the input signal. The above analysis shows that the micro system has good tracking ability under the PID controller.
Fig.10 Step response of the PZT system under PID control
Fig.11 Sinusoidal response of the PZT system under PID control
3. Vibration control for strut of the Stewart platform
Performance of instruments is evaluated by indices of reliability and pointing stability during the operational lifetime. Still, satellite instruments are subjected to micro-vibration environments, causing problems during on-orbit satellite operation. Much work has been done to prove that the Stewart platform can be used as a vibration isolator (Preumont et al., 2007). Zhen et al. (2011) used the Stewart platform with non-cubic configuration to address the active vibration control problem and developed a vibration control system of the strut to attenuate vibration of the Stewart platform caused by the existing micro disturbance. The following will introduce the vibration control analysis of the strut combining the simulated reaction wheel disturbance source.
3.1. Simulation of reaction wheel disturbance
To evaluate the performance of the Stewart platform, accurate disturbance is necessary for predicting the effects of vibrations. Experimental statistics show that the reaction wheel disturbance is anticipated to be the largest disturbance source, and its detailed data usually is tested by practical applications. However, the experimental data is difficult to acquire. Numerical simulation provides a better way to obtain the reaction wheel disturbance. A modified Fourier spectrum method is adopted to simulate the reaction wheel disturbance based on the power spectral density of the empirical steady-state model proposed in this paper, which provides an inexpensive way to obtain the disturbance time curve of the reaction wheel.
When the wheel speed is a uniform random variable over the interval [f1, f2], the simplified power spectral density of equation is
where Ci is an amplitude coefficient of the ith harmonic, and hi is the ith harmonic number. It has been verified that the modified Fourier spectral method gives a good simulation result of the random wave. The basic principle is that the Fourier amplitude spectrum calculated according to the target power density spectral with a random phase is used to create the artificial random wave through the inverse Fourier transform. Then the ratio of the wave spectrum to the target spectrum is used to generate an artificial random wave by iterative computation until the ratio approximately equals one (Xu et al., 2011).
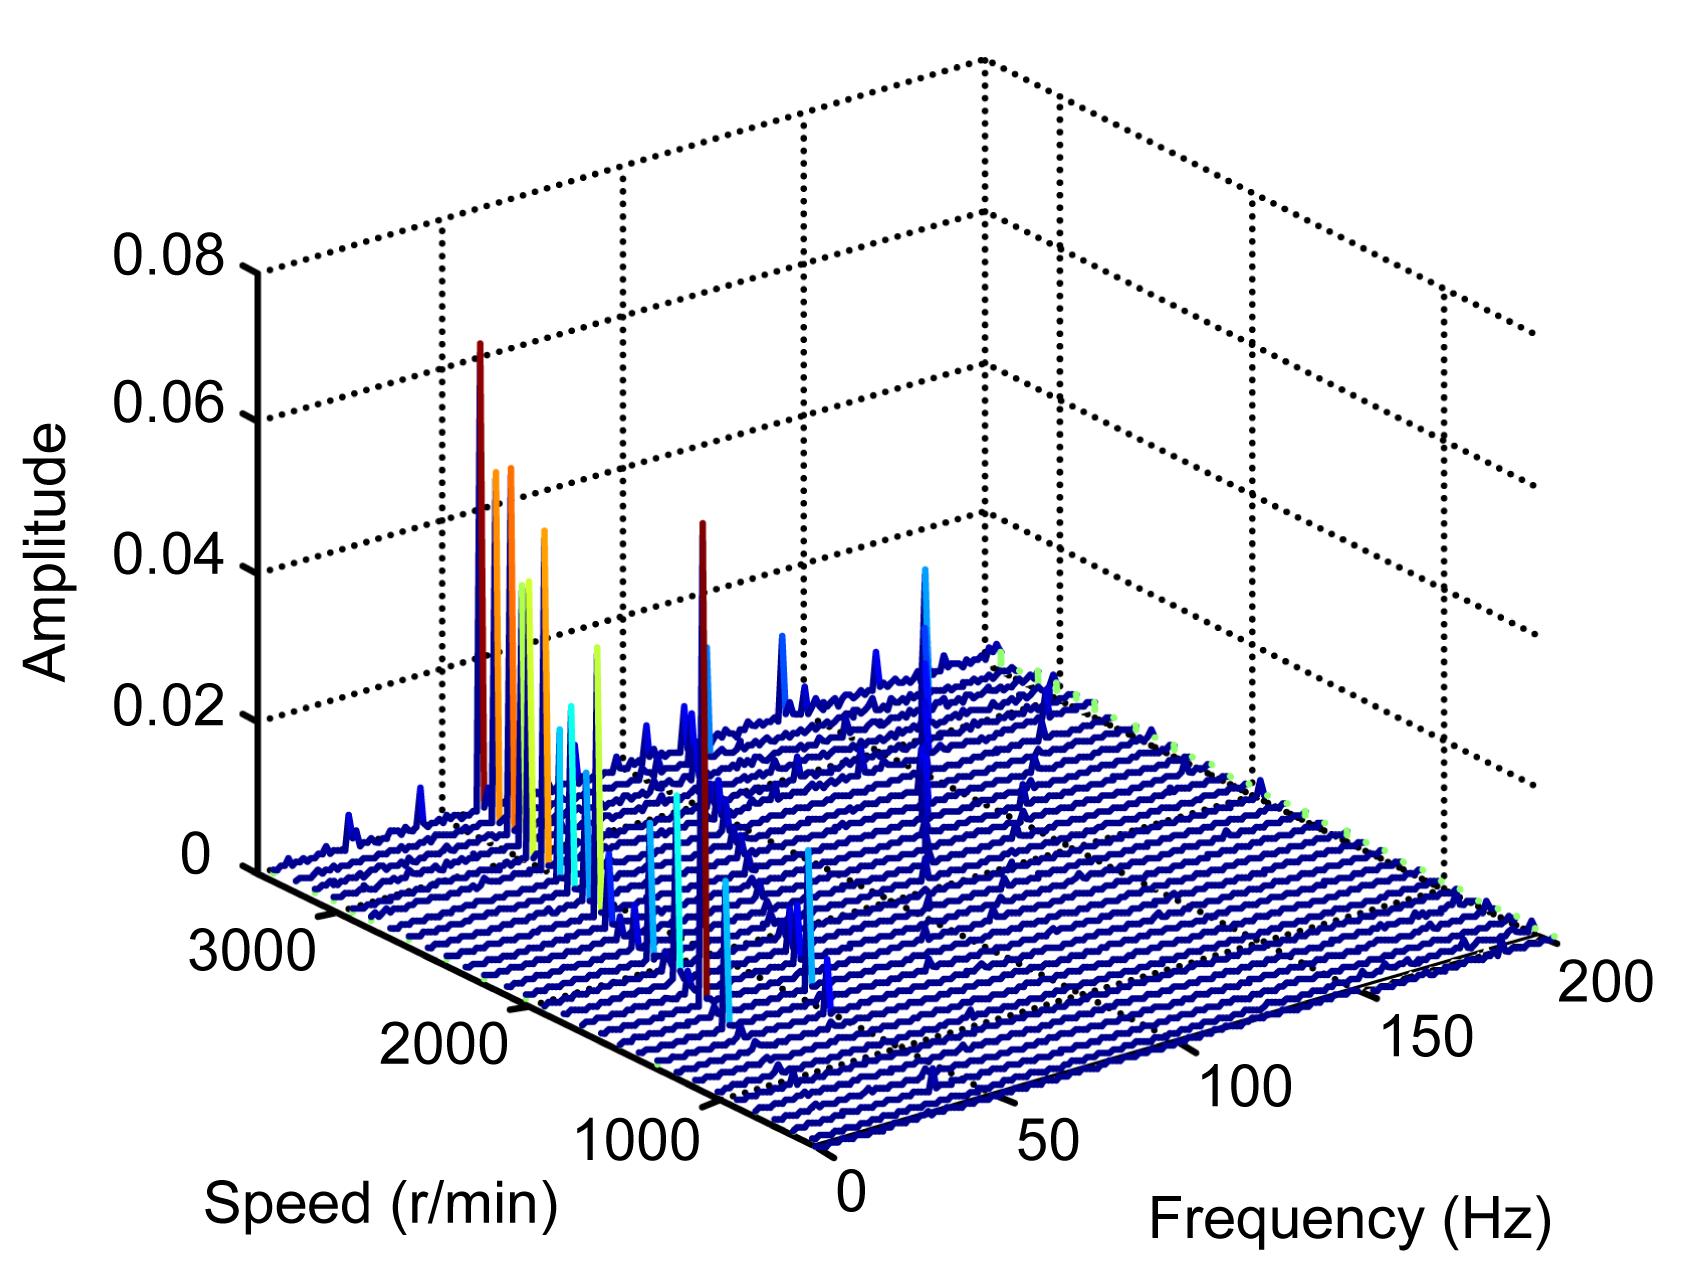
In Eq. (14) there are two parameters that require identification: Ci and hi (Masterson et al., 1999). Fig. 12 shows a water plot which consists of 30 wheel power spectrum density processed through 30 wheel time history data from 500 to 3400 r/min with an interval of 100 r/min, where the harmonic numbers are ratios of the wheel frequency disturbances. A MATLAB function is created to examine all the curves of amplitude spectra-normalized frequency individually and locate spikes. Numbers at which spikes occur in more than a given percentage of possible wheel speeds are returned as the harmonic numbers. Table 1 shows a matrix of spikes-harmonic numbers at different wheel speeds. The amplitude coefficients are determined by the least-squares method assuming parabolic relationship of the disturbance force amplitude and the wheel speed. Note that the calculated Ci with a large harmonic number or poor degree of fitting should be removed. Moreover, the resonance points should be neglected. The amplitude coefficient can thus be determined by the data in columns of harmonic numbers 1.00, 1.99, and 3.18.
Table 1
Matrix of spike-harmonic numbers at different wheel speeds
Wheel speed (r/min)
1.00
1.99
3.18
3.84
4.56
5.04
6.00
6.60
8.53
9.36
12.48
500
0.006
0.005
0.008
0.022
0.008
0.003
0.002
0.004
0.003
0.004
0.008
600
0.018
0.011
0.014
0.014
0.012
0.004
0.015
0.003
0.005
0.006
0.015
700
0.010
0.006
0.007
0.019
0.010
0.006
0.004
0.005
0.008
0.010
0.010
800
0.025
0.020
0.026
0.015
0.006
0.005
0.011
0.007
0.006
0.008
0.020
900
0.022
0.015
0.008
0.024
0.010
0.004
0.009
0.005
0.008
0.012
0.023
1000
0.038
0.022
0.017
0.018
0.006
0.006
0.018
0.009
0.013
0.016
0.015
1100
0.035
0.011
0.009
0.028
0.014
0.005
0.008
0.006
0.011
0.009
–
1200
0.027
0.018
0.018
0.020
0.012
0.008
0.015
0.010
0.007
0.012
–
1300
0.036
0.025
0.020
0.023
0.009
0.009
0.009
0.016
0.016
–
–
1400
0.043
0.085
0.012
0.027
0.015
0.007
0.027
0.011
–
–
–
1500
0.140
0.033
0.035
0.019
0.018
0.010
0.022
0.017
–
–
–
1600
0.039
0.135
0.013
0.022
0.012
0.012
0.015
0.009
–
–
–
1700
0.253
0.027
0.038
0.039
0.007
0.013
0.019
0.010
–
–
–
1800
0.055
0.087
0.025
0.025
0.029
0.015
0.025
0.015
–
–
–
1900
0.158
0.073
0.042
0.033
0.018
0.018
0.020
–
–
–
–
2000
0.049
0.047
0.022
0.029
0.012
0.020
0.050
–
–
–
–
2100
0.136
0.042
0.053
0.018
0.023
0.022
–
–
–
–
–
2200
0.076
0.036
0.042
0.044
0.014
0.025
–
–
–
–
–
2300
0.055
0.045
0.050
0.035
0.020
0.044
–
–
–
–
–
2400
0.098
0.033
0.046
0.052
0.016
–
–
–
–
–
–
2500
0.189
0.048
0.067
0.037
0.024
–
–
–
–
–
–
2600
0.132
0.056
0.080
0.048
0.038
–
–
–
–
–
–
2700
0.158
0.050
0.075
0.028
–
–
–
–
–
–
–
2800
0.143
0.068
0.064
0.050
–
–
–
–
–
–
–
2900
0.213
0.072
0.082
0.068
–
–
–
–
–
–
–
3000
0.192
0.057
0.076
0.056
–
–
–
–
–
–
–
3100
0.187
0.075
0.094
0.047
–
–
–
–
–
–
–
3200
0.221
0.074
0.106
–
–
–
–
–
–
–
–
3300
0.216
0.083
0.132
–
–
–
–
–
–
–
–
3400
0.250
0.081
0.112
–
–
–
–
–
–
–
–
Fig.12 Waterfall plot of power spectrum density of reaction wheel force
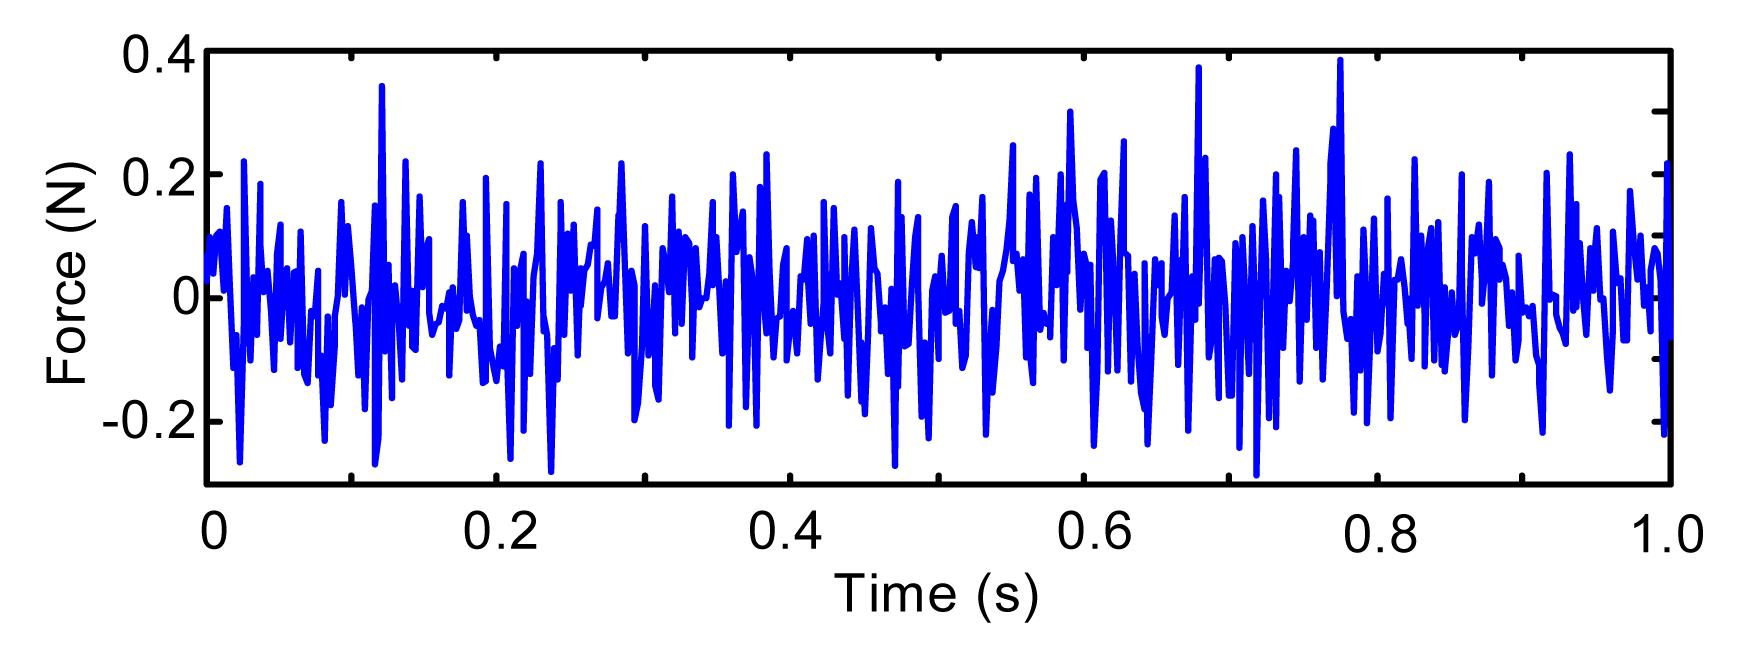
As an example, Fig. 13 shows the time history of the reaction wheel disturbance forces at 2500 r/min generated by the modified Fourier Spectrum method. As can be seen, the forces with small amplitude can simulate a micro-vibration environment in the spacecraft. Meanwhile, these responses demonstrate a degree of regularity; i.e., the amplitude increases as the wheel speed increases. With excellent characteristics of wheel force responses, the strut can be used to evaluate the performance of instruments in a satellite affected by small vibration.
Fig.13 Time interval of reaction wheel force at 2500 r/min
3.2. Vibration attenuation analysis
3.2.1. Dynamic model of strut
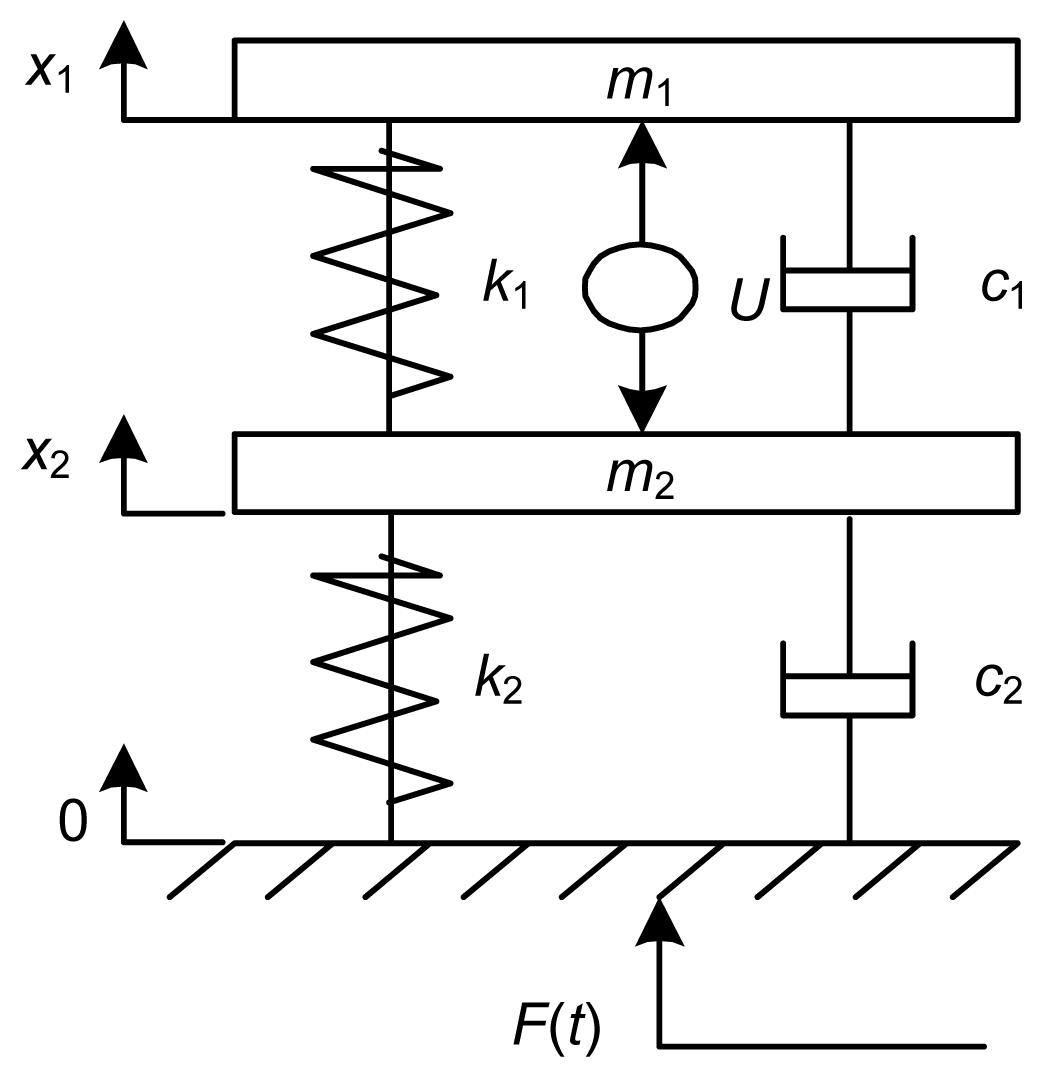
The Stewart platform provides vibration attenuation in six axes, three translations and three rotations. Each of the six struts is designed to be identical to the others, both mechanically and electromechanically. It has been illustrated that each strut can be decoupled if the Stewart platform deliberately employs a special geometry or is particularly located, for example, in an orthogonal configuration, or if the instrument is located in the central axis (Bandyopadhyay and Ghosal, 2009). Considering the use of PZT and VCM and viscoelastic material in the architecture of a single strut, a vibration control measure of the active-passive series isolation system is designed. Fig. 14 describes the dynamic model diagram of this approach. The active elements are below the passive element. The active elements are represented by a stiff spring k1, a damper c1, and a force generator U; the passive element is represent by a stiff spring k2 and a damper c2. Given the presumption that both the base and the actuator are relatively rigid, the passive element motion will coincide with the base motion once the active elements are turned off. Hence, the advantage of the series active-passive system is having a sustainable and stable function state. Thus, the passive element still works, and then the active elements are powered off. In this case, the instrument performance could be improved by adding a passive damper, which is used to achieve better vibration attenuation effect.
Fig.14 Dynamic model of single strut of the Stewart platform
Then, the dynamic model of the strut (Fig. 14) is established with its dynamical equation being
The equation is rewritten into the following matrix form:
.
That is,
.
The state-space equation is
where, , .
3.2.2. Numerical analysis
The effectiveness of the vibration attenuation strategy is evaluated by combining a stochastic model of the reaction wheel, as stated above. Therefore, a vibration controller should be designed based on linear time-invariant control theory to allow prediction of instrument performance in the presence of on-orbit disturbances. A methodology called LQR, which explicitly addresses this vibration control issue of a linear system, is developed from modern control theory. In this section, the LQR method is used to evaluate the contribution of VCM and PZT to vibration attenuation. The cost function for LQR design is expressed as
,
where, .
As the amplitude of vibration is very small when the Stewart platform is at a specific configuration, we assume that the values of the damper and stiffness are constant. The following parameters are used: m1= 25 kg, m2=5 kg, k1=620 N/m, k2=1.2×10⁶ N/m, c1= 0.5 N∙s/m, and c2=1200 N∙s/m.
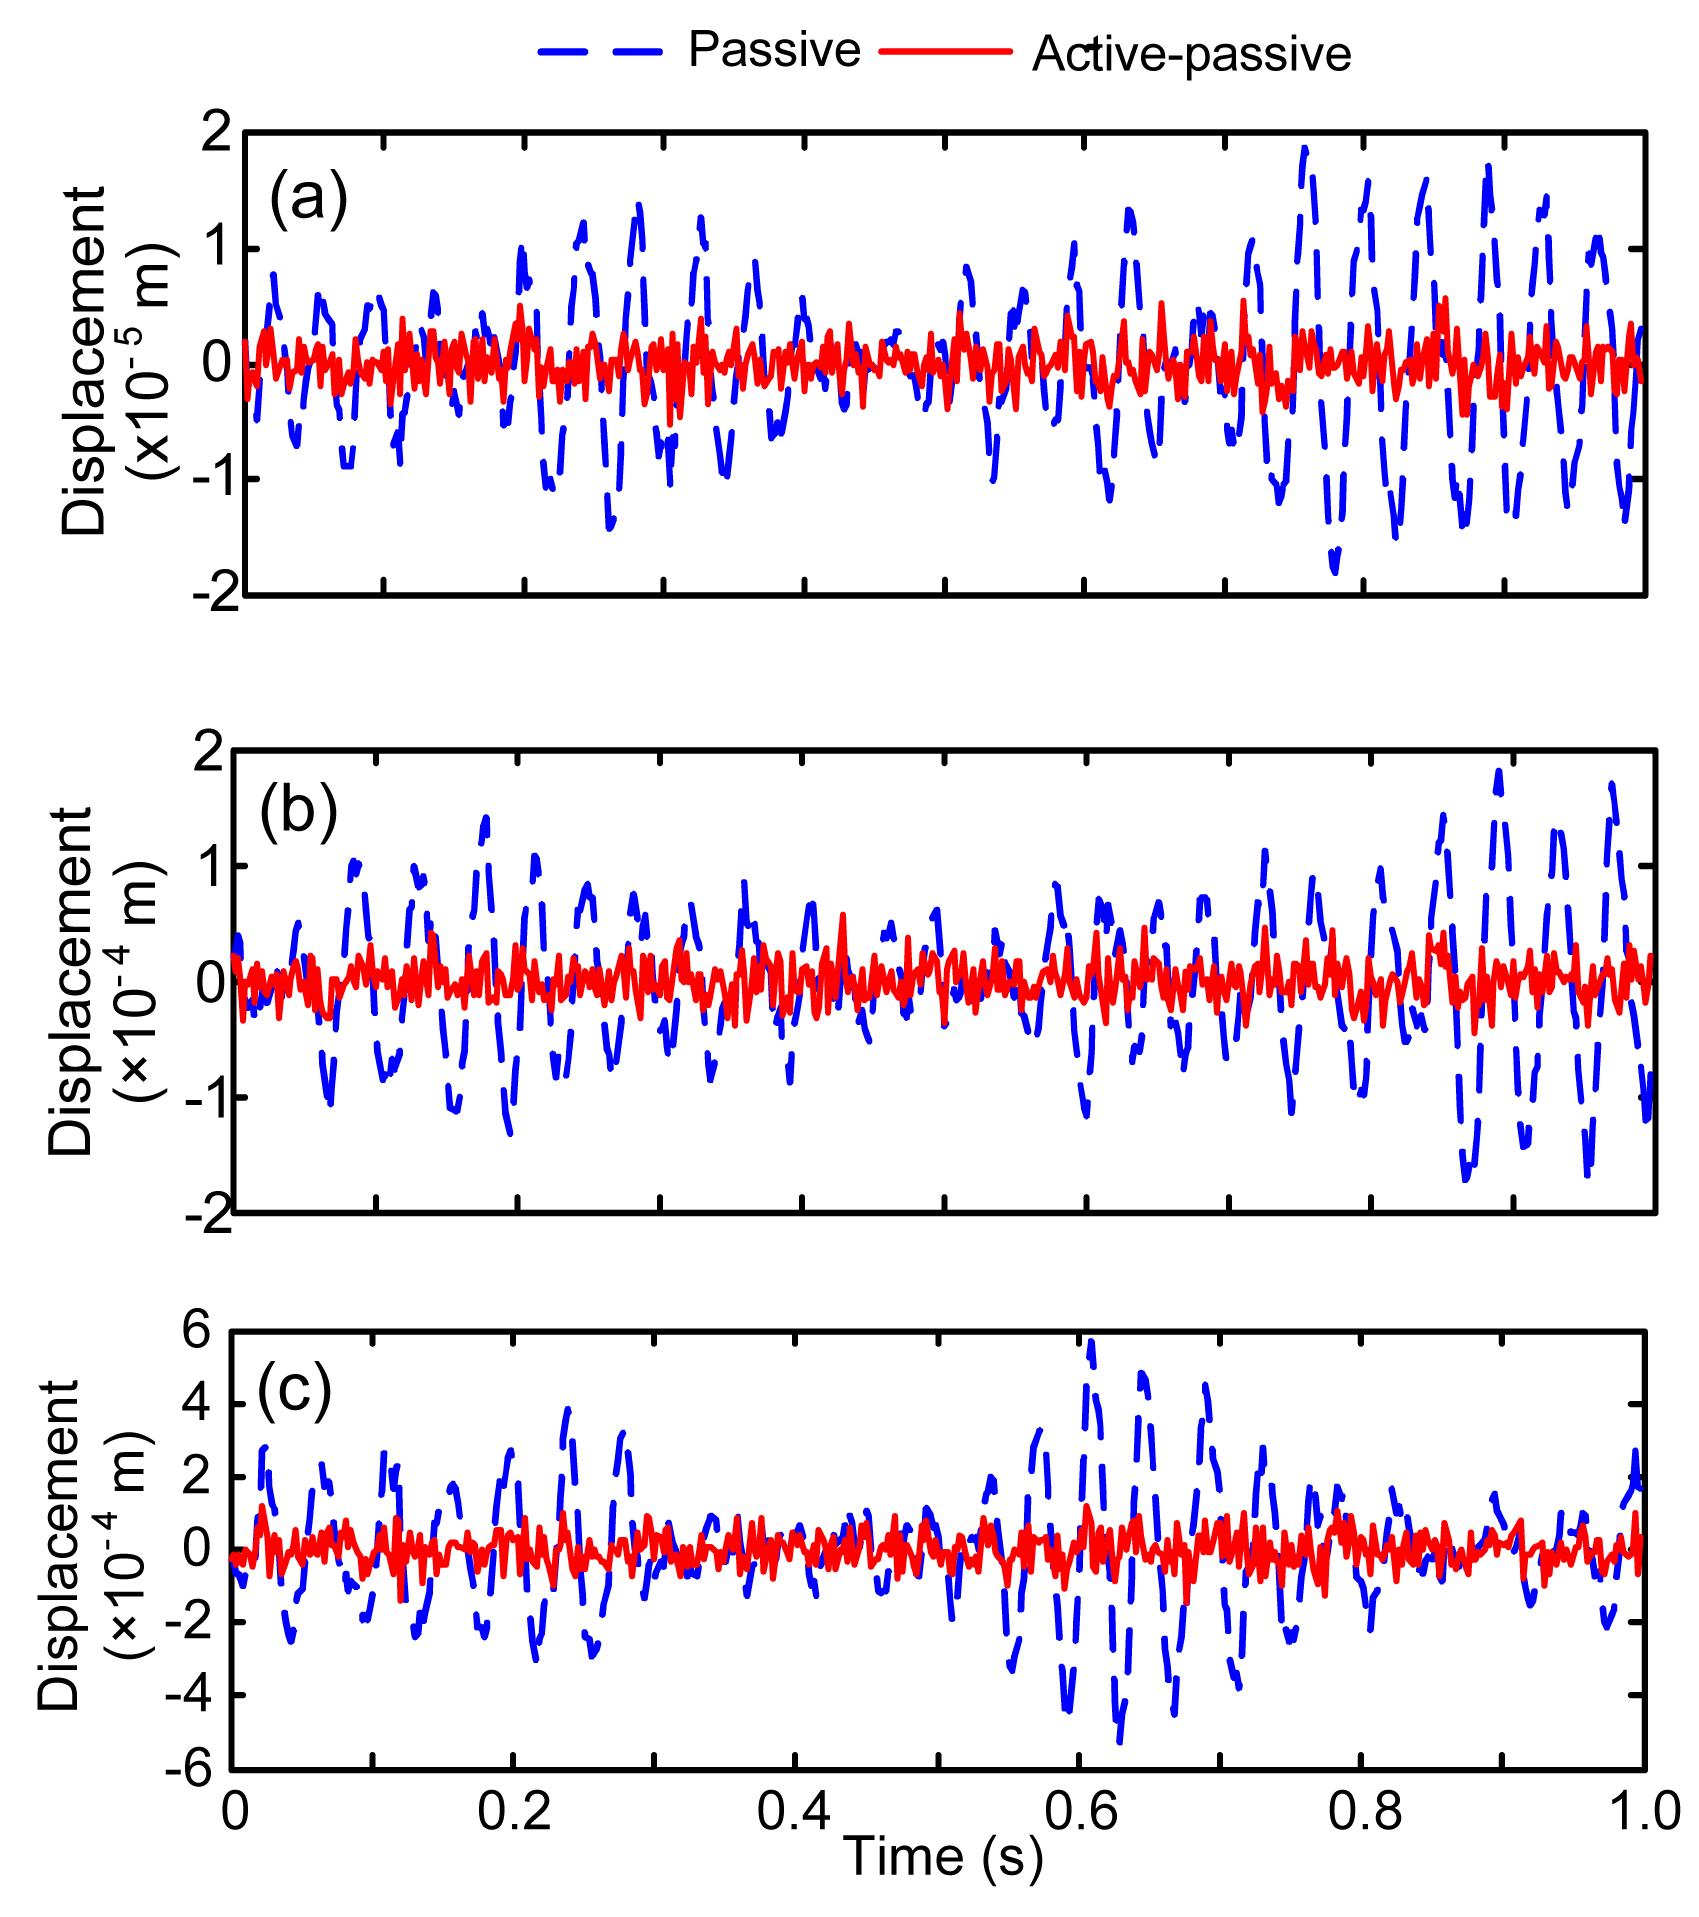
Then a numerical simulation is carried out in MATLAB. Fig. 15 shows the simulation results. There are 30 reaction wheel forces corresponding to 30 reaction wheel speeds. Here, only the responses at 500, 1500, and 2500 r/min are selected to show the vibration attenuation effects. Two cases of responses are plotted in the same figure to compare the passive control condition with the active-passive control condition for the reaction wheel force inputs. This visual presentation is effective in showing that the system provides significant vibration attenuation effect. Meanwhile, the control forces can be obtained according to the real-time condition. Table 2 summarizes the results of the vibration control for a single strut of the Stewart platform. Note that the peak value of displacement is decreased from 18.13 μm to 5.28 μm with 70.88% attenuation, at a wheel speed of 500 r/min. The maximum control force obtained is 0.01232 N. A similar approach is applied to the other wheel speeds. The peak value of displacement is decreased from 176 μm to 44.48 μm with 74.73% attenuation, when the wheel speed is 1500 r/min. Also, the peak value of displacement has a 73.45% attenuation decreasing from 539.7 μm to 143.3 μm when the wheel speed is 2500 r/min. The maximum control force is 0.1255 N and 0.2562 N, respectively.
Table 2
Results of the vibration control for single strut of the Stewart platform
Speed (r/min)
Strategy
Peak displacement (μm)
Control effect index (%)
Maximum control force (N)
500
Passive
18.13
–
–
Active-passive
5.28
70.88
0.01232
1500
Passive
176.00
–
–
Active-passive
44.48
74.73
0.1255
2500
Passive
539.70
–
–
Active-passive
143.30
73.45
0.2562
Fig.15 Comparison of passive control and active-passive control of the displacement response at 500 r/min (a), 1500 r/min (b), and 2500 r/min (c)
4. Conclusions
A system approach for instruments of an on-orbit spacecraft has been proposed, where the track-positioning and vibration control systems are established based on VCM and PZT technology. The effectiveness of track-positioning with a PID controller is evaluated under step signal and sinusoidal signal excitations. The results demonstrate that the control system is capable of tracking position to meet the special position requirement. In addition, the vibration affecting the positioning accuracy is attenuated by the designed active-passive control system, and responses of the passive and active-passive control cases are compared at different wheel speeds. Analysis results show that the active-passive control system has remarkable ability in attenuating the effect of small vibration on instruments. The strut of the Stewart platform with track-positioning and vibration control systems satisfies the requirement of instrument fine pointing.
[2] Bandyopadhyay, S., Ghosal, A., 2009. An algebraic formulation of static isotropy and design of statically isotropic 6-6 Stewart platform manipulators. Mechanism and Machine Theory, 44(7):1360-1370.
[3] Fraguela, L., Fridman, L., Alexandrov, V.V., 2012. Output integral sliding mode control to stabilize position of a Stewart platform. Journal of the Franklin Institute, 349(4):1526-1542.
[4] Grewal, K.S., Dixon, R., Pearson, J., 2012. LQG controller design applied to a pneumatic Stewart-Gough platform. International Journal of Automation and Computing, 9(1):45-53.
[5] Huang, X.H., Horowitz, R., Li, Y.F., 2005. Track-following control with active vibration damping and compensation of a dual-stage servo system. Microsystem Technologies, 11(12):1276-1286.
[6] Li, Y., Horowitz, R., 2002. Design and testing of track-following controllers for dual-stage servo systems with PZT actuated suspensions. Microsystem Technologies, 8(2-3):194-205.
[7] Li, Y., Ang, K.H., Chong, G.C.Y., 2006. PID control system analysis and design. IEEE Control Systems Magazine, 26(1):32-41.
[8] Liu, Y.J., Li, T., Sun, L.N., 2009. Design of a control system for a macro-micro dual-drive high acceleration high precision positioning stage for IC packaging. Science in China Series E: Technological Sciences, 52(7):1858-1865.
[9] Masterson, R.A., Miller, D.W., Grogan, R.L., 1999. Development of Empirical and Analytical Reaction Wheel Disturbance Models. , AIAA/ASME/ASCE/AHS/ASC Structures, Structural Dynamics, and Materials Conference and Exhibit, 40th AIAA/ASME/AHS Adaptive Structure Forum and AIAA Forum on Non-deterministic Approaches, 12-15. :12-15.
[10] Mukherjee, P.B., Dasgupta, B., Mallik, A.K., 2007. Dynamic stability index and vibration analysis of a flexible Stewart platform. Journal of Sound and Vibration, 307(3-5):495-512.
[11] Mura, A., 2012. Multi-dofs MEMS displacement sensors based on the Stewart platform theory. Microsystem Technologies, 18(5):575-579.
[12] Neat, G.W., Melody, J.W., Lurie, B.J., 1998. Vibration attenuation approach for space borne optical interferometers. IEEE Transactions on Control System Technology, 6(6):689-700.
[13] Preumont, A., Horodinca, M., Romanescu, I., de Marneffe, B., Avraam, M., Deraemaeker, A., Bossens, F., Abu Hanieh, A., 2007. A six-axis single-stage active vibration isolator based on Stewart platform. Journal of Sound and Vibration, 300(3-5):644-661.
[14] Stewart, D., 1965. A platform with six degrees of freedom. Proceedings of the Institution of Mechanical Engineers, 180:371-386.
[15] Sullivan, L.A., Erwin, R.S., Denoyer, K.K., 2000. Experiences with smart structures for on-orbit vibration isolation. SPIE, 3991:122-130.
[16] Wang, Z.L., He, J.J., Gu, H., 2011. Forward kinematics analysis of a six degree-of-freedom Stewart platform based on independent component analysis and Nelder-Mead algorithm. IEEE Transactions on Systems, Man, and Cybernetics A, 41(3):589-597.
[17] Xu, Z.D., Wang, D.X., Wu, K.Y., 2011. Simulation of stochastic wind field for large complex structures based on modified Fourier spectrum. Journal of Zhejiang University-SCIENCE A (Applied Physics & Engineering), 12(3):238-246.
[18] Zhang, Z., Cui, L., Huang, H., 2011. A Real-time Linux Based Controller for Active Vibration Isolation Stewart Platform and the Experiment. , 30th Chinese Control Conference, Beijing, 2429-2434. :2429-2434.
Open peer comments: Debate/Discuss/Question/Opinion


Open peer comments: Debate/Discuss/Question/Opinion
<1>