1. Introduction
Over the past 20 years, rapid development has been made on modern cable-stayed bridges (Gimsing and Georgakis,
2011). Many researchers have studied the dynamic behavior during ambient vibration and seismic response under multi-support excitations on long-span cable-stayed bridges, where the influences of the traveling wave effect, coherence loss, and local site conditions should be considered. For example, Wilson and Gravelle (
1991), Ren et al. (
2005), and Pantaleon et al. (
2010) studied the dynamic behaviors of cable-stayed bridges through 3D finite-element (FE) models. In these studies, the modal behaviors predicted by the FE models were compared to the measured characteristics from ambient vibrations of full-scale cable-stayed bridges. On the other hand, 3D nonlinear seismic response analyses of long-span cable-stayed bridges have been conducted (Abdel-Ghaffar and Nazmy,
1991; Nazmy and Abdel-Ghaffar,
1992; Zavoni and Vanmarcke,
1994; Allam and Datta,
1999; Ren and Makoto,
1999). In China, Fan et al. (
2001), Li et al. (
2005), Bao et al. (
2008), as well as Lin et al. (
2009) studied the linear and nonlinear response characteristics of long-span cable-stayed bridges during uniform excitations and non-uniform excitations. These investigations concentrated on two-tower cable-stayed bridges.
A few researchers were involved in theoretical and numerical simulation to understand the seismic response mechanisms of multi-span cable-stayed bridges subjected to multi-support excitations. Fang et al. (
2011) explored the influence of traveling-wave effects on the seismic responses of a multi-span cable-stayed bridge with different constraint mechanisms between the main towers and main girder. Okamoto and Nakamura (
2011) studied seismic responses of a multi-span cable-stayed bridge with steel/concrete hybrid towers subjected to medium and ultra-strong seismic waves specified in the “Japanese Seismic Code for Highway Bridges”. This study revealed that a new steel/concrete hybrid tower is feasible for multi-span cable-stayed bridges and is most effective for seismic forces when the main girder is connected with bi-linear springs.
Meanwhile, the collapse analysis of cable-stayed bridges under strong earthquakes has gradually gained attention after the recent experience of many strong earthquakes. For example, Self and Dilger (
1990) described the behavior of planar prestressed concrete cable-stayed bridges until failure occurred, taking into account the geometric and material nonlinearities under static loads. Song and Kim (
2007) discussed the analysis problem of the in-plane overall collapse mechanisms during static loads, and the evaluation of the ultimate load-carrying capacities of cable-stayed bridges with various cable layouts using the bifurcation point instability approach. However, they did not study the structural behavior under dynamic loads. Luo et al. (
2010) compared the collapse process of the concrete girder bridge (Baihua Bridge, China) during the Wenchuan earthquake between a simulation analysis and a practical situation, which shows that the local components of the connecting devices were destroyed first. Yoo et al. (
2012) proposed a new and simple method for estimating the collapse load of a steel cable-stayed bridge under static loads. The results demonstrated that the proposed method is a good substitute for a complex nonlinear inelastic analysis to approximately evaluate the collapse loads as well as the failure modes of steel cable-stayed bridges. Note that the collapse analysis and failure control of long-span cable-stayed bridges during strong earthquakes have seldom been done, let alone analyzing the impact on multi-span cable-stayed bridges.
This paper focuses on the numerical simulation of a seismic response for a multi-span cable-stayed bridge scale model under uniform excitations and non-uniform excitations.
2. Scaled multi-span cable-stayed bridge
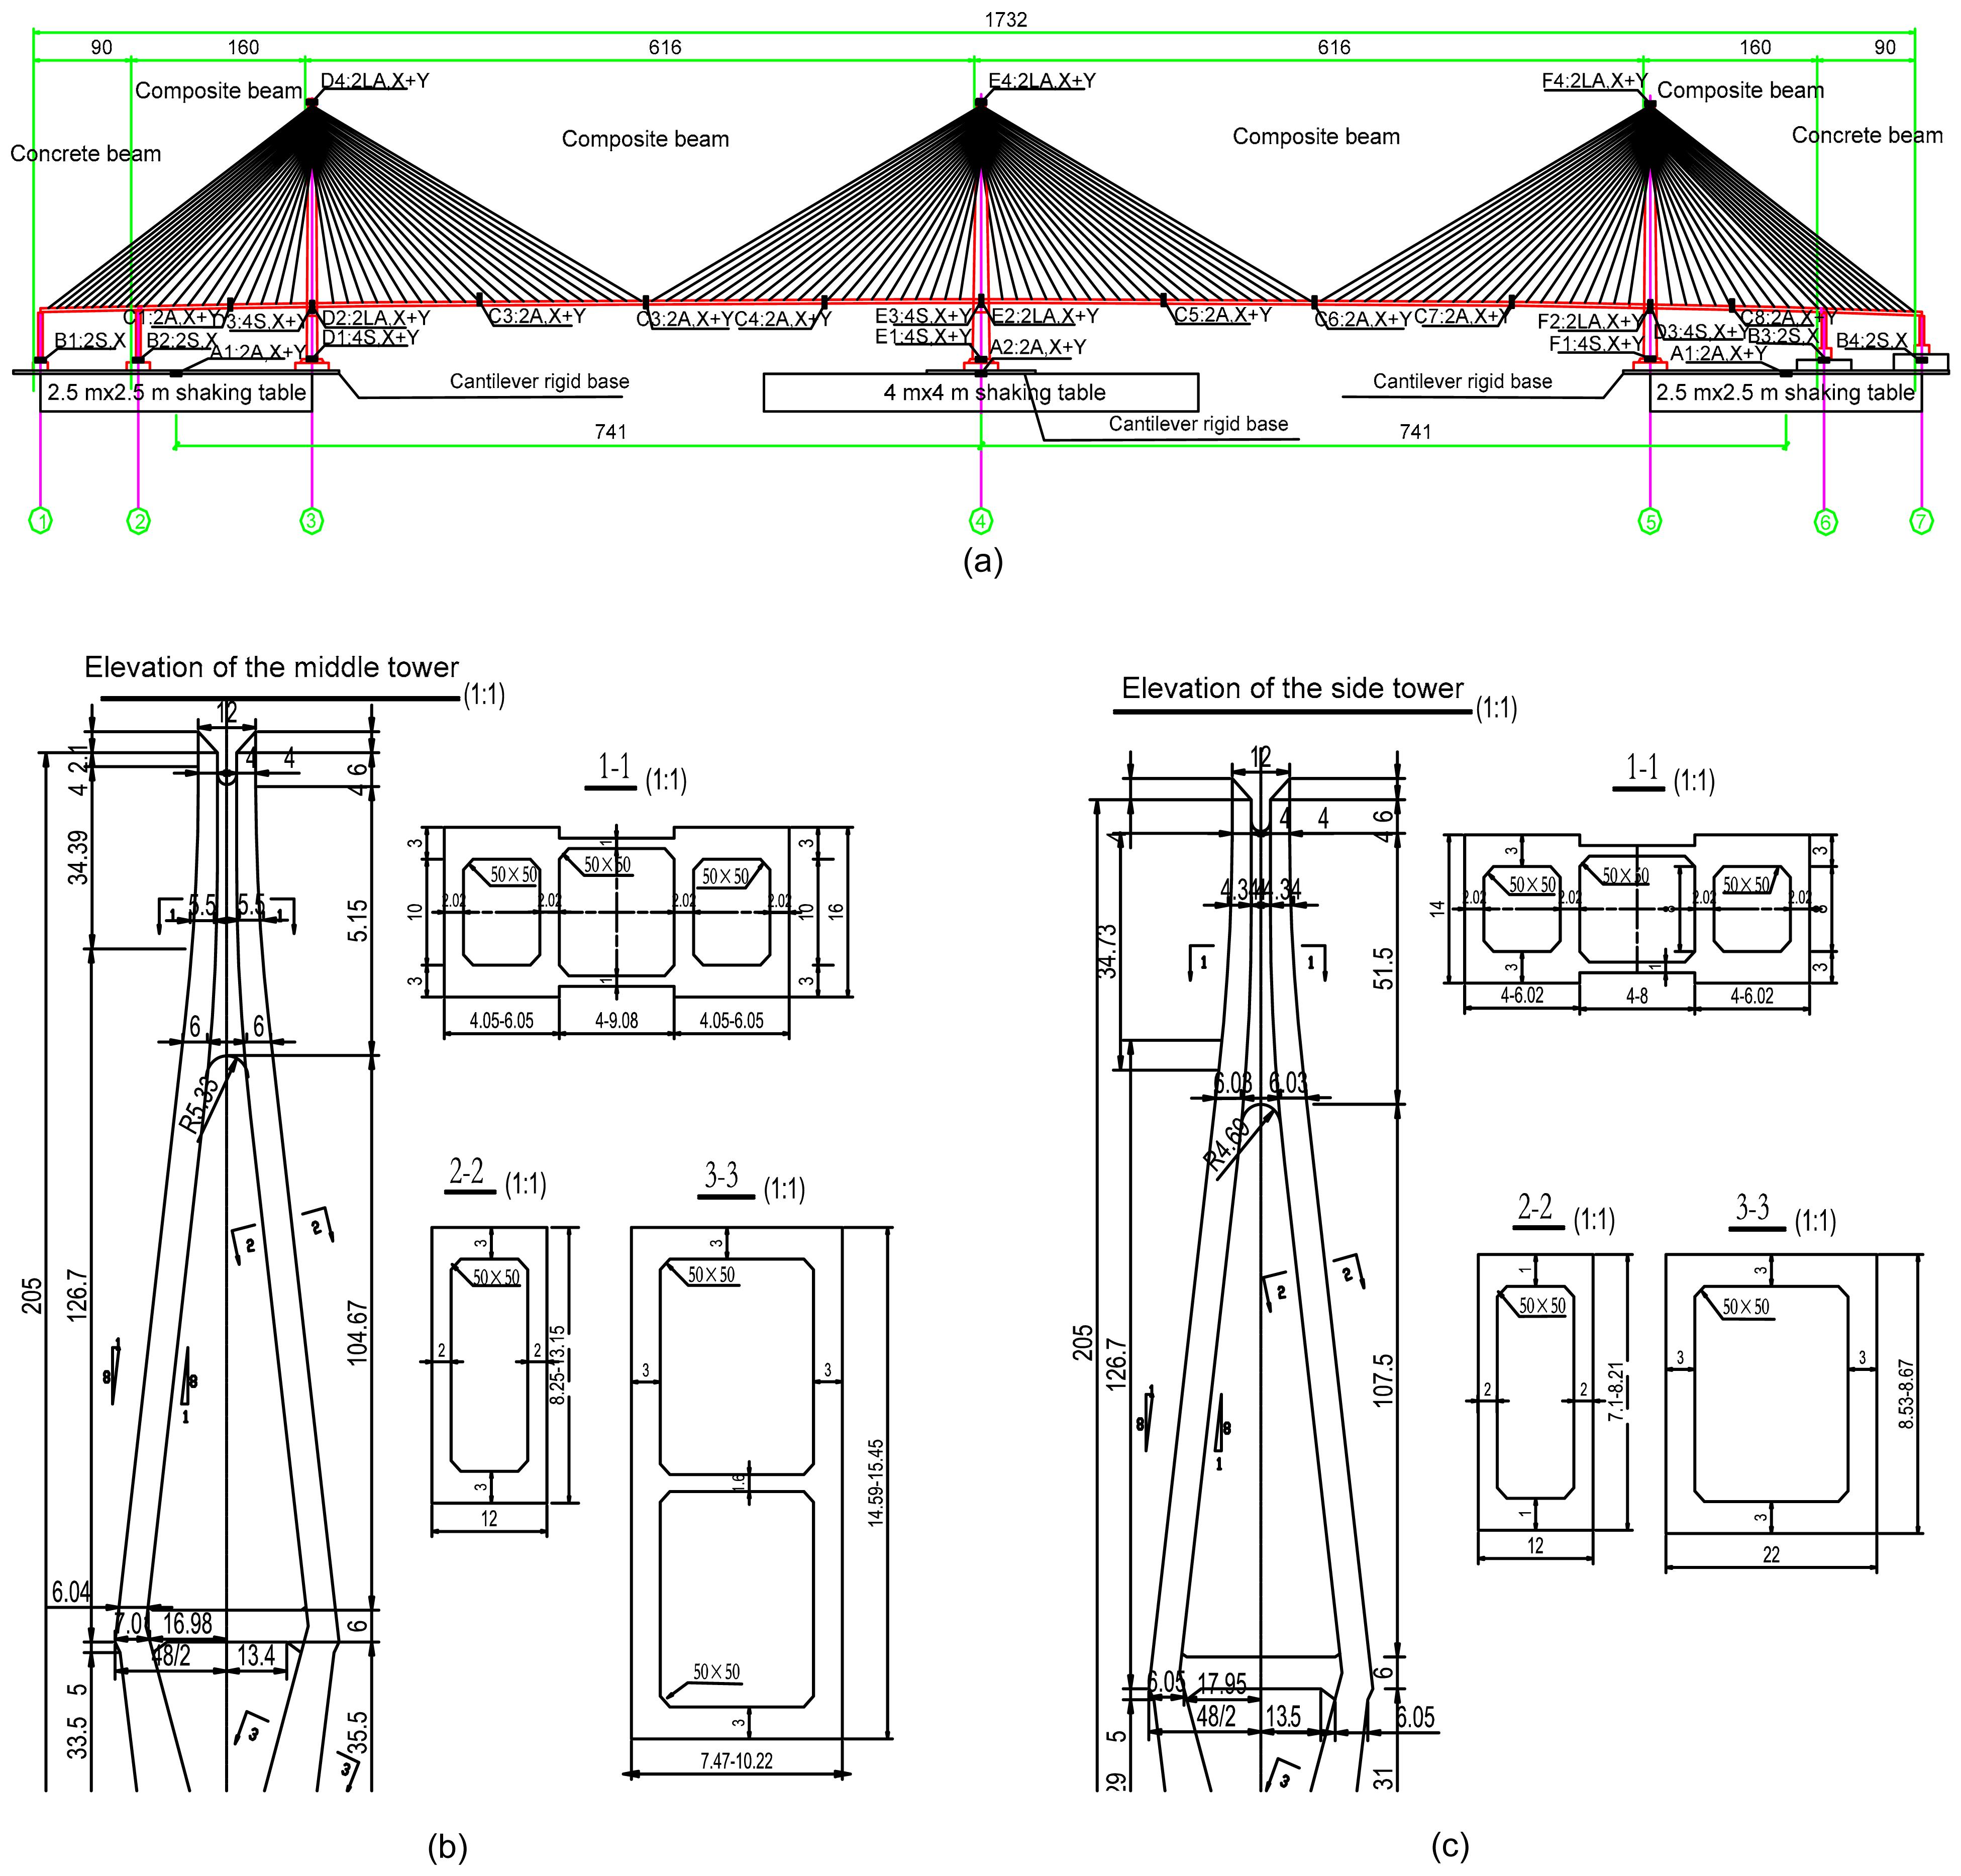
The Wuhan Erqi Yangtze River Bridge, a three-tower and double-cable-plane cable-stayed bridge, was selected as the prototype bridge for a multi-span cable-stayed bridge. A 1:100 scale model with a 17.32 m length for the main girder and a 2.05 m height for the main towers was tested by using earthquake shaking tables (Fig.
1). The analytical modeling discussed in this study simulates the seismic response of the scale model during multi-support excitations up to failure. For a detailed description of the prototype bridge and scale model, please refer to the relevant study of ‘Part I: shaking table tests’ (Zong et al.,
2014). Fig.
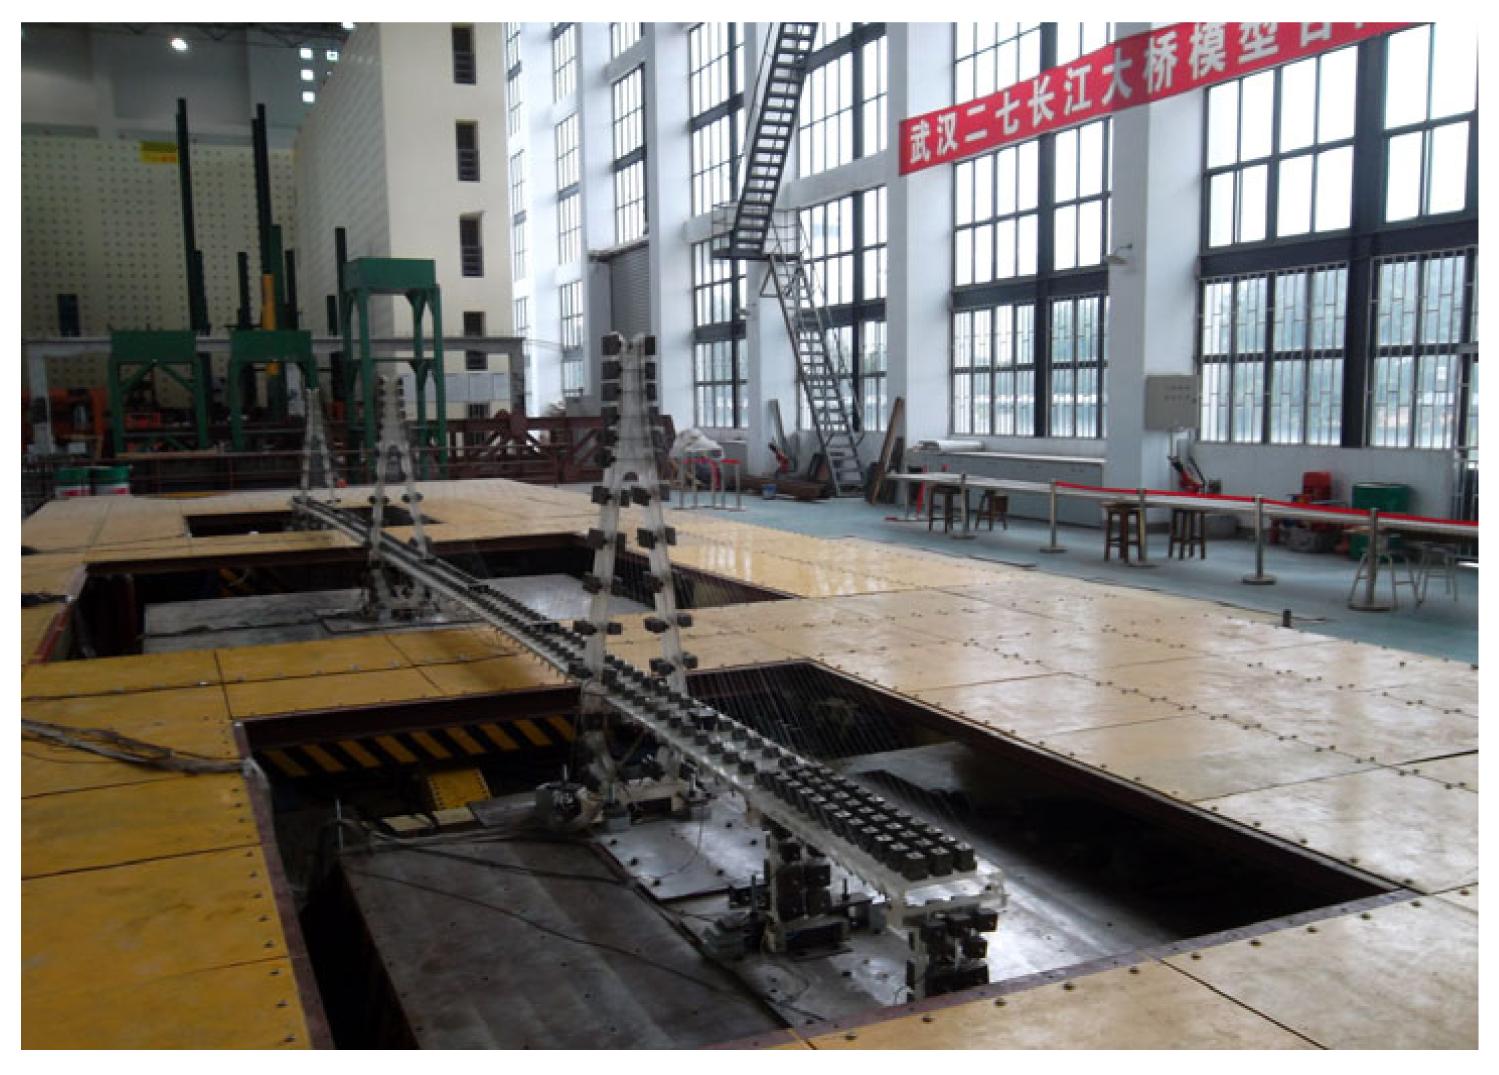
2 shows the scale model test setup.
Fig.1
Three-tower cable-stayed bridge scale model (unit: cm): (a) longitudinal arrangement of the scale model; (b) dimension of the middle tower; (c) dimension of the side tower
Fig.2
Test setup of the scale model
3. Finite element modeling of the scale model
3.1. Single girder model
A 3D single girder FE model of the scale model was established based on ANSYS software (Nazmy and Abdel-Ghaffar,
1990a;
1990b; Wilson and Gravelle,
1991). Spatial beam-column elements (BEAM4) with six degrees of freedom at each node were adopted to model the main girder, cross beams, towers, and side piers. The truss elements (LINK10), having only tension stiffness, were used to model the cables. The main girder was modeled by using a single central spine with offset links to accommodate lumped masses and cable anchor points, and stiffness was assigned to the spine to simulate the actual stiffness of the main girder. The nonlinearity of the cables was accounted for by an equivalent tangent equation (Ernst,
1965; Nazmy and Abdel-Ghaffar,
1990a;
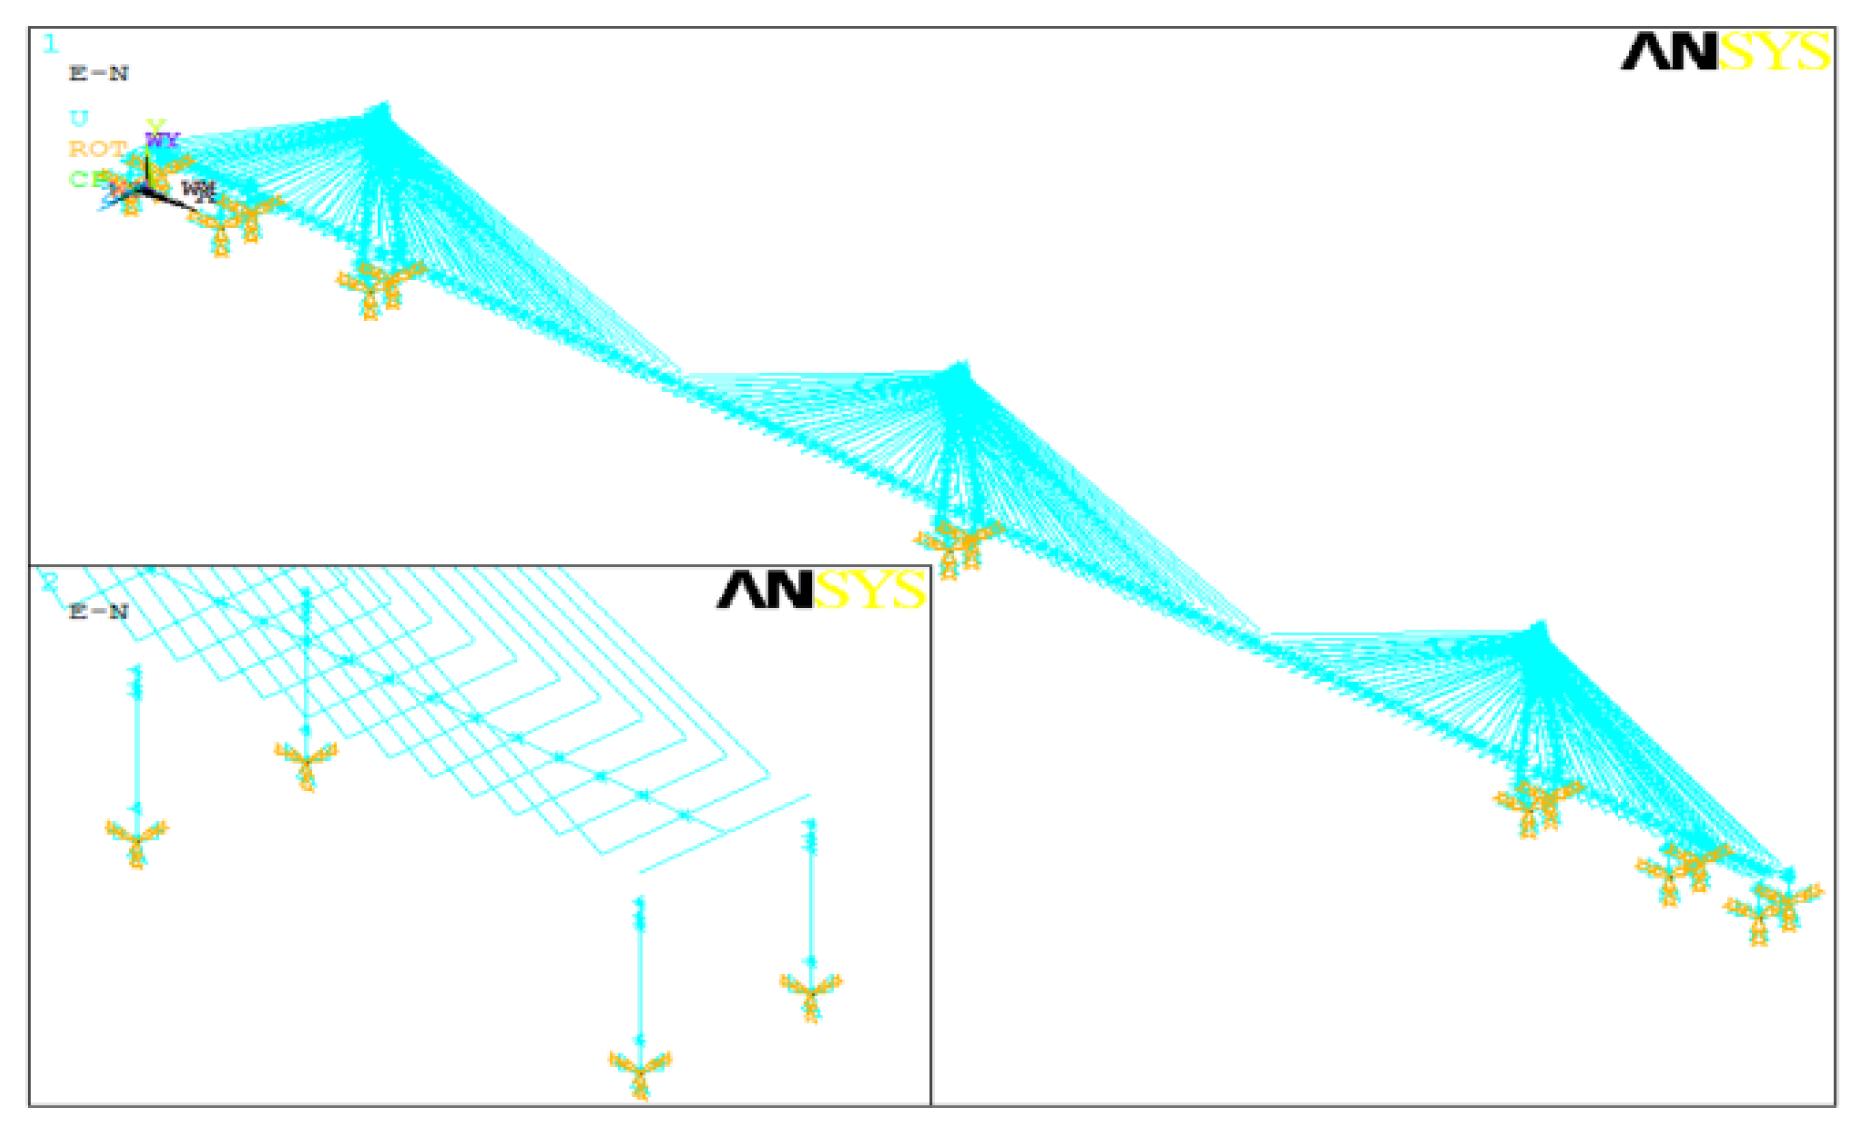
1990b). The supplemental masses were modeled by using the mass elements (MASS21) defined by a single node. The vertical bearings among the towers, side piers, and superstructure were modeled by using spring-damper elements (COMBIN14) defined by two nodes of a spring constant and damping coefficients, and the other connections among the towers, side piers, and superstructure were simulated by coupling the corresponding rotational and lateral degrees of freedom. The bottom of the towers and the side piers were completely fixed, ignoring the influence of the soil-pile-structure interactions. The single girder model of the scale model has 706 nodes and 1600 elements (Fig.
3).
Fig.3
Spatial finite element model of the scale model
The first 15 natural modal frequencies and vibration modes of the scale model were calculated, as well as the partial measured frequencies from the shaking table tests were compared (Table
1). It can be seen that the measured frequencies of the scale model are consistent with those of the numerical calculation by the single girder model. These results indicate that the single girder model is accurate enough for studying the dynamic characteristics and the seismic responses of a long-span cable-stayed bridge, and for the requirements of related dynamic researches on full structures. However, the implicit FE model cannot directly simulate the whole failure process of long-span cable-stayed bridges to demonstrate the mechanisms of collapse and failure of the complex structures during a strong earthquake.
Table 1
Summaries of first 15 modes of the bridge model
| Order number |
Testing frequency (Hz) |
Simulation frequency (Hz) |
Characteristics of modes |
| 1 |
– |
1.832 |
Longitudinal floating vibration of the deck |
| 2 |
– |
3.039 |
Antisymmetric lateral bending vibration of the side tower |
| 3 |
– |
3.545 |
Symmetric lateral bending vibration of the side tower |
| 4 |
– |
5.808 |
Lateral bending vibration of the middle tower |
| 5 |
6.087 |
6.048 |
Antisymmetric lateral bending vibration of the deck |
| 6 |
8.272 |
8.255 |
Symmetric lateral bending vibration of the deck |
| 7 |
9.023 |
9.066 |
Antisymmetric vertical bending vibration of the deck |
| 8 |
11.507 |
11.361 |
Symmetric vertical bending vibration of the deck |
| 9 |
– |
11.391 |
Antisymmetric torsion vibration of the side tower |
| 10 |
– |
12.528 |
Symmetric torsion vibration of the side tower |
| 11 |
– |
13.852 |
Torsion vibration of the middle tower |
| 12 |
– |
17.088 |
The second antisymmetric lateral bending vibration of the deck |
| 13 |
– |
17.647 |
The second symmetric lateral bending vibration of the deck |
| 14 |
– |
18.161 |
Antisymmetric lateral bending vibration accompanied by torsion |
| 15 |
– |
18.261 |
Symmetric lateral bending vibration accompanied by torsion |
3.2. Explicit dynamic model
In recent years, dynamic disasters, collapse failures and their effect on long-span cable-stayed bridges under complex service environments, such as earthquakes, typhoons explosions, and collisions, have been receiving increasing attention with the rapid development of cable-stayed bridges around the world. Because the collapsing process of a cable-stayed bridge is noticeably discontinuous, large deformation, and highly nonlinear, traditional implicit FE methods are hard to simulate the collapse and failure mechanisms of the cable-stayed bridge during a strong earthquake. On the other hand, explicit dynamic algorithms are using a small time step to meet the convergence conditions and save the calculation costs by avoiding the stiffness matrix through inverse in the implicit integration algorithm. In this study, LS-DYNA, as one of the prominent explicit dynamic programs, was adopted to simulate the collapse and failure process of the multi-span cable-stayed bridge scale model during multi-support excitations (LSTC,
2006). The main girder, main towers, and central buckles were modeled by using spatial beam elements BEAM161 which included finite transverse shear strains. The cables were modeled by using elements LINK167 which allowed elastic cables to be realistically modeled. The vertical bearing among the towers, side piers, and the main girder were modeled by using elements COMBI165 which allowed us to model simple spring or damper systems, and the attached masses were modeled by using MASS166 elements which are defined by a single node with concentrated mass components.
To preferably reflect the material property, an elastic-plastic model with kinematic hardening (MAT_PLASTIC_KINEMATIC3) was used to simulate the polymethyl methacrylate (PMMA). The yielding stress and the failure strain of the PMMA were 5.5 MPa and 0.0325
ε in the failure criteria definition of the material, respectively. The modulus of elasticity and the mass density of the PMMA were 2690 MPa and 1180 kg/m
3, respectively. The discrete beam element model (MAT_CABLE_DISCRETE_BEAM) was used to model the high-tensile steel cables, and the offset was set in the real constants of the cable elements. The modulus of elasticity and the mass density of the cables were 195 000 MPa and 7850 kg/m
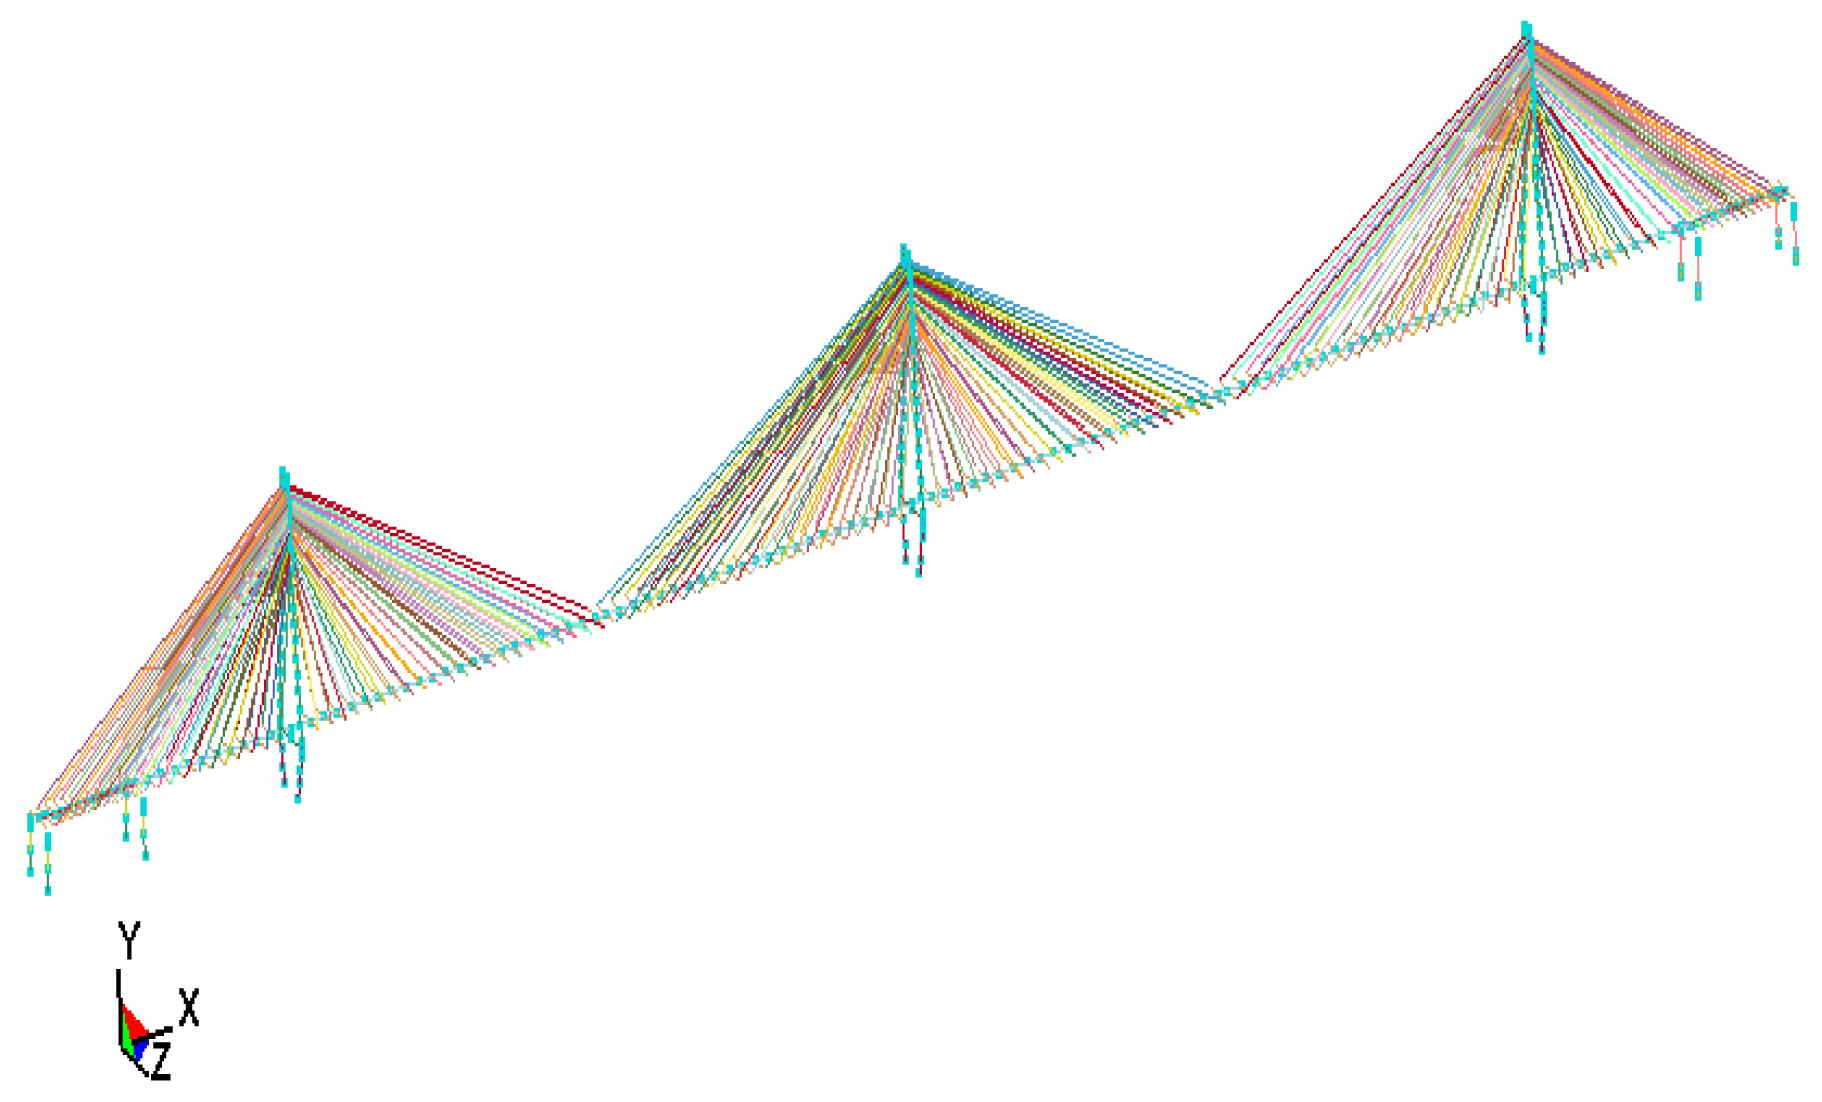
3, respectively. The rigid arm of the main girder was simply modeled by the rigid body model through constraining the freedom degrees of the rigid body through the DEMP command, thus the computing time was greatly reduced. The spring element model (MAT_SPRING_ELASTOPLASTIC) was adopted to model the vertical bearings among the towers, side piers, and main girder. Through the TBDATA command, the elastic stiffness and shear stiffness were set as 1.5 MPa and 5.5 MPa, respectively. The explicit dynamic relaxation method was adopted to consider the action of gravity, and the single automatic contact was used to simulate the dynamic contact problem in the process of the collapse. The explicit dynamic model of the three-tower cable-stayed bridge scale model has 706 nodes and 1600 elements (Fig.
4).
Fig.4
Explicit dynamic model of the scale model
4. Single girder finite element model verification
Based on the above single girder FE model, the time-history analysis of the scale model during uniform excitations and non-uniform excitations was conducted by the Newmark-
β method.
Three synthetic seismic waves with the length of time of 20.5 s including the Wuchang (WC) wave, Jiangxin (JX) wave, Hankou (HK) wave, and El Centro (EC) wave were selected as the input excitations described in the relevant study of ‘Part I: shaking table tests’ (Zong et al.,
2014) (Fig.
5, p.411). Since only the acceleration and strain parameters were measured in the shaking table tests, the acceleration responses of the towers in the test and the FE analysis (FEA) were compared (Table
2). Table
2 indicates that the test results are in good agreement with the results from FEA, and most of the errors are less than 10% on the whole. The numerical simulation results are a little higher than those from the tests due to the simplified disposal of the deck in establishing the FE model and the errors of the equipment in the practical experimental measurement. The seismic responses of three towers are approximately symmetric under horizontal earthquake excitations.
Fig.5
Three types of multi-support excitations (unit: cm)
Table 2
Comparison of acceleration responses of the towers between test and FEA (unit: m/s2)
| Location |
EC wave of 1.0 m/s2 (Case 1)
|
WC wave of 1.0 m/s2 (Case 2)
|
Longitudinal
|
Transverse
|
Longitudinal
|
Transverse
|
| Test |
FEA |
Error |
Test |
FEA |
Error |
Test |
FEA |
Error |
Test |
FEA |
Error |
| L1 |
4.050 |
4.285 |
5.49% |
2.957 |
3.044 |
2.87% |
5.515 |
5.631 |
2.06% |
4.345 |
4.416 |
1.60% |
| L2 |
2.565 |
2.684 |
4.44% |
1.905 |
1.911 |
0.31% |
3.667 |
3.788 |
3.21% |
2.381 |
2.523 |
5.60% |
| M1 |
5.125 |
5.266 |
2.68% |
3.629 |
3.786 |
4.16% |
6.333 |
6.589 |
3.89% |
4.856 |
4.946 |
1.83% |
| M2 |
3.202 |
3.158 |
−1.39% |
2.129 |
2.145 |
0.75% |
4.195 |
4.192 |
−0.07% |
2.587 |
2.702 |
4.27% |
| R1 |
4.315 |
4.406 |
2.06% |
3.184 |
3.291 |
3.24% |
5.321 |
5.593 |
4.88% |
4.274 |
4.398 |
2.83% |
| R2 |
2.560 |
2.634 |
2.81% |
1.917 |
1.911 |
−0.29% |
3.613 |
3.726 |
3.05% |
2.421 |
2.485 |
2.60% |
|
| Location |
JX wave of 1.0 m/s2 (Case 3)
|
HK wave of 1.0 m/s2 (Case 4)
|
Longitudinal
|
Transverse
|
Longitudinal
|
Transverse
|
| Test |
FEA |
Error |
Test |
FEA |
Error |
Test |
FEA |
Error |
Test |
FEA |
Error |
|
| L1 |
6.875 |
6.892 |
0.24% |
5.072 |
5.193 |
2.32% |
6.048 |
6.158 |
1.78% |
4.648 |
4.678 |
0.65% |
| L2 |
4.615 |
4.885 |
5.52% |
3.562 |
3.175 |
−12.18% |
4.143 |
4.260 |
2.75% |
2.789 |
2.900 |
3.83% |
| M1 |
7.926 |
8.052 |
1.57% |
6.126 |
6.267 |
2.25% |
7.082 |
7.283 |
2.76% |
5.639 |
5.652 |
0.23% |
| M2 |
5.035 |
5.152 |
2.26% |
3.108 |
3.160 |
1.65% |
4.619 |
4.691 |
1.53% |
2.731 |
2.933 |
6.91% |
| R1 |
6.766 |
6.842 |
1.12% |
5.255 |
5.323 |
1.29% |
6.071 |
6.183 |
1.81% |
4.653 |
4.737 |
1.77% |
| R2 |
4.768 |
4.847 |
1.64% |
3.084 |
3.172 |
2.78% |
4.216 |
4.241 |
0.57% |
2.777 |
2.893 |
4.03% |
|
| Location |
EC wave of 1232 m/s (Case 5)
|
EC wave of 616 m/s (Case 6)
|
Longitudinal
|
Transverse
|
Longitudinal
|
Transverse
|
| Test |
FEA |
Error |
Test |
FEA |
Error |
Test |
FEA |
Error |
Test |
FEA |
Error |
|
| L1 |
15.424 |
15.840 |
2.62% |
10.960 |
11.329 |
3.25% |
9.426 |
9.504 |
0.82% |
6.698 |
6.865 |
2.43% |
| L2 |
9.250 |
9.363 |
1.21% |
6.688 |
6.773 |
1.25% |
5.905 |
6.081 |
2.90% |
4.204 |
4.289 |
1.98% |
| M1 |
18.578 |
18.749 |
0.92% |
13.231 |
13.401 |
1.27% |
11.585 |
12.006 |
3.50% |
8.330 |
8.506 |
2.07% |
| M2 |
11.137 |
11.294 |
1.39% |
7.721 |
7.860 |
1.76% |
6.947 |
7.068 |
1.71% |
4.719 |
4.805 |
1.81% |
| R1 |
15.786 |
15.885 |
0.62% |
11.847 |
12.541 |
5.54% |
9.369 |
9.531 |
1.70% |
7.240 |
7.437 |
2.65% |
| R2 |
9.482 |
9.773 |
2.98% |
6.880 |
7.104 |
3.15% |
5.794 |
5.864 |
1.18% |
4.204 |
4.317 |
2.61% |
|
| Location |
EC wave of 308 m/s (Case 7)
|
EC wave of 2.0 m/s2 (Case 8)
|
Longitudinal
|
Transverse
|
Longitudinal
|
Transverse
|
| Test |
FEA |
Error |
Test |
FEA |
Error |
Test |
FEA |
Error |
Test |
FEA |
Error |
|
| L1 |
7.284 |
7.503 |
2.92% |
5.176 |
5.532 |
6.44% |
7.532 |
7.658 |
1.64% |
5.461 |
5.579 |
2.12% |
| L2 |
4.563 |
5.100 |
10.54% |
3.249 |
3.542 |
8.27% |
5.037 |
5.156 |
2.32% |
3.582 |
3.718 |
3.65% |
| M1 |
8.952 |
9.841 |
9.03% |
6.437 |
6.669 |
3.48% |
10.053 |
10.187 |
1.32% |
6.757 |
7.061 |
4.31% |
| M2 |
5.368 |
6.227 |
13.79% |
3.646 |
4.029 |
9.51% |
6.316 |
6.405 |
1.39% |
4.029 |
4.116 |
2.12% |
| R1 |
7.490 |
8.410 |
10.93% |
5.594 |
6.150 |
9.04% |
8.412 |
8.563 |
1.77% |
6.258 |
6.497 |
3.67% |
| R2 |
4.477 |
5.082 |
11.89% |
3.249 |
3.563 |
8.81% |
5.068 |
5.208 |
2.70% |
3.522 |
3.648 |
3.46% |
|
| Location |
EC wave of 3.0 m/s2 (Case 9)
|
EC wave of 4.0 m/s2 (Case 10)
|
Longitudinal
|
Transverse
|
Longitudinal
|
Transverse
|
| Test |
FEA |
Error |
Test |
FEA |
Error |
Test |
FEA |
Error |
Test |
FEA |
Error |
|
| L1 |
11.911 |
12.055 |
1.20% |
8.591 |
8.690 |
1.13% |
16.296 |
16.385 |
0.54% |
11.218 |
11.694 |
4.07% |
| L2 |
7.381 |
7.553 |
2.28% |
5.073 |
5.261 |
3.56% |
9.736 |
9.856 |
1.22% |
5.876 |
7.018 |
16.27% |
| M1 |
15.080 |
15.203 |
0.81% |
10.359 |
10.484 |
1.19% |
19.064 |
19.997 |
4.67% |
13.815 |
14.046 |
1.64% |
| M2 |
8.736 |
8.886 |
1.69% |
6.345 |
6.485 |
2.16% |
12.362 |
12.540 |
1.42% |
8.379 |
8.531 |
1.78% |
| R1 |
12.222 |
12.325 |
0.84% |
9.287 |
9.538 |
2.63% |
16.624 |
16.865 |
1.43% |
12.163 |
12.695 |
4.19% |
| R2 |
7.714 |
7.883 |
2.15% |
5.373 |
5.500 |
2.31% |
10.254 |
10.410 |
1.50% |
7.364 |
7.418 |
0.72% |
L1, M1, R1: acceleration responses at the top of the left tower, the middle tower, and the right tower; L2, M2, R2: acceleration responses at the lower cross beam of the left tower, the middle tower, and the right tower
The time-history curves at the middle span of the main girder are described in Fig.
6 (p.412). It can be seen that the response tendencies of the FE analysis are consistent with those from the shaking table tests (Zong et al.,
2014). The seismic responses in the vertical direction are larger than those in the transversal direction. From these comparisons, it can be concluded that the single girder FE model can be used to predict the seismic responses of the multi-span cable-stayed bridge during uniform excitations and non-uniform excitations.
Fig.6
Acceleration responses comparison of deck
(a), (c), (e), and (g): vertical comparison under Case 1, 3, 7, and 10; (b), (d), (f), and (h): transverse comparison under Case 1, 3, 7, and 10
5. Seismic response analysis of the single girder model
5.1. Displacement responses
The longitudinal displacement at the top of the tower, the displacement at the end of the main girder, the relative displacement between the tower and the main girder, and the vertical displacement of the mid-span of the main span in the scale model were calculated under uniform excitations. The peak value of the displacement responses are presented (Table
3). It can be seen that the displacement responses at the top of the three towers are different and the D2 value is the largest (exceed 10 mm), because there is no auxiliary pier and anchor cable in the two middle spans, leading to the lack of effective assistance from the stiffness of the main girder and cables. Therefore, some measures should be adopted to improve the stiffness of the middle tower to control the larger deformation of the middle tower in the three-tower cable-stayed bridge as much as possible. Due to the restriction of the bearing, the displacement response of D6 is smaller than other displacement responses for the same case. Note that the vertical displacement at the mid-span of the main span cannot be ignored during horizontal earthquake excitations.
Table 3
Displacement responses of the scale model under uniform excitations (unit: mm)
| Case |
Displacement response
|
| D1 |
D2 |
D3 |
D4 |
D5 |
D6 |
D7 |
D8 |
D9 |
D10 |
| 1 |
6.6 |
7.6 |
6.5 |
2.4 |
2.2 |
2.2 |
2.2 |
2.3 |
5.6 |
5.9 |
| 2 |
7.0 |
10.9 |
7.1 |
3.1 |
2.8 |
2.9 |
2.8 |
3.1 |
7.4 |
7.6 |
| 3 |
8.0 |
12.4 |
7.8 |
4.1 |
3.8 |
3.9 |
3.8 |
4.2 |
10.0 |
10.2 |
| 4 |
7.6 |
11.5 |
7.4 |
3.6 |
3.3 |
3.4 |
3.3 |
3.5 |
8.3 |
8.5 |
D1, D2, D3: top displacements of the left tower, the middle tower, and the right tower; D4, D8: left and right end displacements of the main girder; D5, D6, D7: relative displacements between the main girder and the left tower, between the main girder and the middle tower, and between the main girder and the right tower; D9, D10: vertical displacements of the left mid-span and the right mid-span
Meanwhile, the influence of the traveling wave on the displacement responses of the deck and tower should not be ignored in the seismic design of the floating system cable-stayed bridge. Three different apparent wave velocities of the EC wave, which were 308 m/s, 616 m/s, and 1232 m/s, respectively, were selected to calculate the displacement response ratios among the non-uniform excitations and the corresponding uniform excitations. The longitudinal and vertical displacement ratios of the main girder at mid-span are described (Fig.
7).
Fig.7
Displacement response ratios of the scale model under non-uniform excitations: (a) vertical displacement ratios; (b) longitudinal displacement ratios
Fig.
7 indicates that all the vertical displacement ratios of the main spans are larger than 1.0 while all the longitudinal ratios of the scale model are smaller than 1.0 no matter how much the apparent wave velocity is. In other words, the vertical displacement of the main girder increases while the longitudinal displacement at the top of the tower and at the end of the deck decreases after considering the traveling wave effects. The displacement responses become larger as the apparent wave velocity increases, especially for the prominent amplification of 1232 m/s. Among the displacement response ratios at the top of the three towers, the variation of the middle tower is the smallest, and the variation of the left tower is the largest. The similar phenomenon is also occurring in the relative displacement between the tower and deck. Therefore, the influence of the apparent wave velocity on the displacement of the side tower where the earthquake wave arrives first is the largest, and the impact on the middle tower is the smallest for the three-tower cable-stayed bridge.
5.2. Bending moment responses
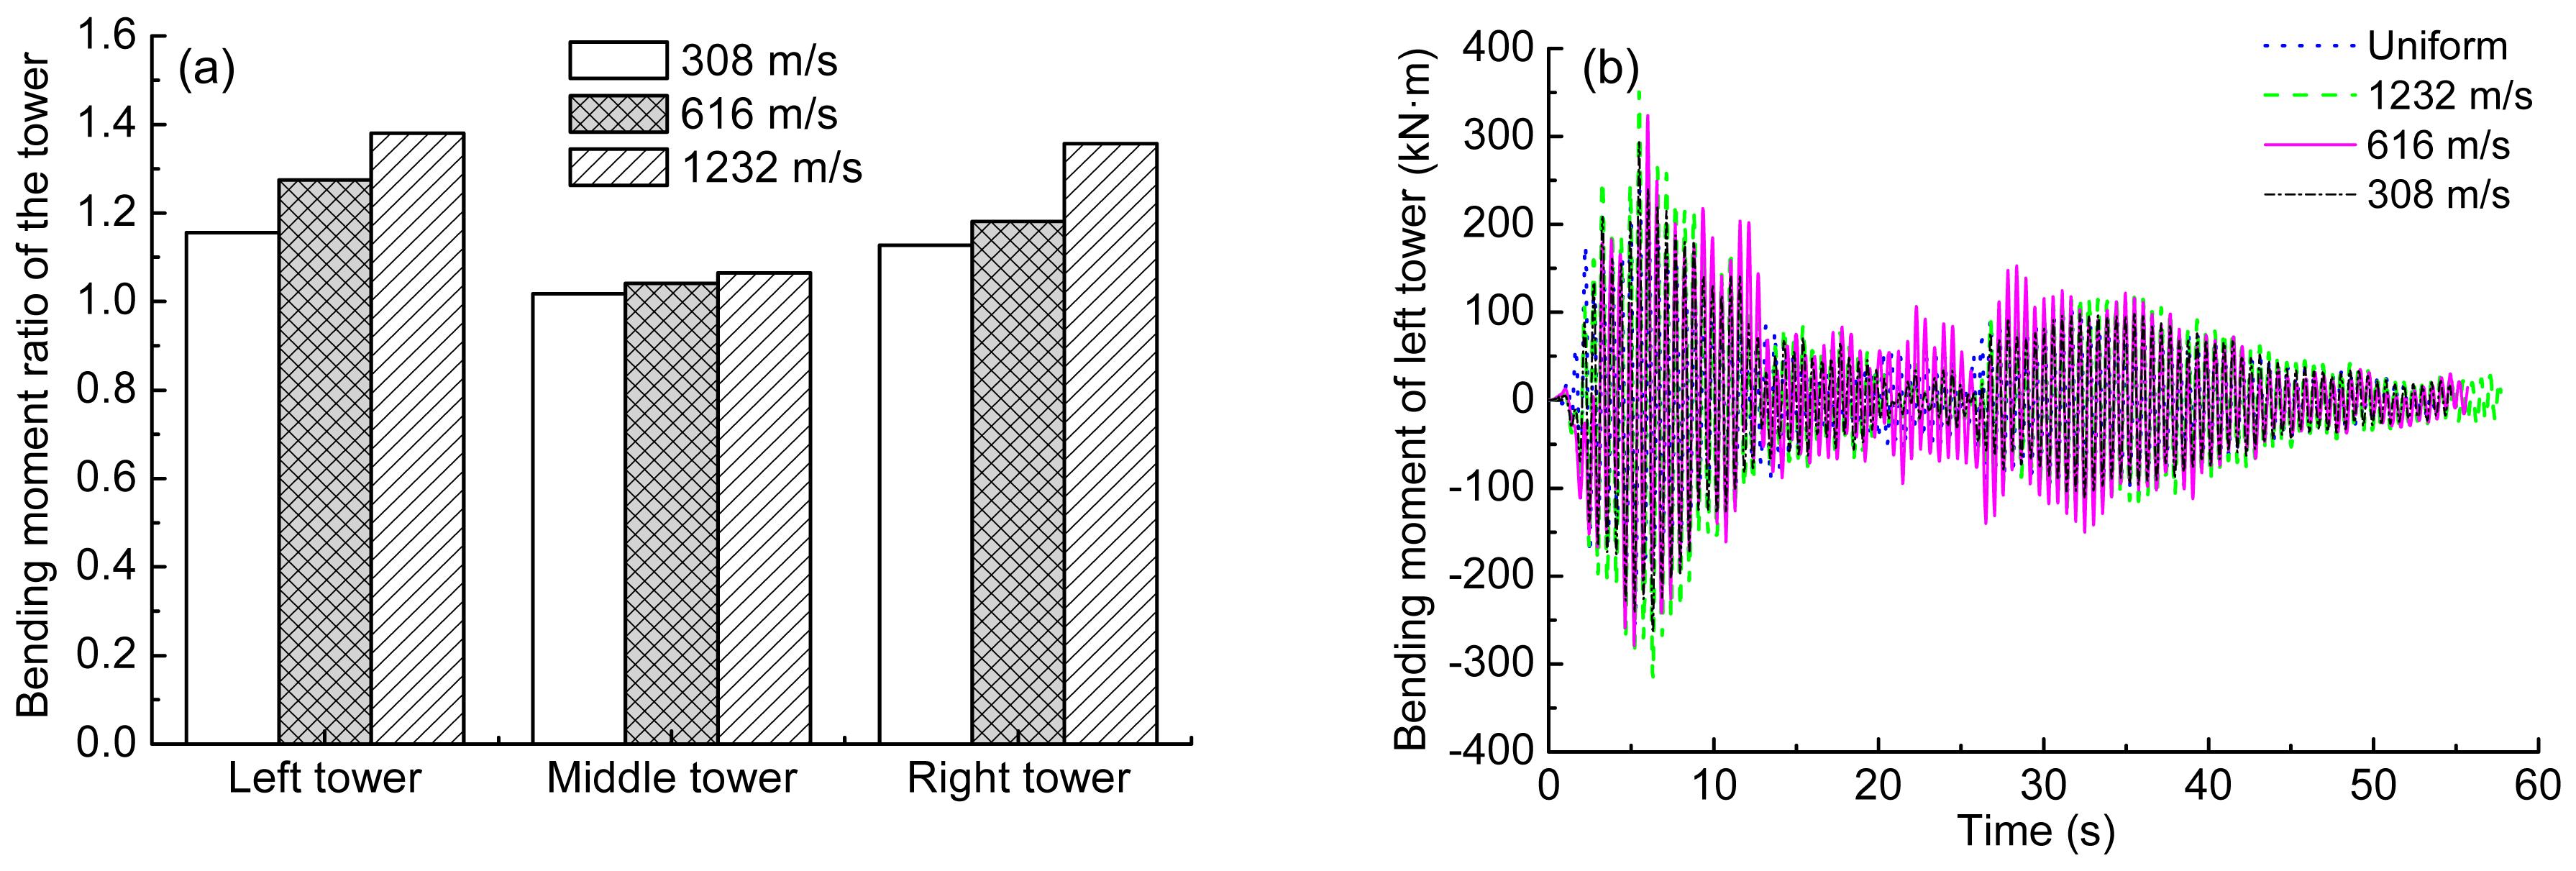
Since internal forces at the bottom of the tower vary widely for different structural systems of cable-stayed bridges, the bending moments of the tower and pier were analyzed for the scale model. The detailed bending moments under four uniform excitations are recorded (Table
4), and the ratios of the three towers as well as the time history curves at the bottom of the left tower under non-uniform excitations are described (Fig.
8).
Table 4
Bending moment responses under uniform excitations (unit: kN·m)
| Case |
Bending moment response
|
| Left pier |
Left tower |
Middle tower |
Right tower |
Right pier |
| 1 |
33.72 |
248.15 |
350.12 |
254.49 |
23.20 |
| 2 |
46.24 |
330.78 |
454.86 |
324.77 |
32.77 |
| 3 |
50.16 |
439.17 |
616.81 |
444.27 |
70.89 |
| 4 |
48.09 |
364.77 |
521.48 |
377.03 |
44.08 |
Fig.8
Bending moment responses at the bottom of towers under non-uniform excitations: (a) bending moment ratios of three towers; (b) bending moment time history of left tower
Table
4 shows that the bending moment responses of the side piers are smaller than those of the towers and the values of the middle tower are the largest among those of the three towers under four uniform excitations. However, the bending moment increment of the left tower is the largest among those of the three towers and the variation of the middle tower is the smallest during non-uniform excitations (Fig.
8). In addition, the bending moment ratios of all the towers become larger as the apparent wave velocity increases. Therefore, the traveling wave effect has an adverse impact on the internal force of the towers. The influence on the side tower where the earthquake wave arrives first is also the largest, and that on the middle tower is also the smallest for the three-tower cable-stayed bridge.
6. Collapse and failure analysis
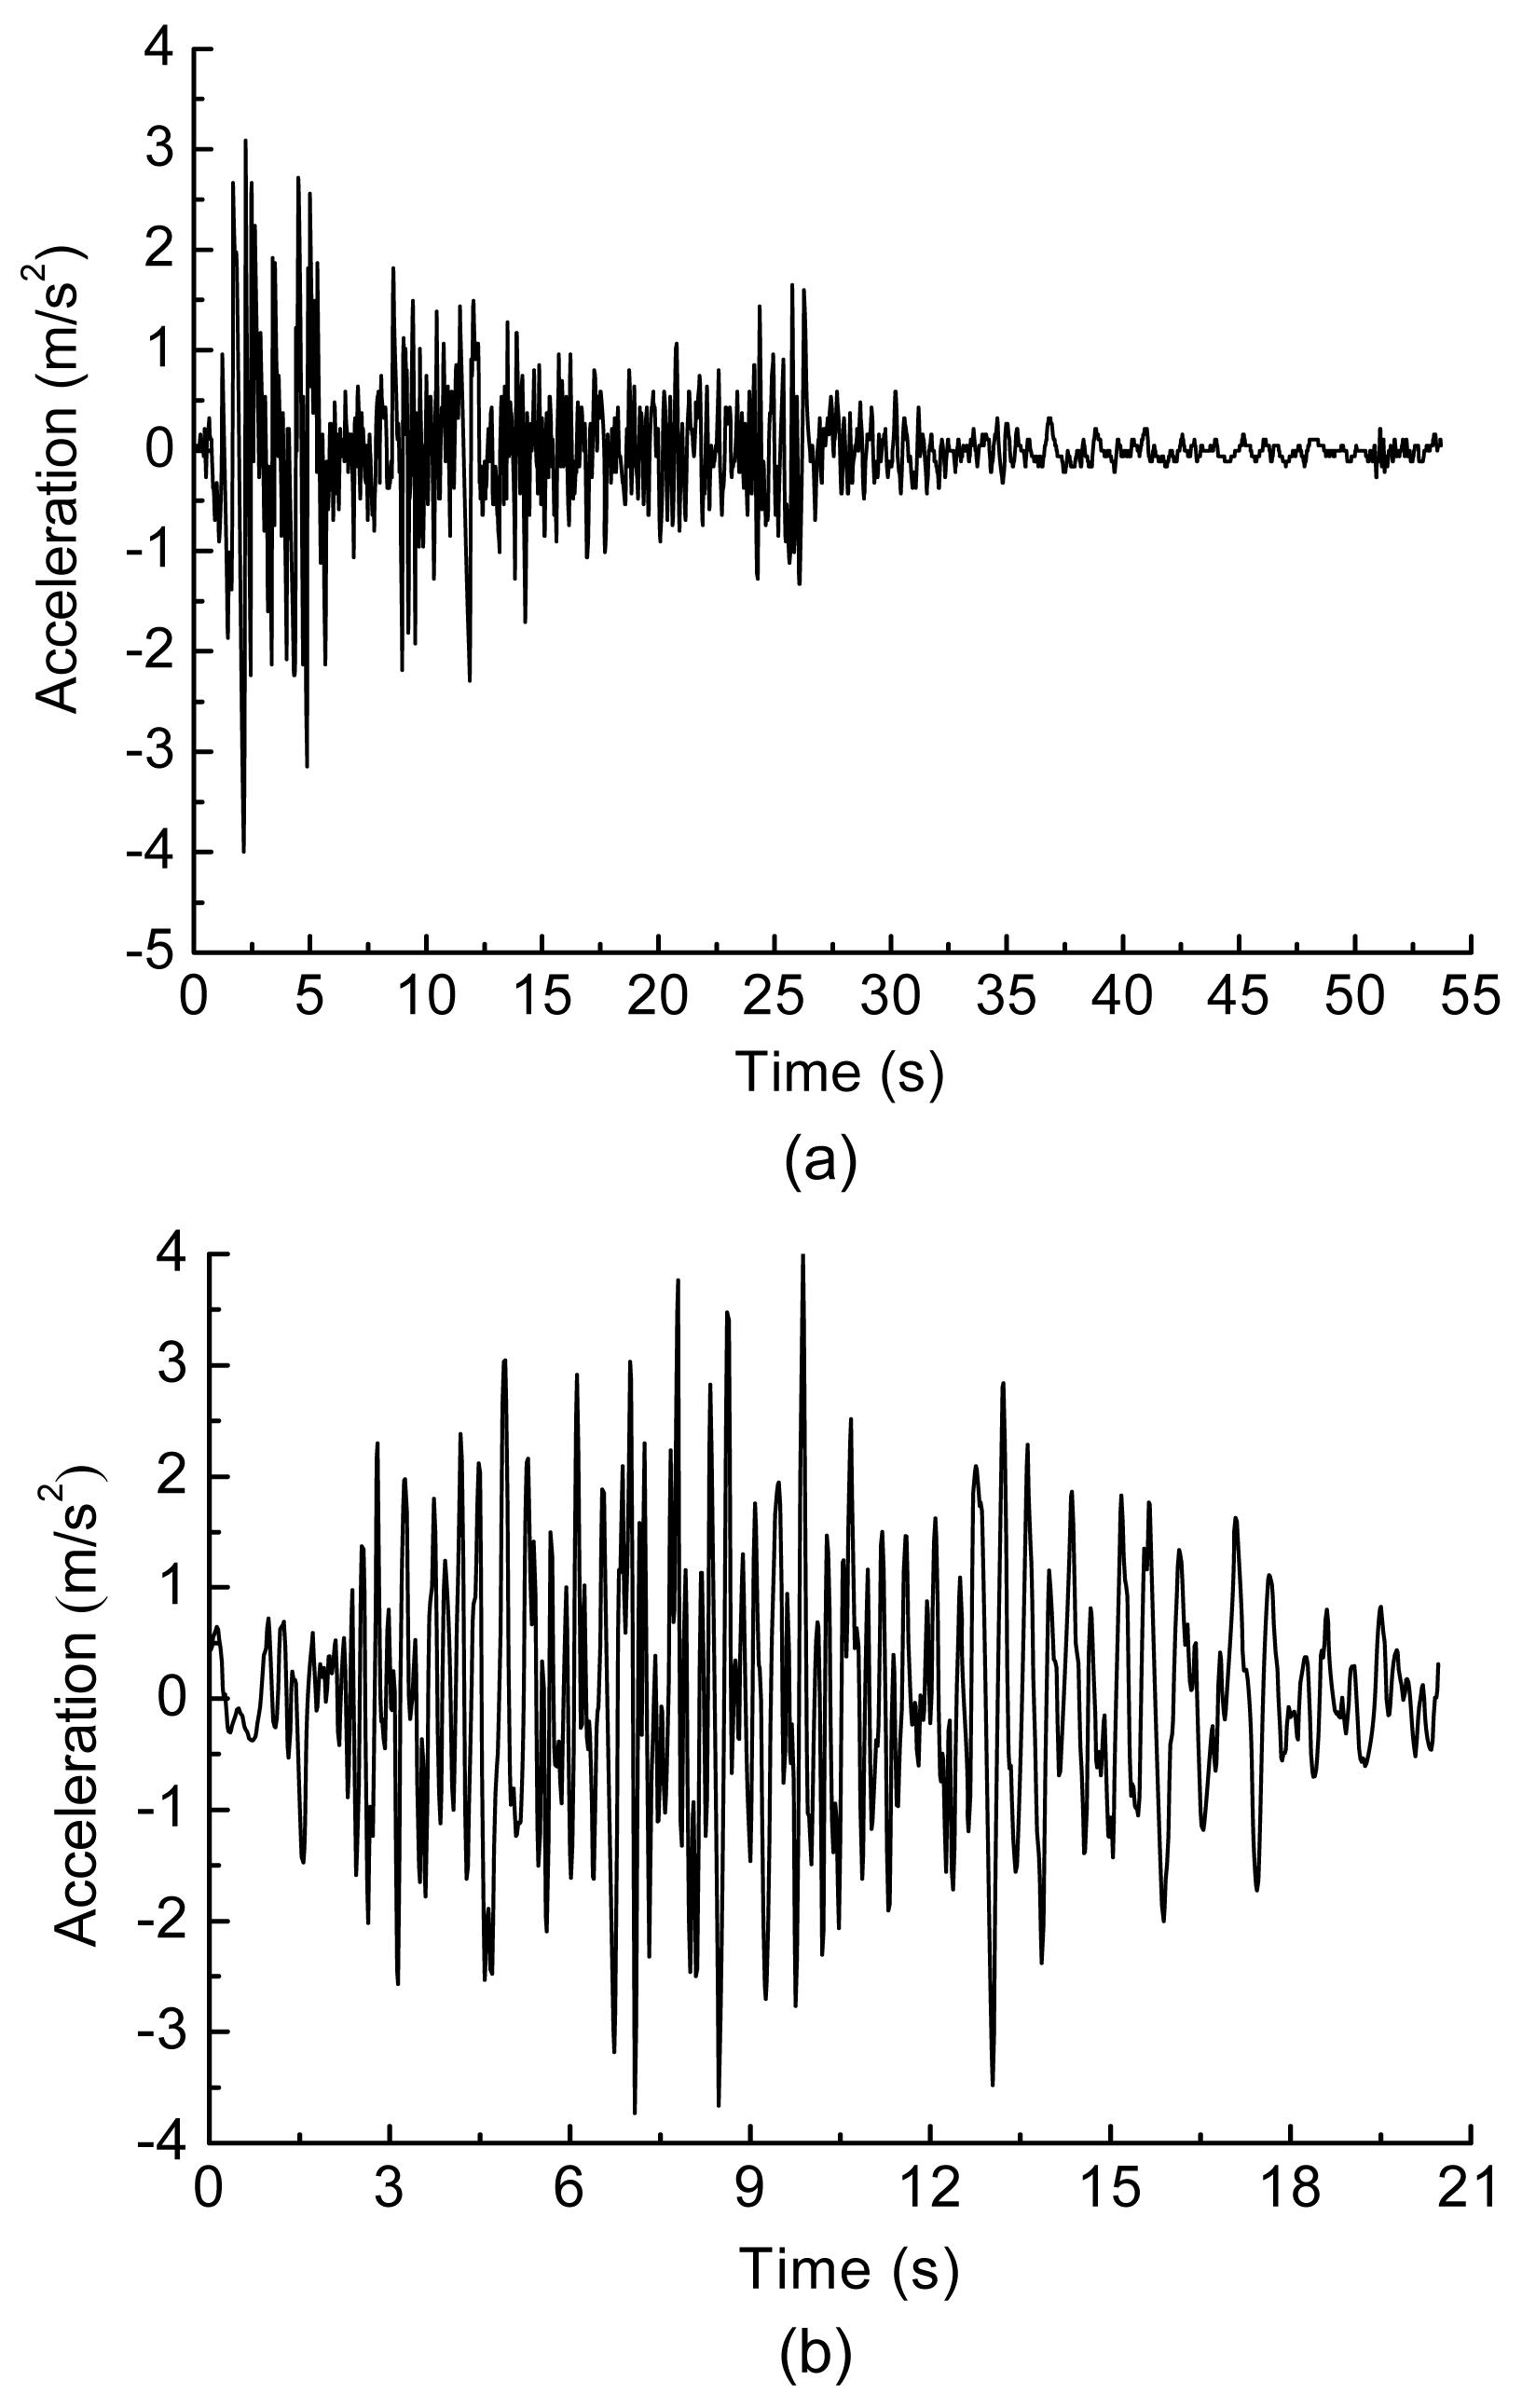
The explicit dynamic model established in LS-DYNA was also an FE model, which was similar to the above single girder model in ANSYS without the modal validation. Due to space limitation, only part of the numerical simulation analysis about the collapse and failure mode of the scale model during only two different seismic excitations were reported and the corresponding discussions were given in this study. To explore the failure mode of the scale model during strong earthquakes and to demonstrate the collapse process of the components, two earthquake waves of the JX wave and EC wave with the acceleration peak value of 4.0 m/s
2 were selected as the bi-direction input excitations in the numerical simulation. The time history curves of the two waves are described (Fig.
9).
Fig.9
Time history curves of two input excitations: (a) EC wave; (b) JX wave
6.1. Failure mode of the scale model under the EC wave
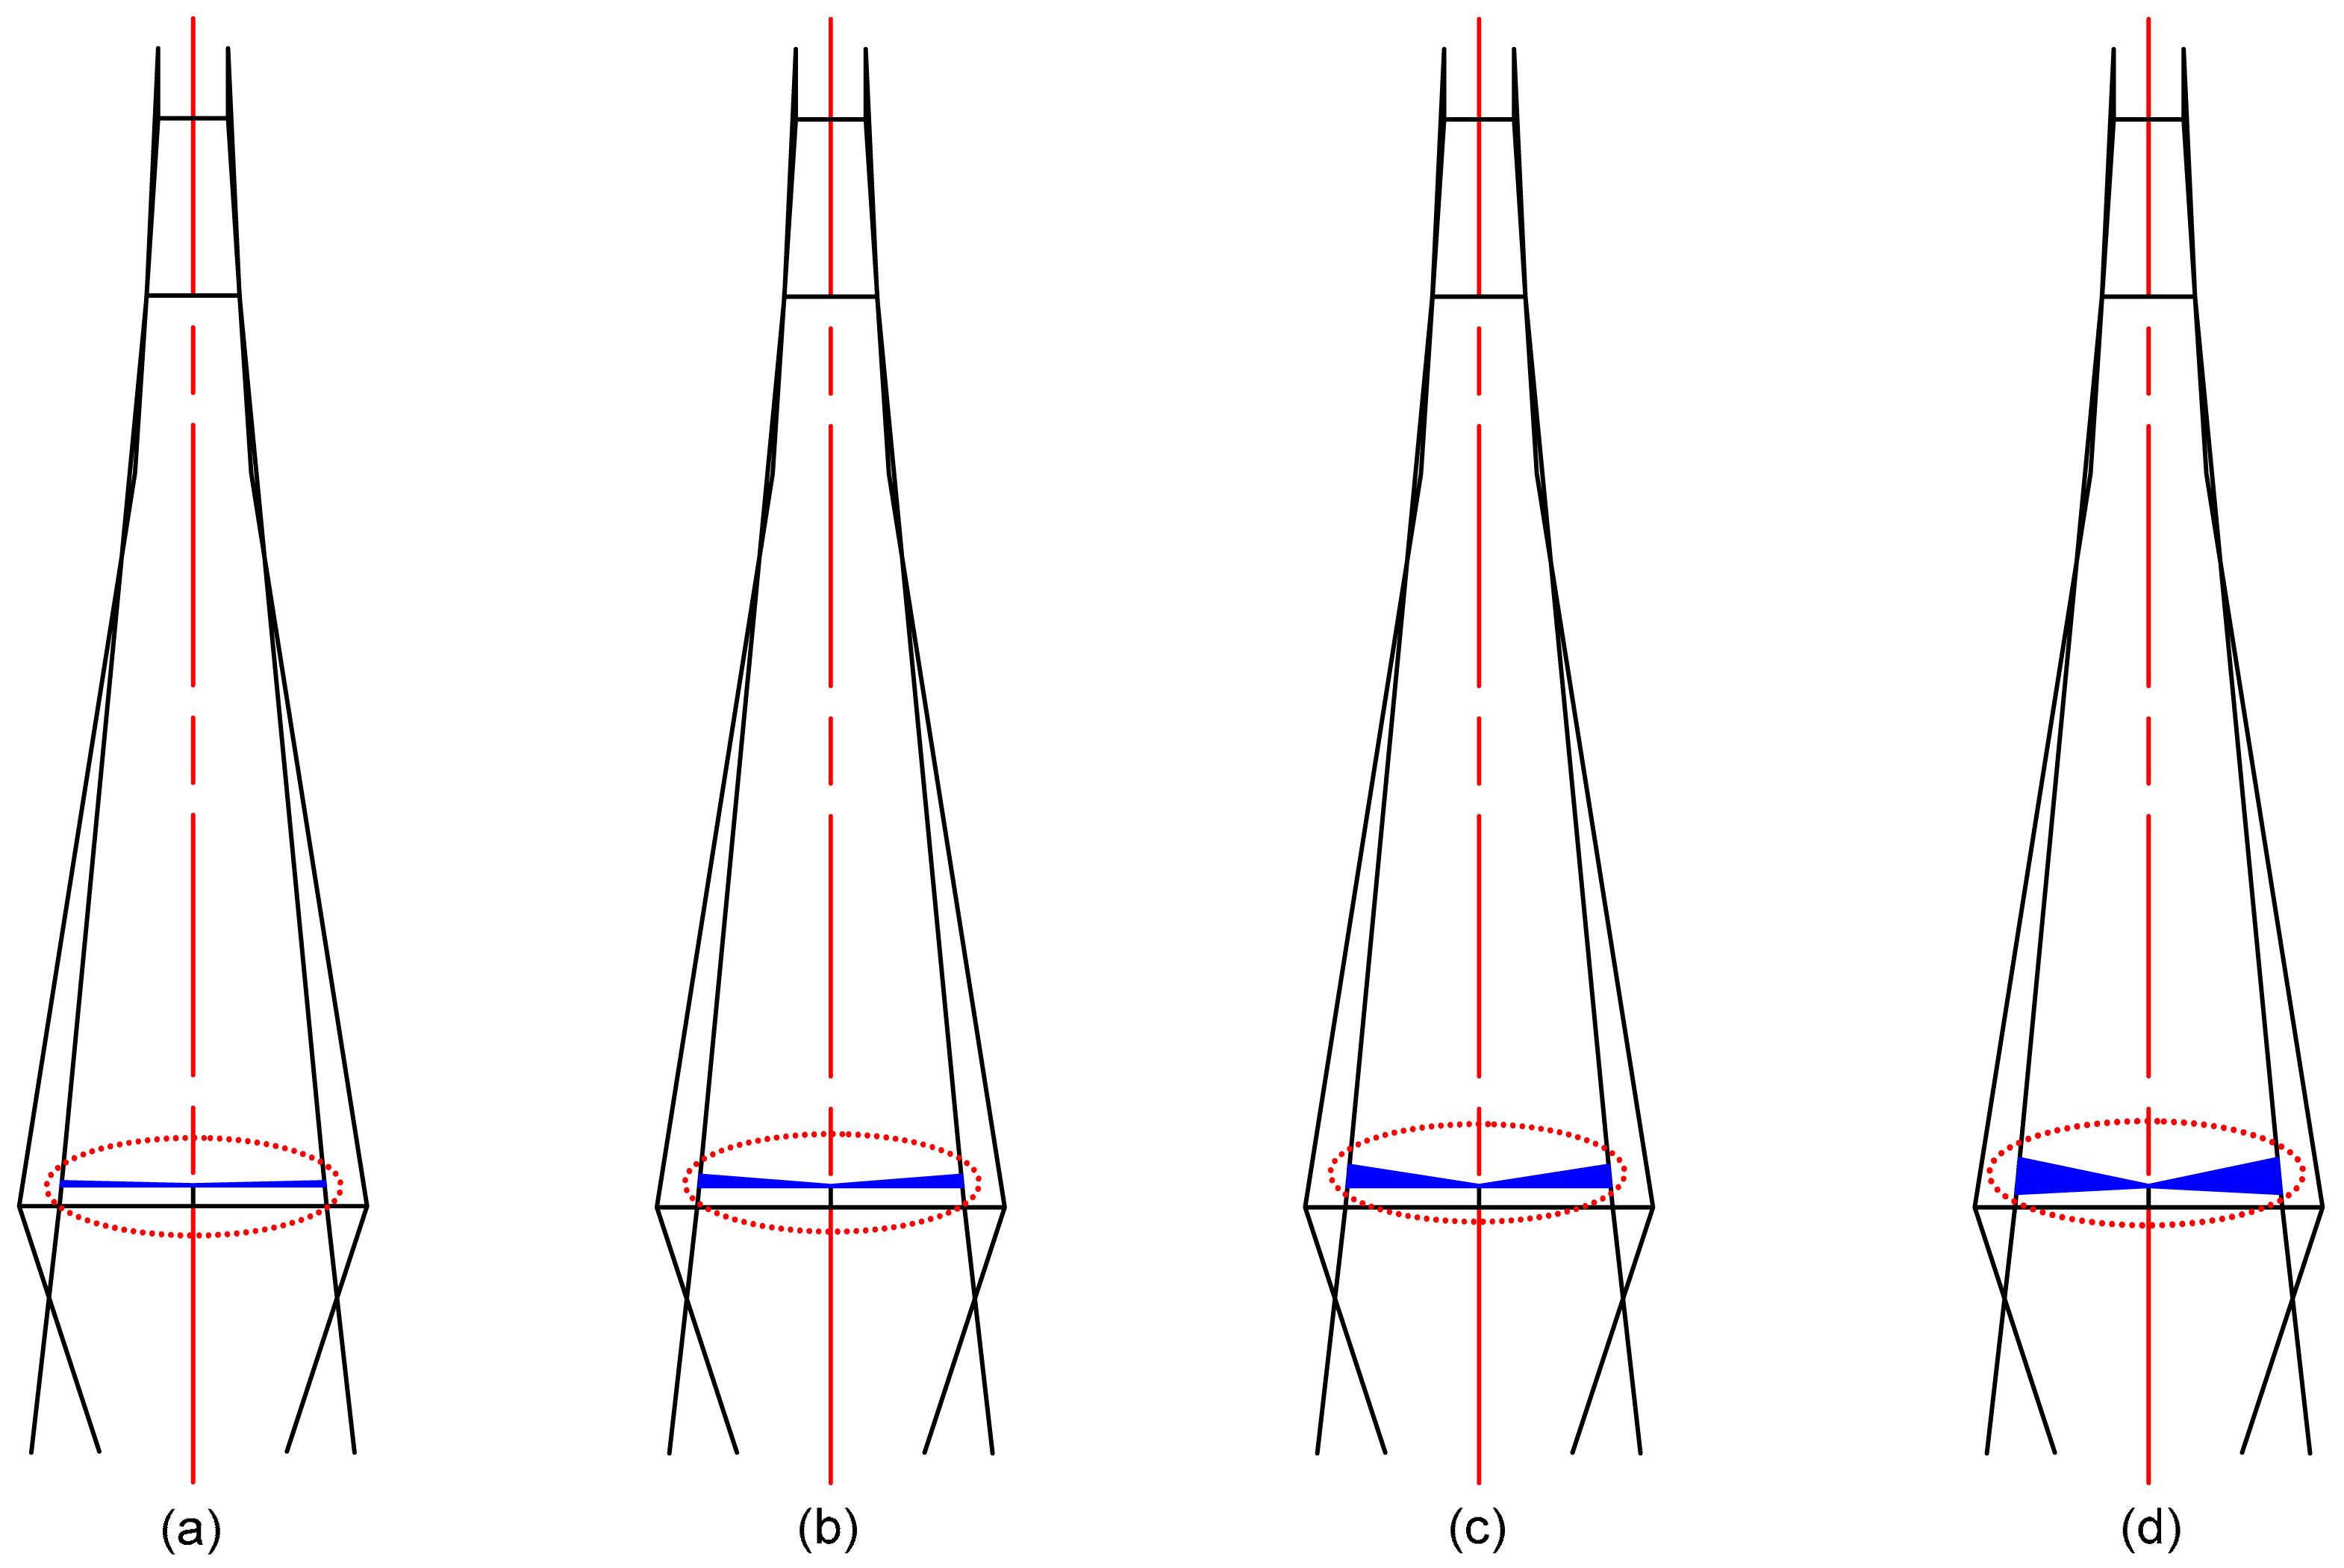
The whole process of the components failure of the scale model can be demonstrated in an animation form using the software of LS-PREPOST and the failure conditions at several key times during the EC wave excitation are displayed (Fig.
10). The failure process indicated that the slight vibrations of the cable can be visible at 2.2 s which was the moment for the EC wave with the peak value, at the same time, which can also arouse the small horizontal displacement of the towers. However, the vibration effect can be reduced when the earthquake was passing away. The vertical vibration of the main girder aggravated and the torsion phenomenon of the cables emerged at 53.7 s. During the whole action process, no obvious vibration of the towers occurred. The bearing springs of the middle tower were stretched sharply at 20.5 s, according to the profile chart, and the failure state of the bearing was assumed to occur at this time. This kind of phenomenon was consistent with the shaking table test results (Zong et al.,
2014).
Fig.10
Failure mode of the scale model under the EC wave
(a) 0 s; (b) 2.2 s (peak value point): slight vibration of the cables; (c) 20.5 s: failure of the bearing at the middle tower; (d) 53.7 s: torsional vibration of the cables
6.2. Failure mode of the scale model under the JX wave
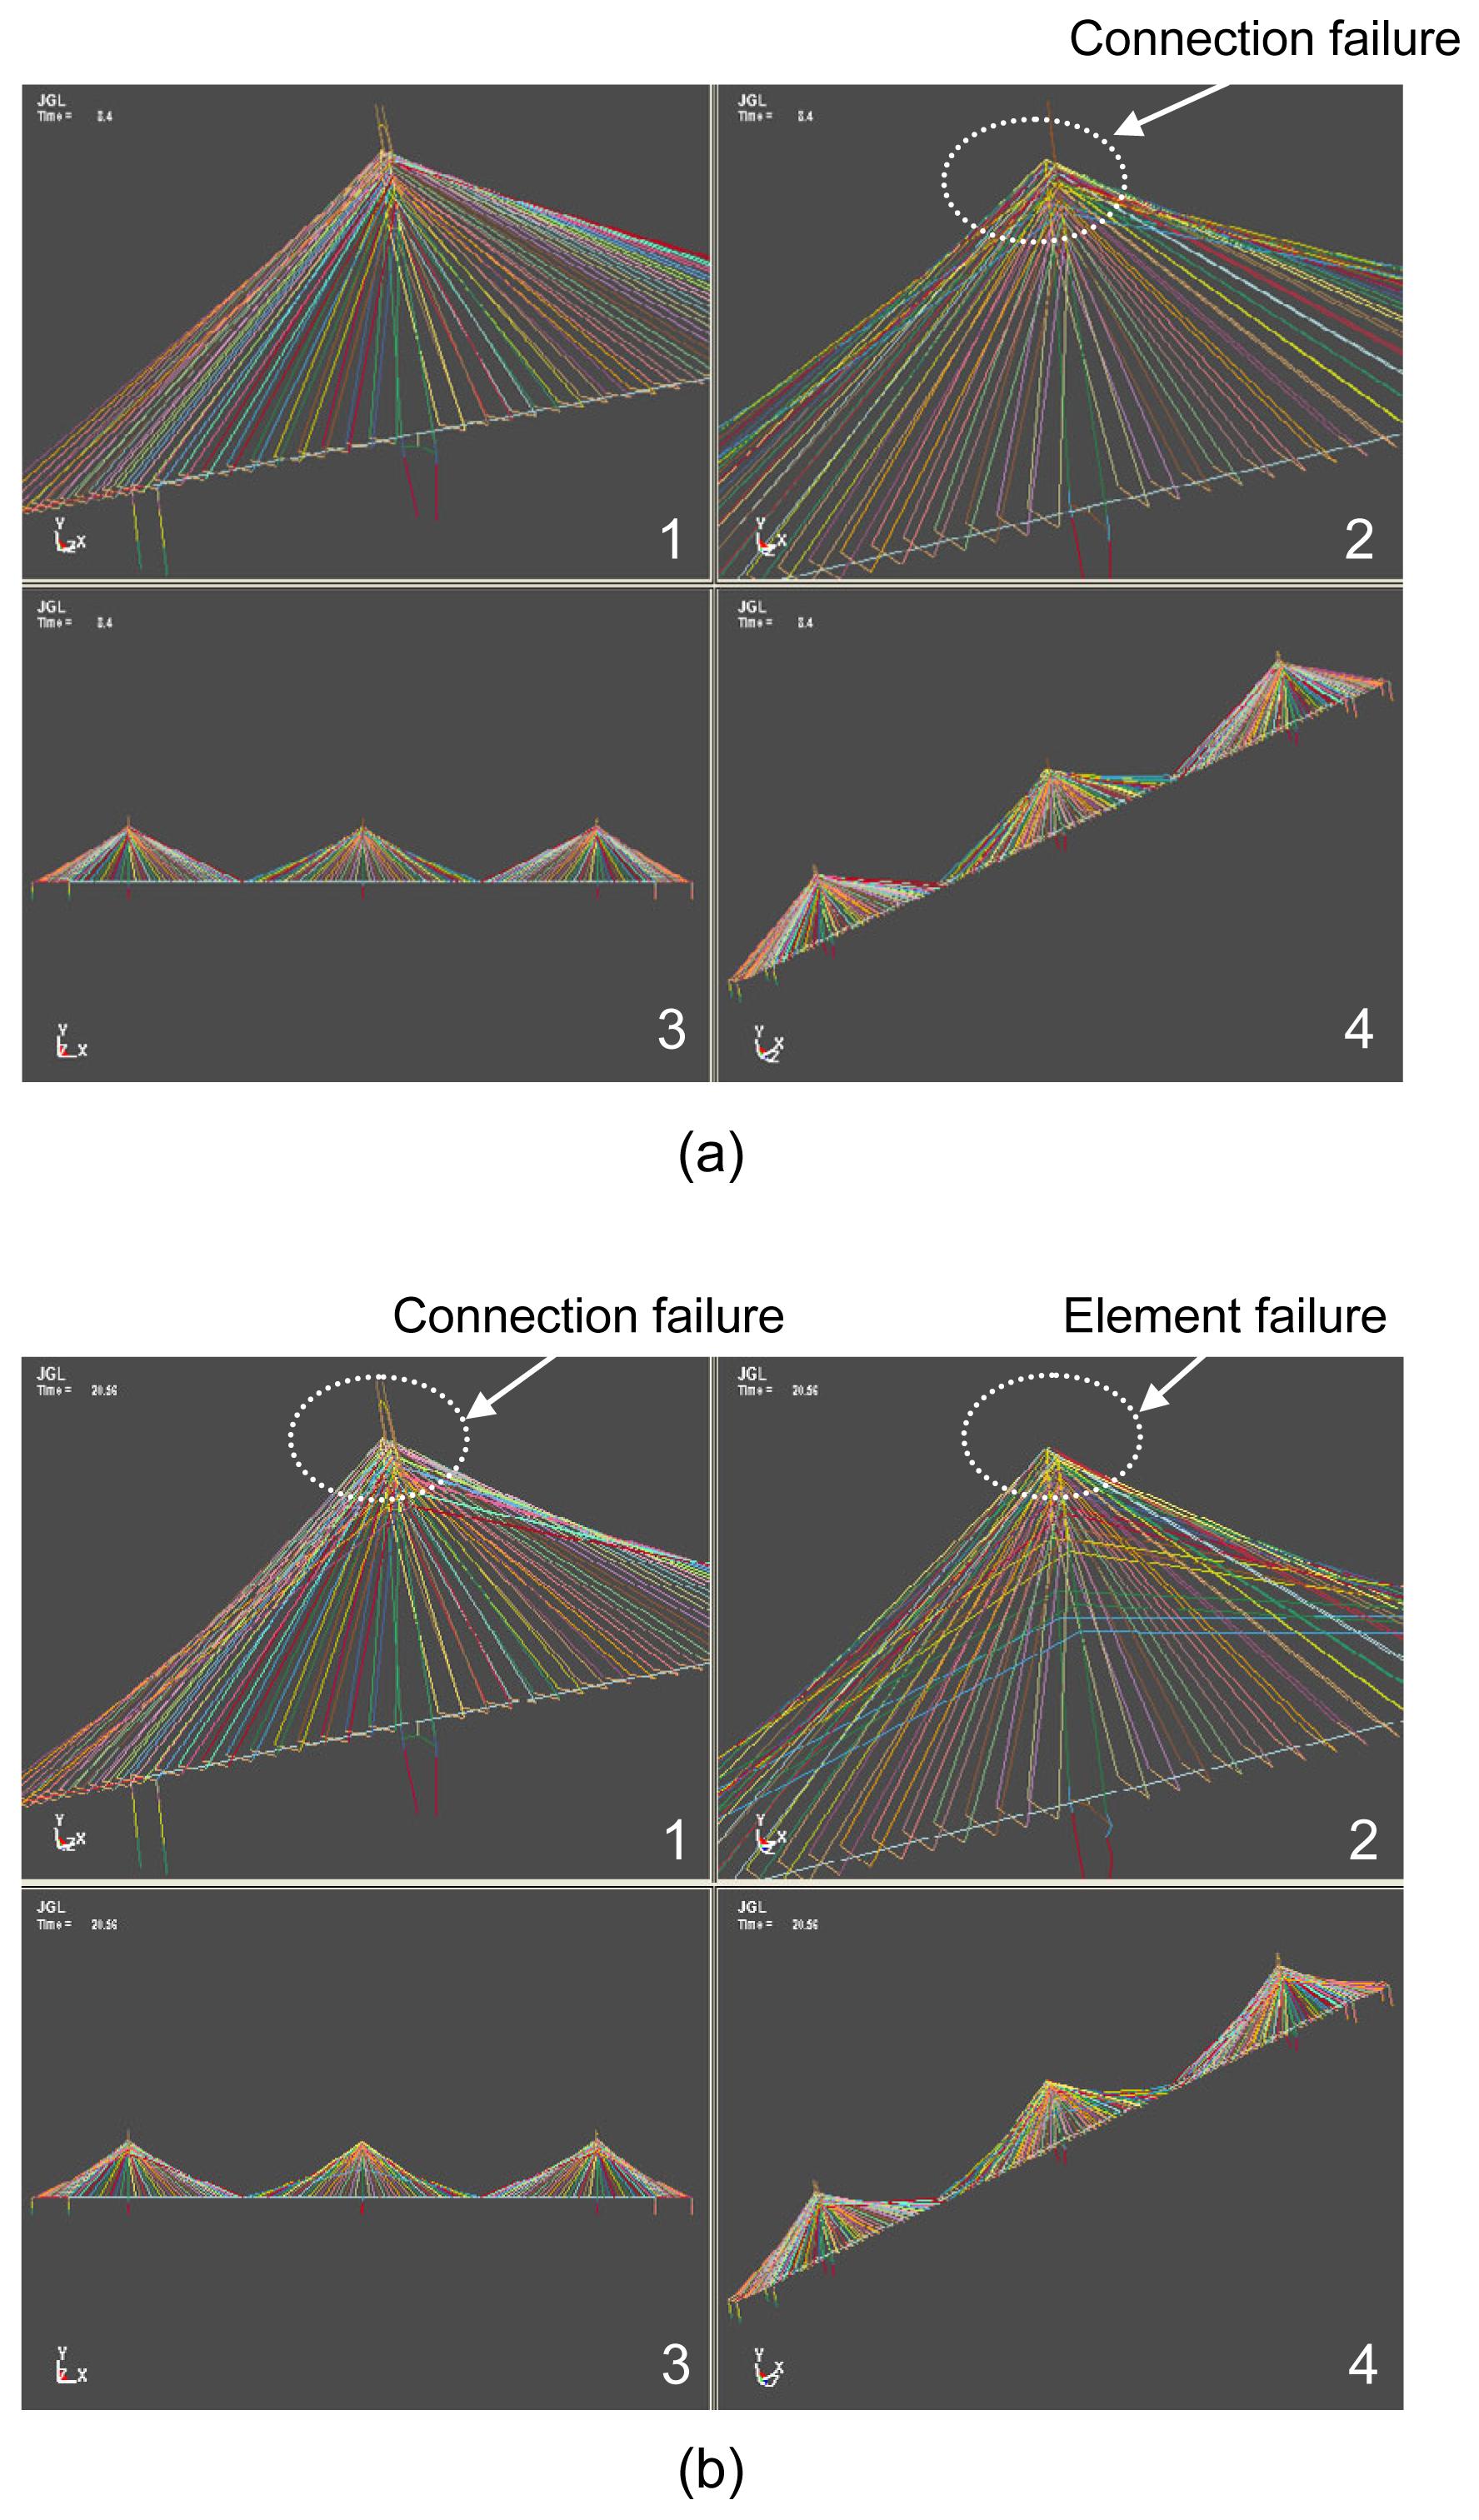
Considering that the seismic response of the scale model under the JX wave among the four wave excitations was the largest, the whole process for the components failure of the scale model under the JX wave was also simulated. The failure conditions of several key times are presented (Fig.
11), and two typical failure modes for the scale model under the JX wave with the LS-DYNA are shown (Fig.
12).
Fig.11
Failure mode of the scale model under the JX wave
(a) 0 s; (b) 0.8 s: vibration of the cables; (c) 2.2 s: connection failure of the cables and middle tower; (d) 8.4 s (peak value point): element failure of the inner upper column of the middle tower; (e) 19.7 s: connection failure of all the cables and middle tower, and all element failure of the upper column of the middle tower; (f) 20.5 s: connection failure of all the cables and three upper towers, and all element failure of the upper column and cross beam of the middle tower
Fig.12
Two typical states of the scale model under the JX wave: (a) destruction state at the time of 8.4 s; (b) destruction state at the time of 20.5 s
1: enlarged view of side tower; 2: enlarged view of middle tower; 3: elevation; 4: panoramagram
These results showed that the small deformation of the bearing spring elements between the middle tower and the main girder had occurred and the slight visible vibrations of the cables appeared at the time of 0.8 s, and then the deformation of the bearing developed and the vibration of the cables gradually increased. The cable at the highest point of the upper tower column of the middle tower was separated from the tower and fell down, and then the connection failure of the stay cables in the upper tower column were gradually coming down, beginning at 2.2 s. The inboard elements and upper cross beam elements in the upper tower column of the middle tower first experienced failure at 8.4 s as the peak value time of the JX wave. The stay cables in the upper tower columns between the side towers and middle tower also started to crack at the same time. When it came to 19.7 s, all the stay cables of the upper tower columns of the middle tower were snapped, and all the outboard elements of the upper column of the middle tower also failed. The connection failure of all the cables and the upper columns of all the three towers, and all the element failures of the upper columns and upper cross beams of the middle tower happened at around 20.5 s. Meanwhile, the fracture deformations of the upper tower column of the side towers appeared, the significant deformation of the low tower column of the middle tower emerged, owing to the large deformation of the low cross beam. The whole structural system collapsed. Note that the failure of the main girder did not take place because of the integral effects between the main girder and the rigid arm.
7. Conclusions
In this paper, seismic responses of a three-tower cable-stayed bridge scale model under multi-support excitations and failure modes during two strong earthquake actions were investigated by using two kinds of nonlinear finite element models, respectively. The main conclusions can be extracted from the simulation and listed as follows:
-
The acceleration response results of the numerical simulation are consistent with those from the shaking table tests (Zong et al., 2014), indicating that the established single girder model can predict the seismic response of the scale model during uniform excitations and non-uniform excitations.
-
The acceleration responses of the scale model under non-uniform excitations become larger as the apparent wave velocity increases; travelling wave effects have adverse impact on the vertical displacement of the main girder and the bending moment at the bottom of the tower, and the effects have beneficial impact on the displacement at the top of the tower and that at the end of the girder. In addition, the influence of the travelling wave on the side tower where the earthquake wave arrives first is the largest and the influence on the middle tower is the smallest.
-
The displacement responses of the middle tower are the most significant in the three towers, due to the lack of effective assistance on the stiffness of the main girder and cables. Therefore, some measures should be adopted to improve the stiffness of the middle tower to control the larger deformation of the middle tower of the three-tower cable-stayed bridge.
-
The constructed explicit dynamic model can predict the failure modes and collapse process of the scale model by using the LS-DYNA. Only the bearing of the middle tower failure occurred under the EC wave excitation of 4.0 m/s2. Under the JX wave excitation of 4.0 m/s2, the connection failure started between the cables and upper columns of all three towers, and then the elements failure occurred in the upper tower column and the upper cross beam in the middle tower. The whole structural system collapsed in the end. This kind of analysis may be referenced as the basis for the collapsed failure control of the cable-stayed bridge with large span during a strong earthquake.
* Project supported by the National Natural Science Foundation of China (Nos. 51178101 and 51378112), the Doctoral Program Project of the Ministry of Education (No. 20110092110011), and the National Key Laboratory of Civil Engineering Disaster Prevention of Tongji University (No. SLDRCE08-HZ-02), ChinaReferences
[1] Abdel-Ghaffar, A.M., Nazmy, A.S., 1991. 3D nonlinear seismic behavior of cable-stayed bridge.
Journal of Structural Engineering, 117(11):3456-3476.

[2] Allam, S.M., Datta, T.K., 1999. Seismic behavior of cable-stayed bridges under multi-component random ground motion.
Engineering Structures, 21(1):62-74.
[3] Bao, L.X., Li, X.Z., Wei, X., 2008. Evaluation of seismic resistance capacity for Yibin Yangtze River Cable-stayed Bridge.
Engineering Mechanics, 25(2):174-182.
[4] Ernst, H.J., 1965. Der e-modul von seilen unter berücksichtigung des durchhanges.
Der Bauingenieur, (in German),40(2):52-55.
[5] Fan, L.C., Wang, J.J., Chen, W., 2001. Response characteristics of long-span cable-stayed bridges under non-uniform seismic action.
China Journal of Computational Mechanics, (in Chinese),18(3):359-364.
[6] Fang, Y., Li, J.Z., Peng, T.B., 2011. Influence of traveling-wave effect on seismic response of a long-span multi-span cable stayed bridge.
Journal of Vibration and Shock, (in Chinese),29(10):148-152.
[7] Gimsing, N.J., Georgakis, C.T., 2011. Cable Supported Bridges: Concept and Design. Wiley,Chichester, UK :150-160.
[8] Li, Z.X., Huang, J., Ding, Y., 2005. Seismic responses of long-span cable-stayed bridges under different patterns of earthquake excitations.
China Journal of Highway and Transport, (in Chinese),18(3):48-53.
[9] Lin, J.Q., Bai, C.X., Chen, Y.S., 2009. Study on the seismic response of cable-stayed bridges with multi-support excitations.
Earthquake Engineering and Engineering Vibration, (in Chinese),29(6):154-161.
[10] LSTC (Livermore Software Technology Corporation), 2006. LS-DYNA (V970) Keyword Users Manual. LSTC,Livermore, USA :
[11] Luo, R., Xu, H.R., Li, H.J., 2010. Collapse simulation analysis of the Baihua bridge during the Wenchuan earthquake.
, The 8th Academic Conference Symposium on the National Earthquake Engineering (I), Chongqing, China, :
[12] Nazmy, A.S., Abdel-Ghaffar, A.M., 1990. Non-linear earth quake-response analysis of long-span cable-stayed bridges: applications.
Earthquake Engineering & Structural Dynamic, 19(1):63-76.
[13] Nazmy, A.S., Abdel-Ghaffar, A.M., 1990. Three-dimensional nonlinear static analysis of cable-stayed bridges.
Computer and Structures, 34(2):257-271.
[14] Nazmy, A.S., Abdel-Ghaffar, A.M., 1992. Effects of ground motion spatial variability on the response of cable-stayed bridges.
Earthquake Engineering & Structural Dynamics, 21(1):1-20.
[15] Okamoto, Y., Nakamura, S., 2011. Static and seismic studies on steel/concrete hybrid towers for multi-span cable-stayed bridges.
Journal of Constructional Steel Research, 67(2):203-210.
[16] Pantaleon, M.J., Ramos, O.R., Ortega, G., 2010. Dynamic analysis of a composite cable-stayed bridge: Escaleritas viaduct.
Journal of Bridge Engineering, 15(6):653-660.
[17] Ren, W.X., Makoto, O., 1999. Elastic-plastic seismic behavior of long span cable-stayed bridges.
Journal of Bridge Engineering, 4(3):194-203.
[18] Ren, W.X., Peng, X.L., Lin, Y.Q., 2005. Experimental and analytical studies on dynamic characteristics of a large span cable-stayed bridge.
Engineering Structures, 27(4):535-548.
[19] Self, S.P., Dilger, W.H., 1990. Nonlinear analysis and collapse load of PC cable-stayed bridge.
Journal of Structural Engineering, 116(3):829-849.
[20] Song, W.K., Kim, S.E., 2007. Analysis of the overall collapse mechanism of cable-stayed bridges with different cable layouts.
Engineering Structures, 29(9):2133-2142.
[21] Wilson, J.C., Gravelle, W., 1991. Modeling of a cable-stayed bridge for dynamic.
Earthquake Engineering & Structural Dynamic, 20(8):707-721.
[22] Yoo, H., Na, H.S., Choi, D.H., 2012. Approximate method for estimation of collapse loads of steel cable-stayed bridges.
Journal of Constructional Steel Research, 72:143-154.
[23] Zavoni, E.H., Vanmarcke, E.H., 1994. Seismic random vibration analysis of multi-support structural system.
Journal of Engineering Mechanics, 120(10):1107-1128.
[24] Zong, Z.H., Zhou, R., Huang, X.Y., 2014. Seismic response study on a multi-span cable-stayed bridge scale model under multi-support excitations. Part I: shaking table tests.
Journal of Zhejiang University-SCIENCE A (Applied Physics & Engineering), 15(5):351-363.


Open peer comments: Debate/Discuss/Question/Opinion
<1>