Xin-biao Xiao, Liang Ling, Jia-yang Xiong, Li Zhou, Xue-song Jin. Study on the safety of operating high-speed railway vehicles subjected to crosswinds[J]. Journal of Zhejiang University Science A, 2014, 15(9): 694-710.
@article{title="Study on the safety of operating high-speed railway vehicles subjected to crosswinds", author="Xin-biao Xiao, Liang Ling, Jia-yang Xiong, Li Zhou, Xue-song Jin", journal="Journal of Zhejiang University Science A", volume="15", number="9", pages="694-710", year="2014", publisher="Zhejiang University Press & Springer", doi="10.1631/jzus.A1400062" }
%0 Journal Article %T Study on the safety of operating high-speed railway vehicles subjected to crosswinds %A Xin-biao Xiao %A Liang Ling %A Jia-yang Xiong %A Li Zhou %A Xue-song Jin %J Journal of Zhejiang University SCIENCE A %V 15 %N 9 %P 694-710 %@ 1673-565X %D 2014 %I Zhejiang University Press & Springer %DOI 10.1631/jzus.A1400062
TY - JOUR T1 - Study on the safety of operating high-speed railway vehicles subjected to crosswinds A1 - Xin-biao Xiao A1 - Liang Ling A1 - Jia-yang Xiong A1 - Li Zhou A1 - Xue-song Jin J0 - Journal of Zhejiang University Science A VL - 15 IS - 9 SP - 694 EP - 710 %@ 1673-565X Y1 - 2014 PB - Zhejiang University Press & Springer ER - DOI - 10.1631/jzus.A1400062
Abstract: A coupled vehicle-track dynamic model is put forward for use in investigating the safety effects of crosswinds on the operation of a high-speed railway vehicle. In this model, the vehicle is modeled as a nonlinear multi-body system, and the ballasted track is modeled as a three-layer discrete elastic support system. The steady aerodynamic forces caused by crosswinds are modeled as ramp-shaped external forces being exerted on the vehicle body. This model was used in a numerical analysis of the dynamic response and dynamic derailment mechanisms of high-speed vehicles subjected to strong crosswinds. The effects of the crosswind speeds, crosswind attack angle, and vehicle speed on the operational safety of the vehicle were examined. The operational safety boundaries of a high-speed vehicle subjected to crosswinds were determined. The numerical results obtained indicate that crosswinds at attack angles of 75° to 90° with respect to the forward direction of the vehicle have a great influence on the safety of operating high-speed railway vehicles. The wheelset unloading limit, which determines the position of the warning boundary dividing the safe operating area and the warning area, is the most conservative, i.e., the safest, criterion to use in assessing the high-speed operational safety of vehicles in crosswinds.
Darkslateblue:Affiliate; Royal Blue:Author; Turquoise:Article
Article Content
1. Introduction
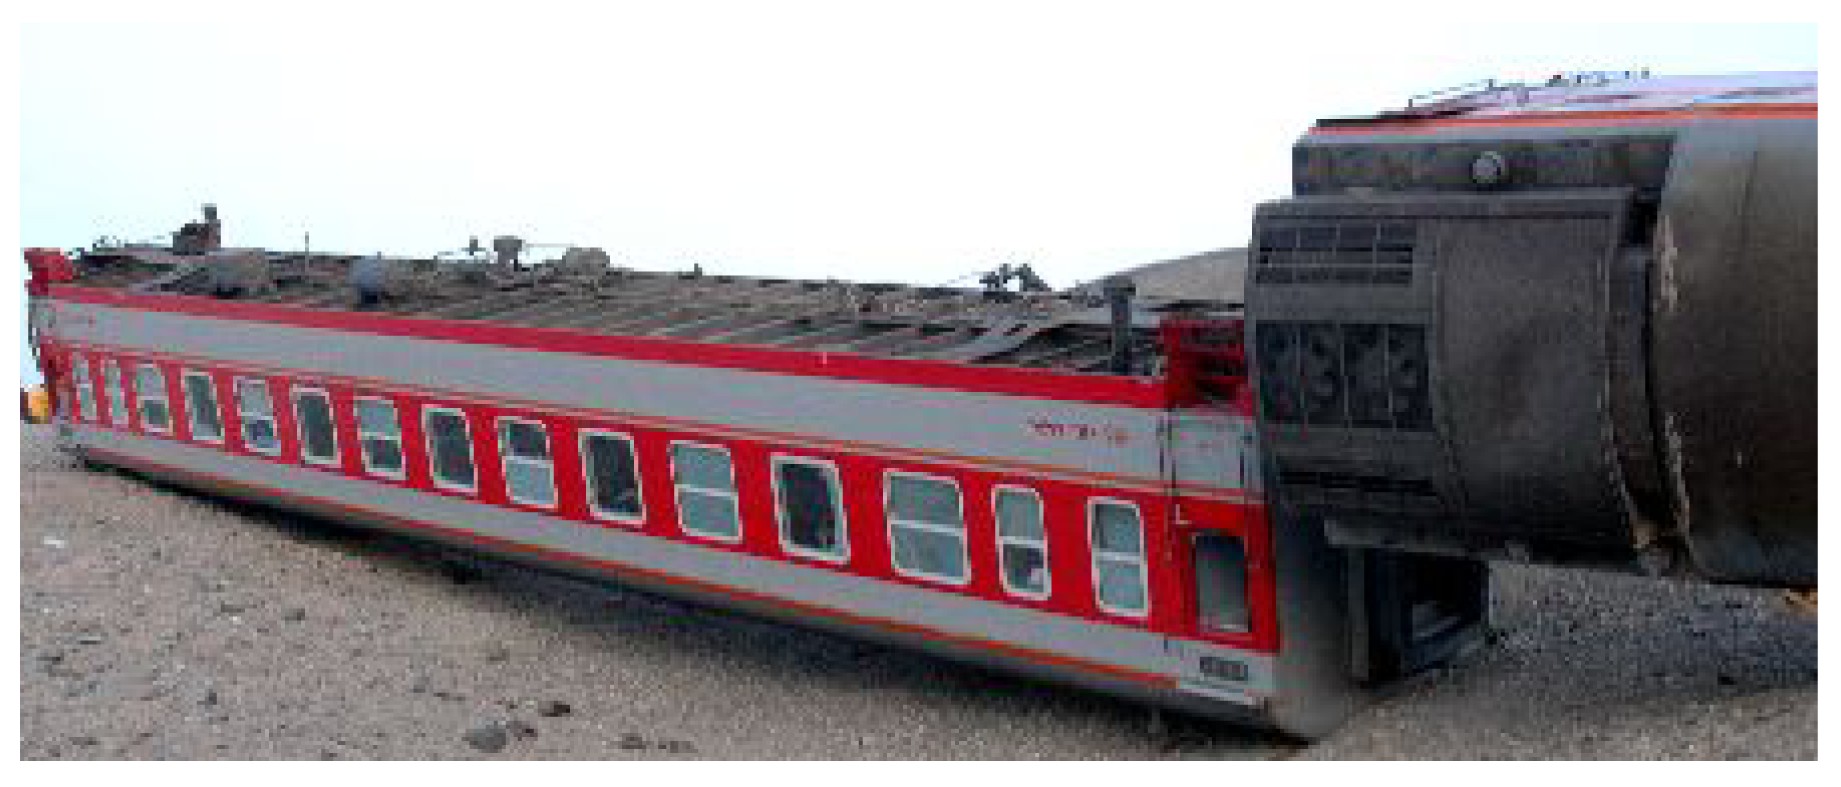
With the rapid development of high-speed railways around the world, the operating safety of high-speed trains has become one of the major concerns of current railway research. Fatal railway accidents, which are the catastrophic consequences of unsafe operating conditions, should be prevented (Evans, 2011; Silla and Kallberg, 2012). Strong crosswinds are among the extreme forces of nature that threaten the safe operation of trains. Many railway vehicles have been blown over by extreme crosswinds in locations around the world. As shown in Fig. 1, on the 28th of February, 2007, a train from Urumqi to Aksu was blown off its track by strong winds in Turpan, Xinjiang Uygur Autonomous Region of China (Xinhua News Agency, 2007). Four people were killed, and more than 30 were injured. To date, more than 30 strong-crosswind-induced accidents have been reported in Japan (Fujii et al., 1999; Gawthorpe, 1994). Most of these accidents occurred on narrow-gauge tracks (Fujii et al., 1999).
Fig.1 Train overturned by crosswinds (Xinhua News Agency, 2007)
Three characteristics of high-speed trains, i.e., their lightweight construction, high driving velocities, and distributed traction (Fujii et al., 1999), have significant influences on their operational safety when subjected to crosswinds. In recent years, the crosswind safety of railway vehicles has been of great interest to researchers and railway industries. Many railway vehicle safety standards, such as EN 14067-6 (CEN, 2010) and TSI/HS-RST-L64-7/3/2008 (OJEU, 2008), have been proposed to evaluate the dynamic response of trains to crosswind action and ensure their operational safety. Reviews of recent international work in this field were presented by Carrarini (2006) and Baker et al. (2009).
Crosswind stability analysis of railway vehicles involves two issues. The first is the flow field around a train in operation and the aerodynamic forces acting on the car body. The second is the resultant dynamic response and crosswind stability of the train-track coupling system and its safety assessment. Most of the previous studies on this subject have focused on the first issue. A large number of full-scale wind tunnel tests and computational fluid dynamics (CFD) simulations have been carried out to examine the airflow around high-speed trains in crosswind scenarios (Baker et al., 2004; Diedrichs, 2005; Cheli et al., 2010). The second issue, which was investigated in this study, has not received much attention in previous studies. Many efforts have been made to use multi-body dynamic models to study the characteristic wind curves, which represent critical crosswind speeds, at which the selected derailment criteria reach their limits and vehicle overturning occurs (Orellano and Schober, 2003; Cheli et al., 2006; Xu and Ding, 2006). Typically, quasi-steady approaches are proposed for use in calculating the wheel loading reduction caused by crosswind forces. Such approaches are based on equilibrium of the steady aerodynamic forces and the restoring forces on the railway vehicle and do not take into account the transient response that occurs when a vehicle is subjected to a crosswind (RSSB, 2000; Carrarini, 2006).
To investigate the operating safety of high-speed railway vehicles subjected to strong crosswinds, a vehicle-track model that considers the crosswind effect was developed and was used in a numerical analysis carried out in a time domain. In this approach, the vehicle is modeled as a nonlinear multi-body system, and the track is modeled as a three-layer system. The rails are modeled as Timoshenko beams supported by discrete sleepers. The coupling of the vehicle and the track is simulated by the track moving with respect to the vehicle operating at a constant speed, which permits consideration of the effects of periodic discrete rail supports on the vehicle-track interaction. The rolling contact of the wheel-rail system reflects the geometric relationship and contact forces between the wheels and rails. The wheel-rail geometric relationship is solved spatially and evaluated on-line using a new wheel-rail contact model (Chen and Zhai, 2004). The wheel-rail contact forces include normal and tangential forces. The normal forces of the wheel-rail system are calculated using the Hertzian contact theory, and their tangential forces are calculated using the nonlinear creep theory proposed by Shen et al. (1983). In the analysis conducted in this study, the crosswind was assumed to be steady, and the aerodynamic forces due to the crosswind were modeled as ramp shape external forces exerted on the car body. The crosswind forces considered included the side force, the lift forces, the roll moment, the pitch moment, and the yaw moment. The numerical analysis was conducted to investigate the dynamic response and derailment mechanism of a high-speed vehicle in a strong crosswind scenario. The effects of the crosswind speed, the crosswind attack angle, and the vehicle speed on the operational safety of the vehicle were examined in detail. The operational safety boundaries of a high-speed vehicle subjected to crosswinds were determined from dynamic simulations of vehicle-track coupling and existing safety assessment criteria.
2. Dynamic model of coupled vehicle-track system in crosswinds
The causes of derailment or overturn of railway vehicles operating in strong crosswinds are not easy to identify, and it is very difficult to recreate accidents in site tests or laboratory experiments. Numerical modeling is an effective means of studying the causes of derailments under extreme conditions, such as in strong crosswinds and earthquakes. Numerical simulation is a very convenient, highly efficient, and low-cost approach to investigating the effects of one or more factors in derailment. An advanced vehicle-track interaction model can be used to characterize derailment of railway vehicles in strong crosswinds. Based on the theories of coupled vehicle-track dynamics (Zhai et al., 1996), a spatial model of a coupled vehicle-track system was developed in this study to simulate vehicle-track interaction for a train operating in crosswind scenarios. The model consists of four subsystems: the vehicle, the track, the wheel-rail contact, and the aerodynamic forces on the vehicle. These subsystems are described in Sections 2.1, 2.2, 2.3, and 2.5, respectively.
2.1. Vehicle model
The vehicle-track model is shown in Figs. 2a and 2b. A high-speed railway vehicle used in China, which consists of a car body, a pair of two-axle bogies, and four wheelsets, was modeled in this study. The primary suspension connects the wheelsets and the bogie frames, and the car body is supported on the bogie through the secondary suspension.
Fig.2 Coupled vehicle-track model: (a) elevation and (b) side elevation
The vehicle is modeled as a nonlinear multi-body system. The structural elastic deformations of the vehicle components are ignored. The vehicle model includes seven rigid bodies, and each body has five degrees of freedom: the lateral (Y), vertical (Z), roll (ϕ), pitch (β), and yaw (ψ) motions. Thus, the total number of degrees of freedom of the vehicle model is 35. All rotational motions of the vehicle parts are considered to be small, which allows linearization of the motion equation for the vehicle parts. Three-dimensional (3D) spring-damper elements are used to represent the primary and secondary suspensions, and the nonlinear dynamic characteristics of the suspension systems are considered. The vehicle speed is assumed to be constant. Therefore, the longitudinal accelerations of the centers of all the parts are always zero. However, the vehicle model considers the relative longitudinal motion of the suspension systems, due to the yaw motions of the car body, the bogie frames, and the wheelsets.
The following are the differential equations of the car body: , , , , .
The following are the differential equations of the bogie i (i=1, 2):
, , , , .
The following are the differential equations of the wheelset i (i=1, 2, 3, 4):
, , , , .
The definitions of the symbols used in Eqs. (1)–(15) are given in Table 1, and the detailed expressions of the mutual forces between the vehicle’s components are presented in (Xiao et al., 2011).
Table 1
Notations for equations of vehicle system
Notation
Description
Mc
Car body mass
Mbi
The ith bogie mass
Mwi
The ith wheelset mass
Ibx, Iby, Ibz
Bogie body roll, pitch, and yaw moments of inertia, respectively
Icx, Icy, Icz
Car body roll, pitch, and yaw moments of inertia, respectively
Iwx,Iwy,Iwz
Wheelset body roll, pitch, and yaw moments of inertia, respectively
V
Forward speed of vehicle
g
Gravity acceleration
rL, rR
Left and right rolling radii
HcB
Height of the car body center from the secondary suspension location
HBt
Height of the secondary suspension from the bogie center
Htw
Height of the bogie center from the wheelset center
lc
Half of the distance between bogie centers
lb
Half distance between the two axles of the bogie
ds
Half distance between the secondary suspension systems of the two sides of the bogie
dw
Half distance between the two primary suspensions of the two sides of the bogie
Fwy, Fwz
Side and lift forces applied to the vehicle body
Mwx, Mwy, Mwz
Roll, pitch, and yaw moments applied to the vehicle body
Fxbji, Fybji, Fzbji (i=1 or 2, j=L or R)
Forces between the car body and the bogie frame in x, y, and z directions
Fxfji, Fyfji, Fzfji (i=1,2,3,4, j=L or R)
Forces between the bogie frame and the wheelset in x, y, and z directions
Fwrxji, Fwryji, Fwrzji (i=1,2,3,4, j=L or R)
Forces between the wheels and rails in x, y, and z directions
Mwryji, Mwrzji (i=1,2,3,4, j=L or R)
Spin moment components between the wheels and rails in y and z directions
2.2. Track model
The ballast track model presented by Xiao et al. (2008), a three-layer model consisting of rails, sleepers, and ballasts, as shown in Fig. 2, was used in this study. The gauge of the tangent track was 1435 mm, the rail cant was 1:40, and the sleeper pitch was 600 mm. The rails were modeled as having a mass of 60 kg/m (CN60) to represent a rail type that is widely used on high-speed rail lines in China. The track, except for the rails, was also modeled as a rigid multi-body dynamic system. The rails were modeled as Timoshenko beams on an elastic point-supporting foundation. The lateral and vertical bending deformations and twisting of the simply supported beams were taken into account.
According to the Timoshenko beam theory, the equations of bending deformations of the rails can be written as follows.
Lateral bending deformation:
Vertical bending deformation:
Torsion: .
In Eqs. (16)–(18), y, z, and ϕ are the lateral, vertical, and torsional deflections, respectively, of the rail; ψy and ψz are the slopes of the deflection curve of the rail with respect to the z and y axes, respectively; ρr, Gr, and Er are the density, shear modulus, and Young’s modulus of the rail, respectively; mr and Ar are the mass per unit longitudinal length and the area of the cross section of the rail, respectively; Iry and Irz are the second moments of the area around the y and z axes, respectively; Ir0 is the polar moment of inertia; and κry, κrz, and Krs are the shear coefficients of the lateral and vertical bending deformation and torsion, respectively. The subscript i indicates wheelset i; j indicates sleeper j;δ(x) is the Dirac delta function; xwi and xfj are the longitudinal positions of wheel i and sleeper j, respectively; NW and NS are the total numbers of wheelsets and sleepers on the analyzed rail, respectively; Mwri(t) and Mrsj(t) are the equivalent moments acting on the rail; Fwryi(t) and Fwrzi(t) are the wheel-rail forces on wheel i in the lateral and vertical directions, respectively; and Frsyj(t) and Frszj(t) are the lateral and vertical forces, respectively, between the rails and sleepers.
The sleepers were modeled as rigid rectangular beams. The lateral and vertical translational motions and the roll motion of each sleeper were considered. The lateral, vertical, and rolling motion equations of sleeper i can be written as , , ,
where Ms is the sleeper mass; Is is the moment of inertia of the sleeper in the rolling direction; FyiL and FyiR are the lateral forces between the sleeper i and the left and right rails, respectively; FziL and FziR are the vertical forces between the sleeper i and the left and right rails, respectively; Fysbi is the lateral force between the sleeper i and the ballasts; FzbiL and FzbiR are the vertical forces between the sleeper i and the left and right equivalent ballast bodies, respectively; db is the half distance between the centers of the left and right ballast bodies; dr is the half distance between the left and right rails; and bs is the half thickness of the sleeper.
The ballast bed is assumed to be composed of equivalent rigid ballast bodies. Only the vertical motion of the ballast body is considered. The motion equations of the left and right ballast bodies i in the vertical direction can be written as , ,
where FzgLi and FzgRi are the vertical support forces due to the roadbed, and FzfLi, FzfRi, FzrLi, FzrRi, and FzLRi are the vertical shear forces between neighboring ballast bodies. This equivalent model can represent the two vertical rigid modes of the ballasts in the vertical-lateral plane of the track. Uniformly viscoelastic elements are used to simulate the roadbed beneath the ballast bed, and the motion of the roadbed is neglected. The rails and the sleepers, the sleepers and the ballast bodies, and the discrete ballast bodies and the roadbed are connected with equivalent springs and dampers.
2.3. Wheel-rail contact model
Wheel-rail contact generates the necessary conditions for a railway vehicle to run stably on a track. In the analysis of transient dynamics and derailment (or overturning) of high-speed railway vehicles under strong crosswinds, accurate and fast calculation of the wheel-rail contact is important. The rolling contact of the wheel-rail system depends on the geometric relationship and the contact forces between the wheels and rails. A new wheel-rail contact model (Chen and Zhai, 2004) was used in this study to characterize the geometry of the wheel-rail rolling contact, and this model is able to consider the separation of wheels and rails.
The wheel-rail contact forces include the normal load and the tangential forces. The normal load is calculated using the following equation for a Hertzian nonlinear contact spring with a unilateral restraint:
where Ghertz is the wheel-rail contact constant (m/N2/3), which depends on the radii of curvature and the elastic moduli of the wheel and rail, for the given wheel profiles: ,
where r is the rolling radius of the wheel. The value of Ghertz changes with the location of the contact point. The Zwrnc(t) term reflects the amount of normal compression at the wheel-rail contact point, which is defined as an approach between a pair of contact points, one of which belongs to the wheel tread and the other belongs to the rail surface. The condition expressed as Zwrnc(t)≤0 reflects the separation between the wheel and the rail, and the condition expressed as Zwrnc(t)>0 reflects wheel-rail in contact.
The tangential forces of the wheel-rail contact are determined using Kalker’s linear creep theory (Kalker, 1967) and Shen’s model (Shen et al., 1983). First, the wheel-rail creep forces are calculated using Kalker’s linear creep theory for small amounts of creep. For large amounts of creep, saturation occurs, resulting in a nonlinear relation that is described using Shen’s model (Shen et al., 1983).
2.4. Vehicle-track excitation model
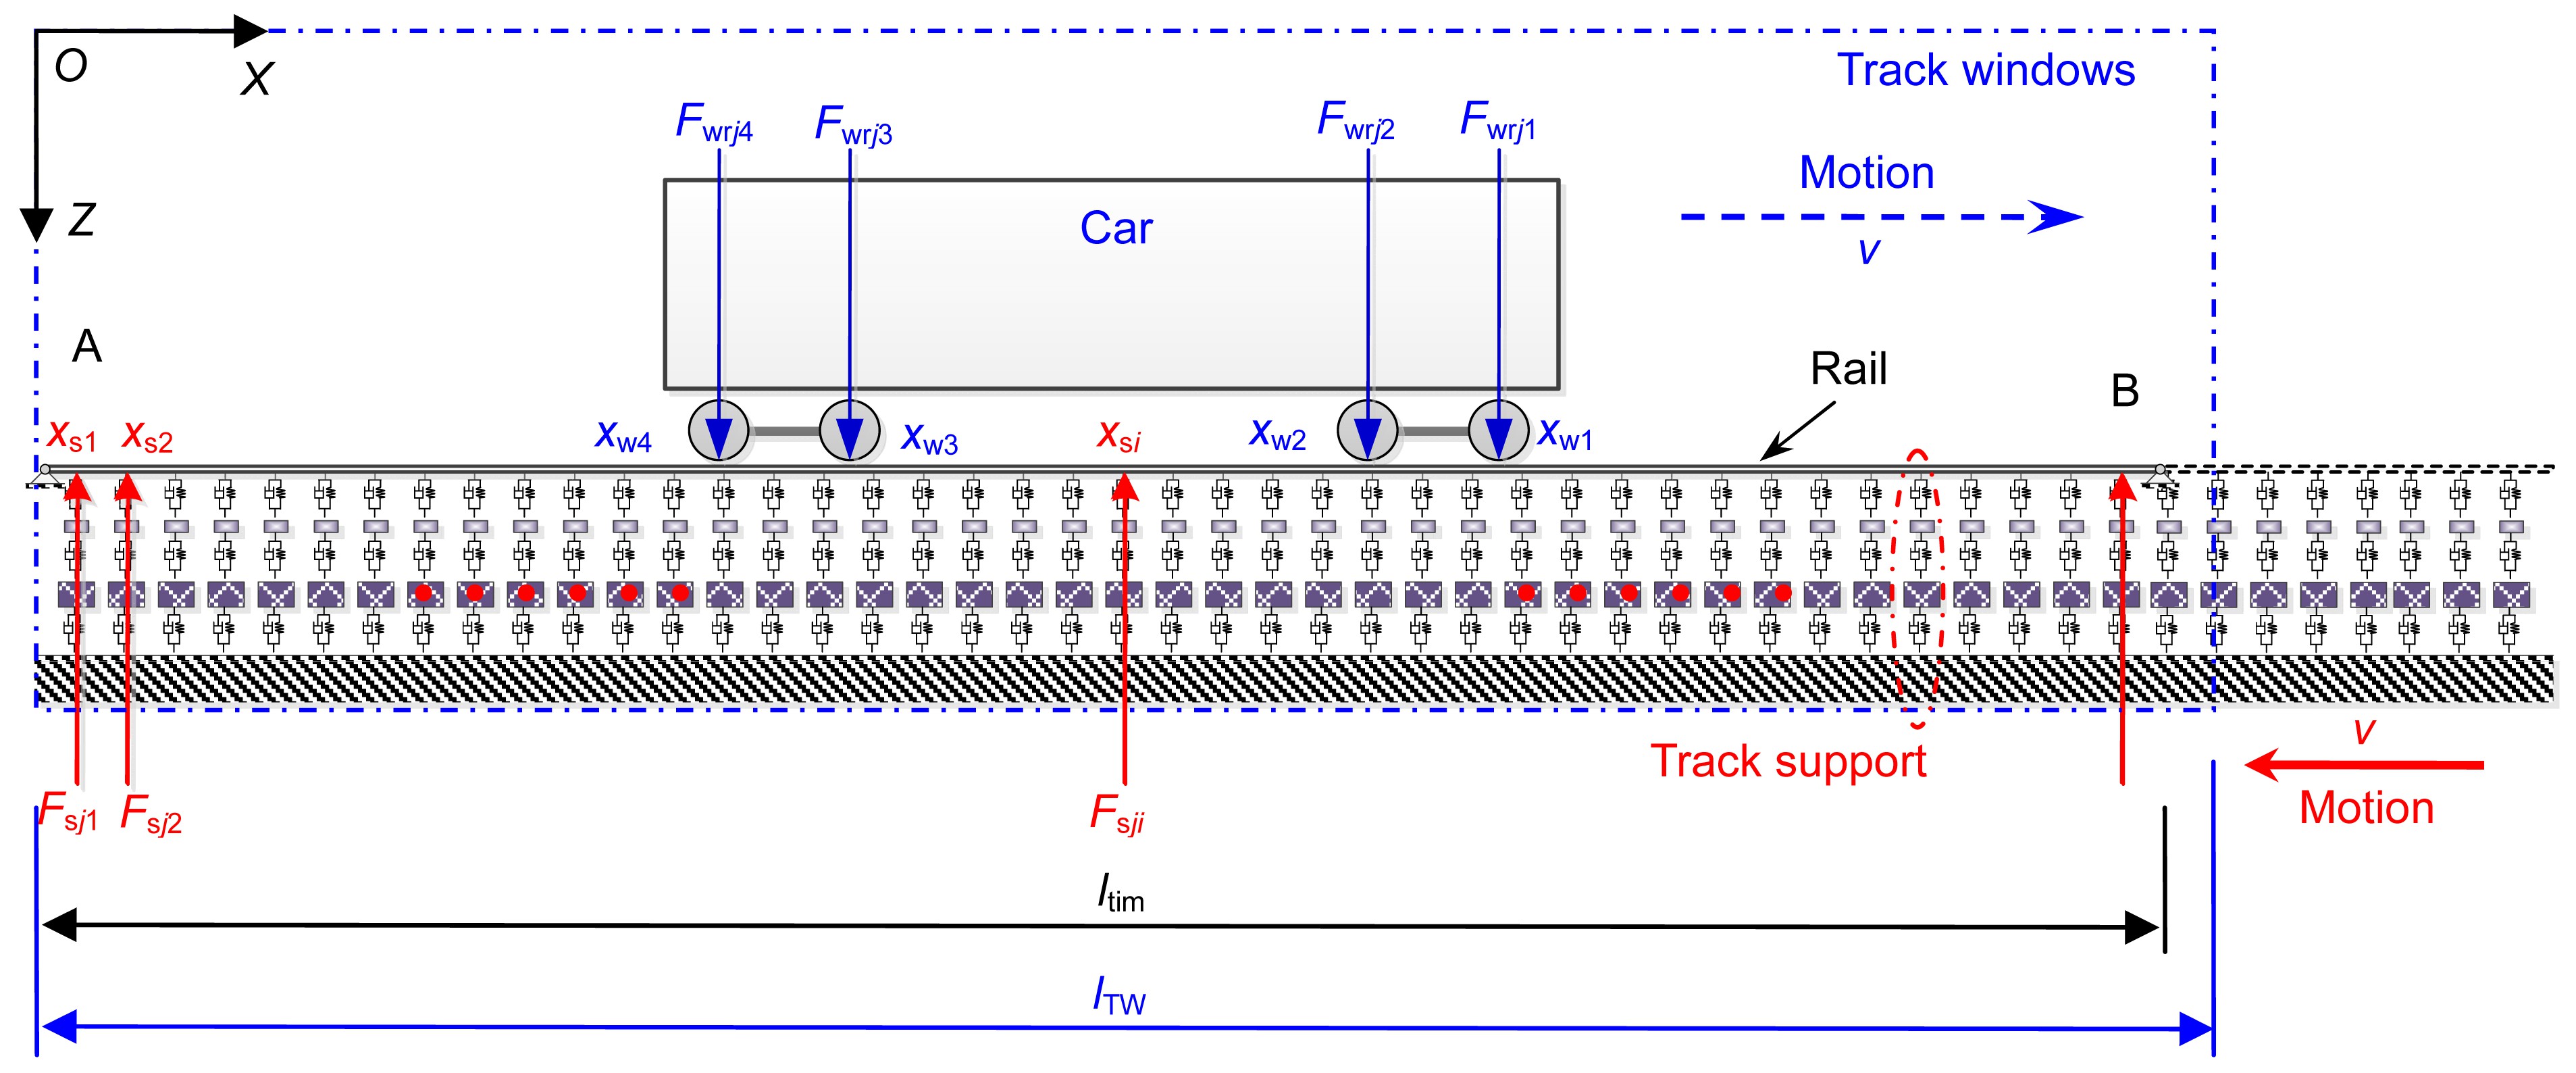
The dynamic vehicle-track system used in this study consists of four models (Knothe and Grassie, 1993): (1) a stationary load model, (2) a moving-load excitation model, (3) a moving irregularity model, and (4) a moving mass model. A “tracking window” model developed in our previous study (Xiao et al., 2011) was used, which is shown in Fig. 3. In the model, the vehicle remains in a static state with respect to the ground in the longitudinal direction, and the track system moves in the opposite direction of the vehicle motion at the same speed. A detailed description of this vehicle-track model and the derivation of the system equations were presented in (Xiao et al., 2011).
Fig.3 Vehicle-track system excitation model
2.5. Aerodynamic forces on the vehicle
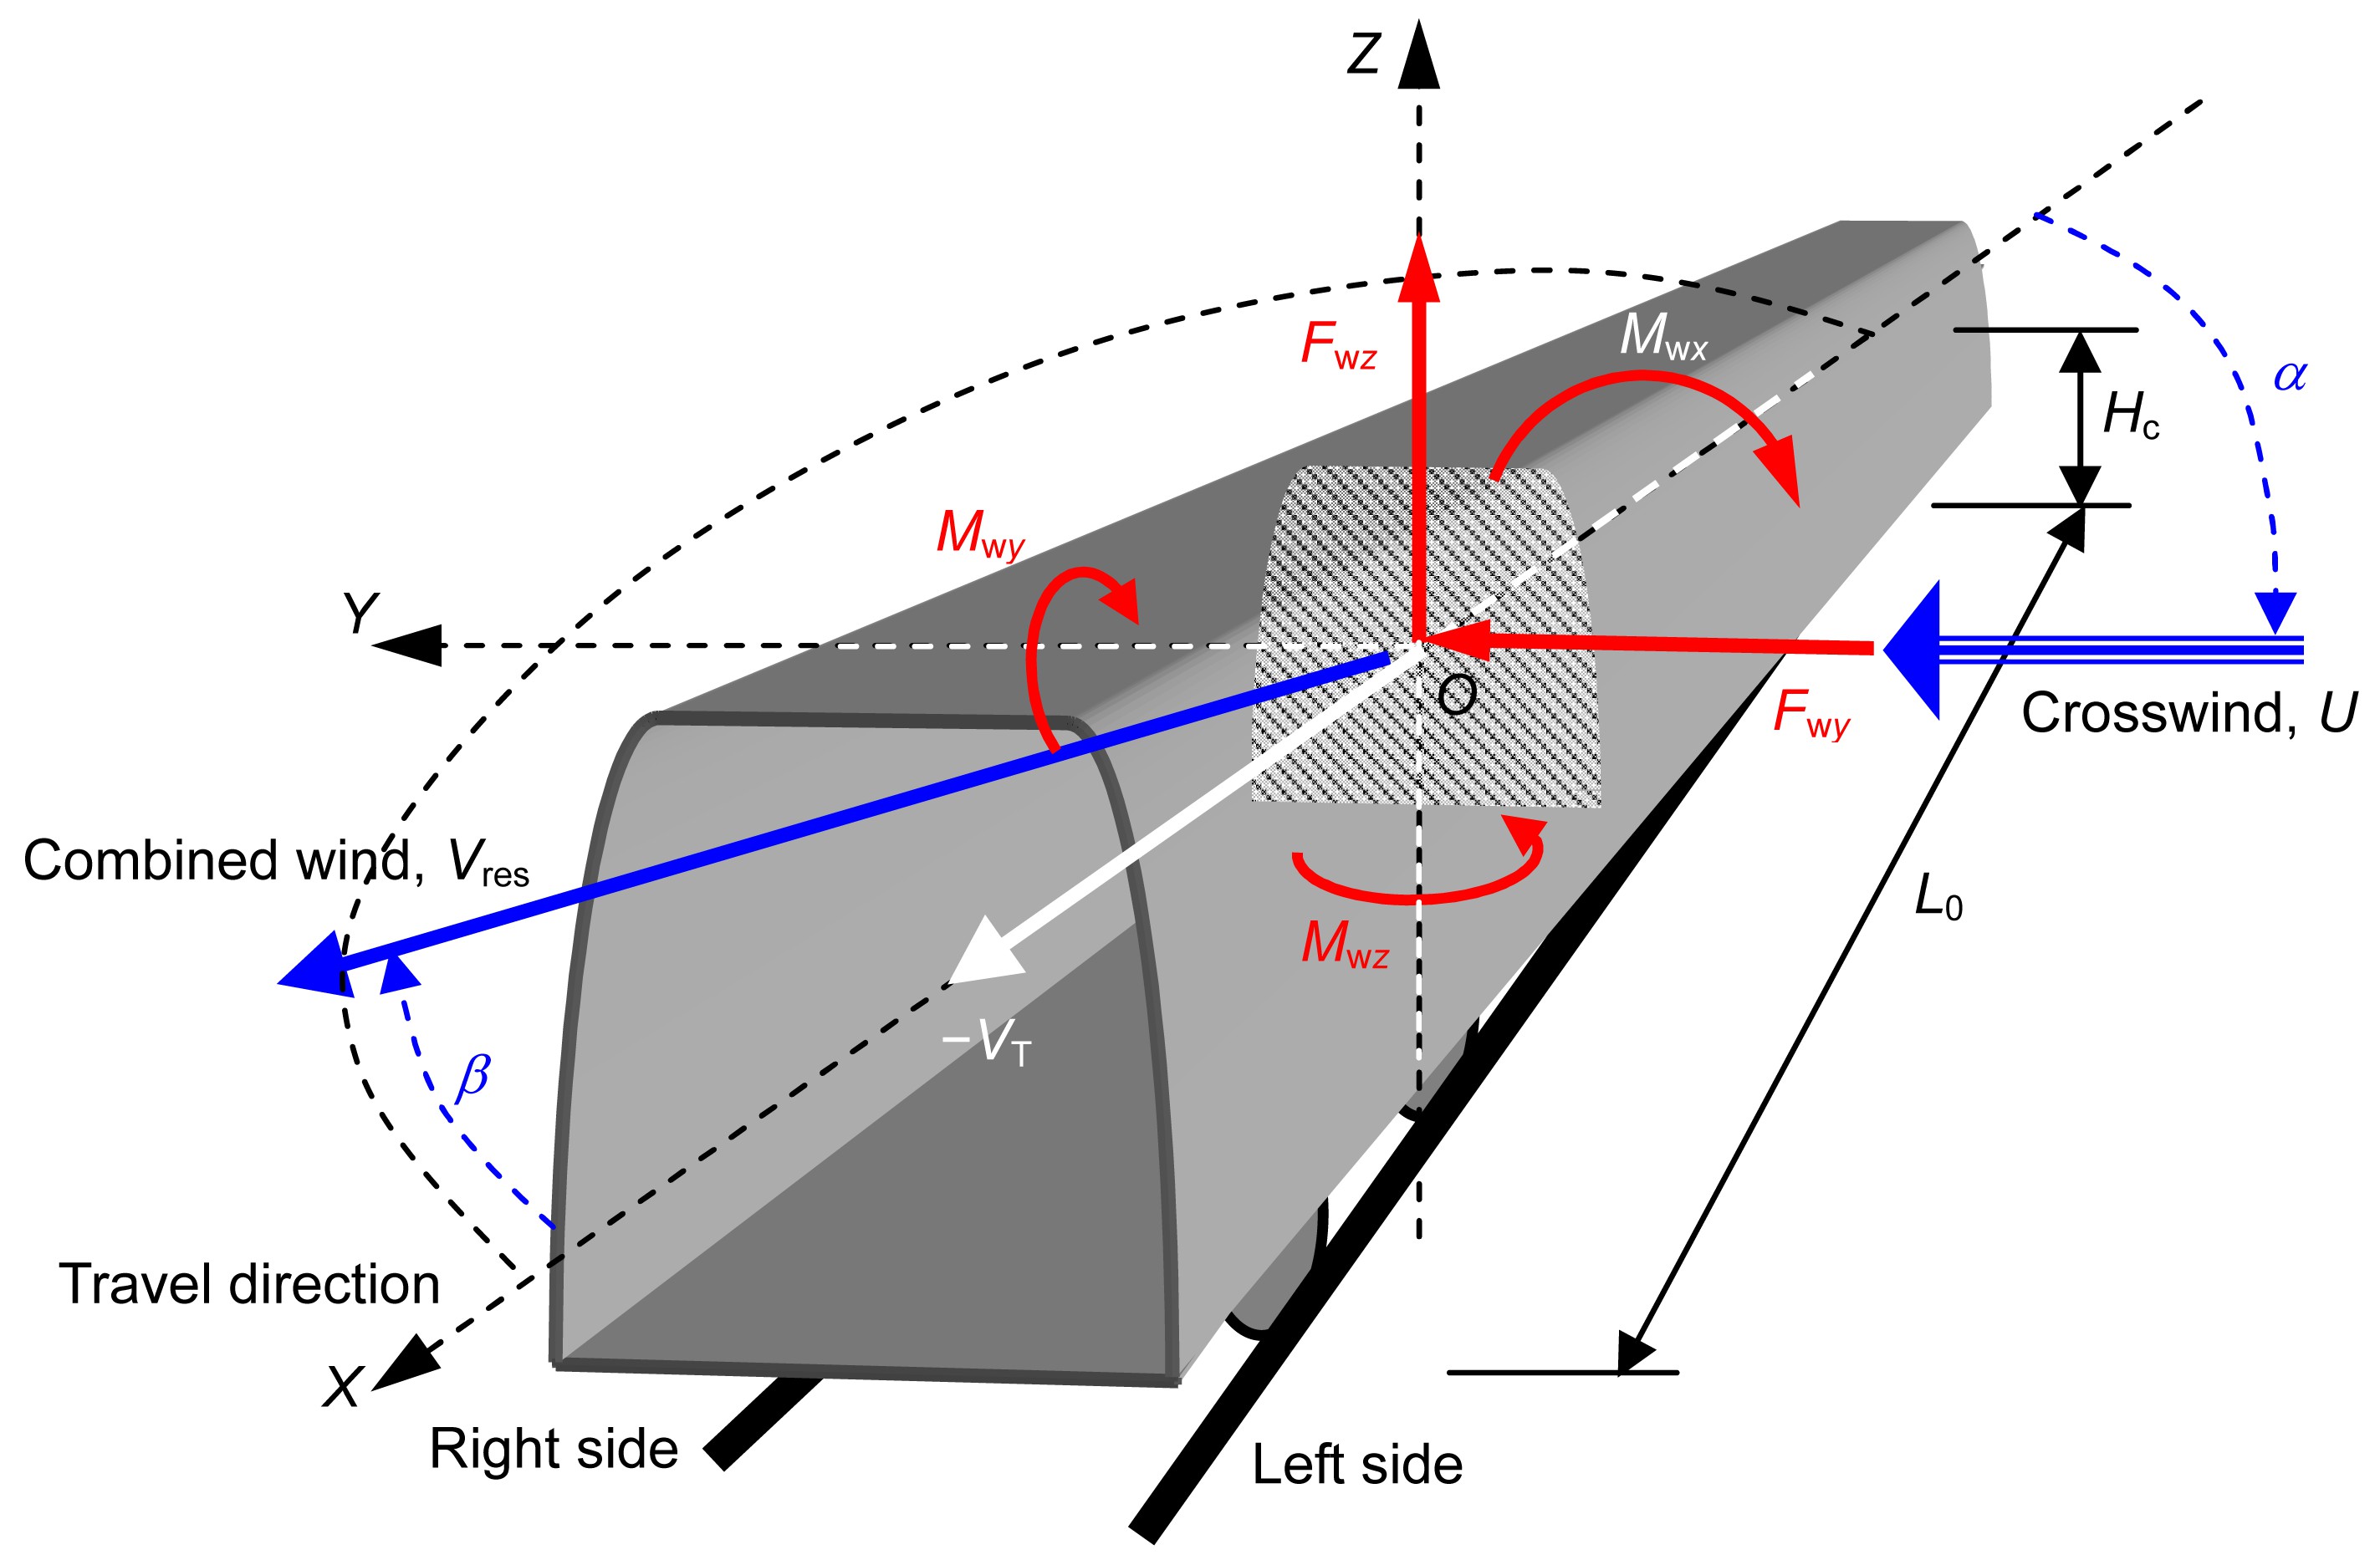
The aerodynamic forces acting on a railway vehicle subjected to a crosswind can be divided into two parts: steady forces and unsteady forces. Steady crosswind forces are caused by the mean wind speed components of natural wind, and the unsteady wind forces are caused by the fluctuating wind speed components (Xu and Ding, 2006). In this study, the crosswind was assumed to be steady, and the mean wind speed was assumed to be in the horizontal direction. The aerodynamic forces due to the crosswinds were modeled as ramp-shaped external forces exerted on the vehicle body. Only aerodynamic forces acting on the car body were taken into account. The crosswind forces F applied to the vehicle body include the side force Fwy, the lift force Fwz, the roll moment Mwx, the pitch moment Mwy, and the yaw moment Mwz, as shown in Fig. 4.
Fig.4 Aerodynamic forces on railway vehicle
Taking into account the transient response of the vehicle in a crosswind scenario, the crosswind forces F can be defined as
where L0 is the vehicle length, and ζ is the length of the car body immersed in the crosswind scenario. According to the corrected quasi-steady approach, the force vector F0=[Fwy, Fwz, Mwx, Mwy, Mwz] can be expressed as ,
,
,
,
,
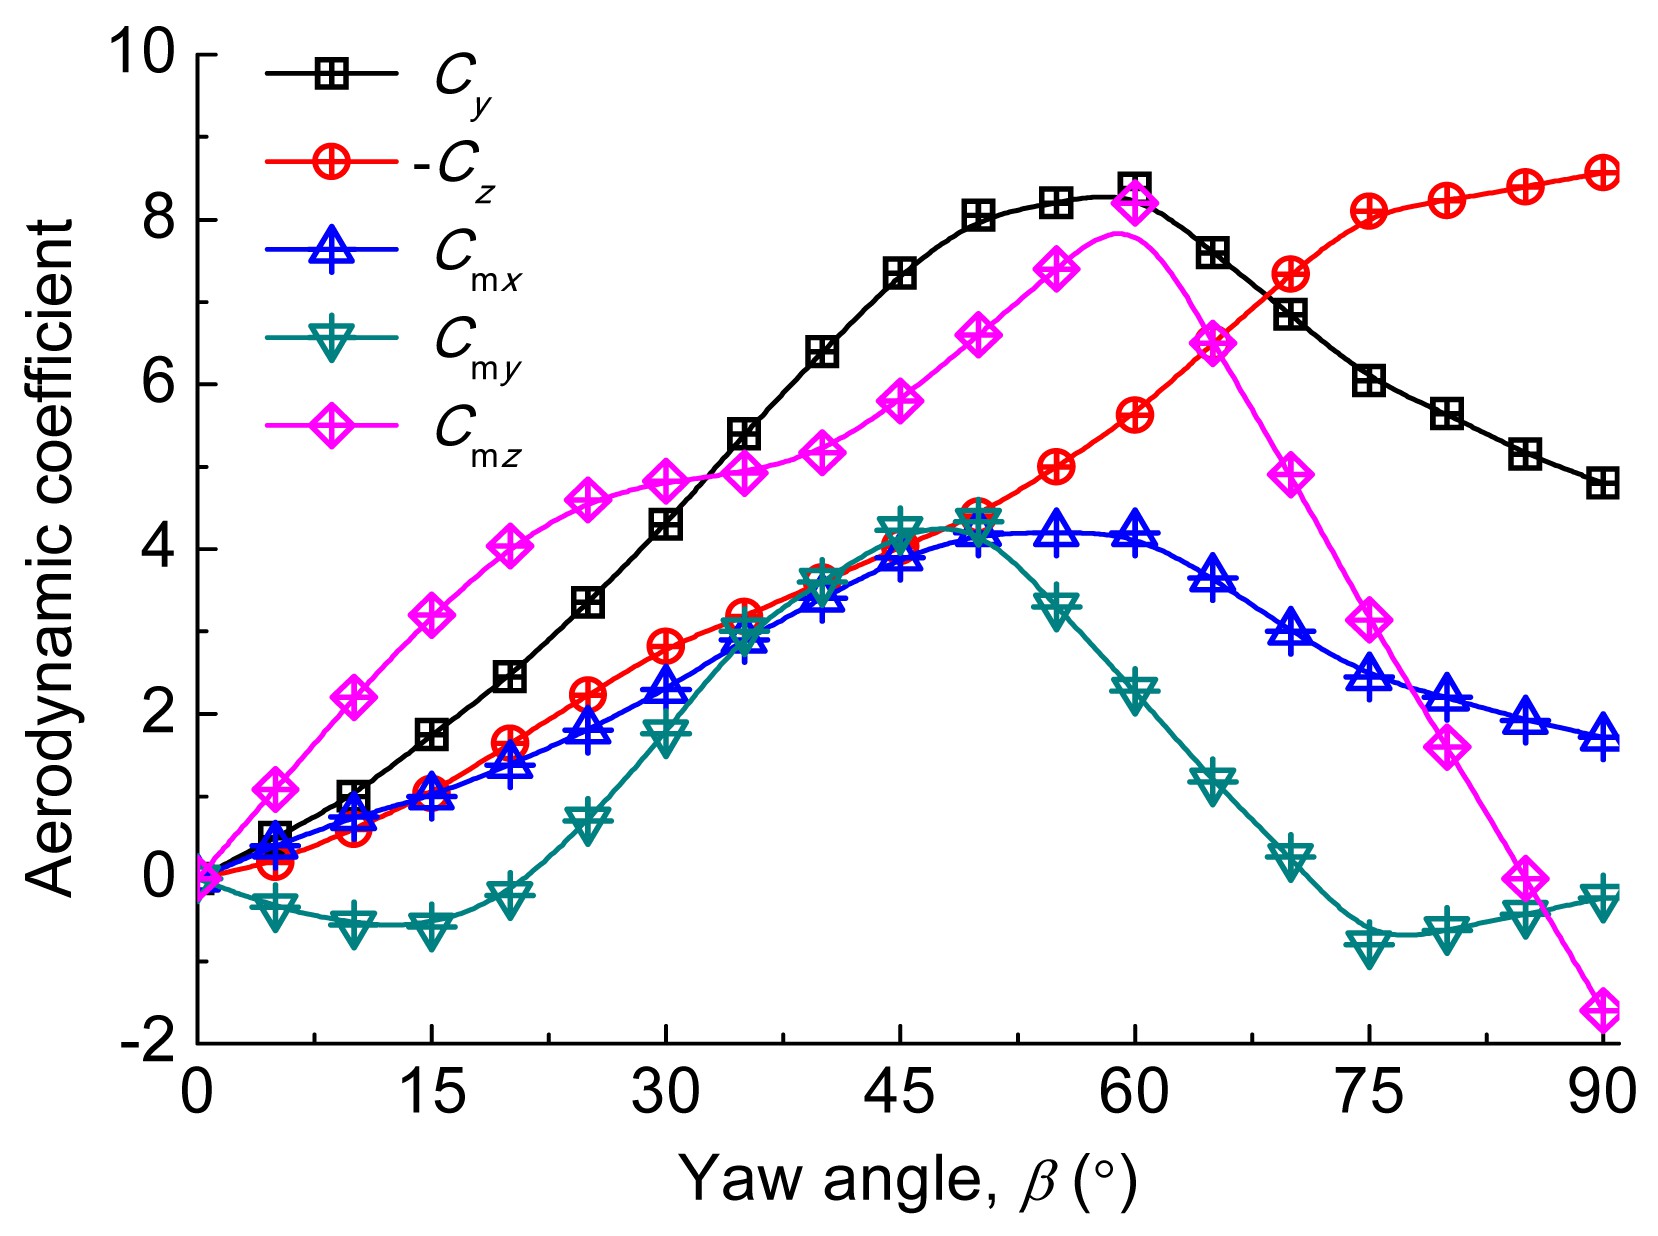
where ρair is the air density, Ac is the reference area, and Hc is the reference height. A “TSI normalization” with Ac=10 m2 and Hc=3 m was adopted in this study (OJEU, 2008). The terms cy, cz, cmx, cmy, and cmz correspond to the aerodynamic force coefficients, which depend on the crosswind attack angle β. The aerodynamic coefficients of the inter city express 2 (ICE2) driving trailer (Orellano and Schober, 2003) were used in the calculation of the crosswind forces, as shown in Fig. 5.
Fig.5 Aerodynamic coefficients of extreme forces on the vehicle
The term Vres corresponds to the resulting squared wind speed. The terms β and Vres correspond to spatial averages with respect to the surface of the vehicle. The resulting wind speed Vres(t) is defined as ,
and the resultant crosswind attack angle β is determined by ,
where VT is the vehicle speed, and U is the crosswind velocity. The crosswind attack angle αw is defined as the relative angle between the direction of the crosswind U and the direction of the vehicle’s motion (in the direction of the x axis), as shown in Fig. 4.
3. Methods for safety assessment of crosswinds
At present, the derailment criteria for estimating the running safety of trains vary from country to country. Most of the existing criteria consider a single influencing factor or a few influencing factors, and they are regarded as isolated constants in evaluating the operational safety of trains (Ling et al., 2012). The commonly used derailment safety assessment criteria include the following:
(1) Nadal’s single-wheel L/V limit criterion (L/V<0.8) (Nadal, 1896), where L and V are the wheel-rail lateral and vertical forces, respectively;
(3) The L/V time duration criterion (T[L/V>0.8]<50 ms) (Japanese National Railways (JNR)) (Yokose, 1966);
(4) The L/V distance duration criterion (Dis[L/V>0.8]<1.5 m) (Federal Railroad Administration (FRA)) (Wu and Wilson, 2006);
(5) The bogie-side-sum L/V limit criterion ((L/V)B<0.6) (Wu and Wilson, 2006);
(6) Prudhomme’s criterion (transverse axle force) (Fys<10+P0/3, where P0 is the static wheelset load) (Wilson et al., 2011);
(7) The wheel load unloading ratio (ΔV/V<0.8) (Jin et al., 2013);
(8) The vehicle overturning coefficient (VD/V0<0.8) (Jin et al., 2013);
(9) The wheel rise (Zup) limit with respect to the rail (Zup<28.272 mm) (Jin et al., 2013);
(10) The lateral coordinate (ycon) limit of the wheel-rail contact point (−38.875 mm<ycon<57.0 mm) (Jin et al., 2013).
Criteria (1)–(4) are related to the ratio of the lateral force to the vertical force of a wheel-rail pair. These criteria are applied to assess the climbing derailment safety of railway vehicles. When a high-speed vehicle is in a crosswind scenario, leeward wheel climbing is very likely to occur. Thus, criteria (1)–(4) were used in this study to evaluate the running safety of a high-speed railway vehicle subjected to strong crosswinds. Criterion (5) is usually used to evaluate derailment caused by rail rollover or track gauge widening, and criterion (6) is the track panel shift criterion, which applies in circumstances of strong crosswinds. Criteria (7) and (8) are two useful safety assessment indexes for vehicle overturning. Criteria (1)–(8) are all calculated based on the wheel-rail contact forces. In fact, the separation between wheels and rails occurs quite often. When the wheel loses contact with the rail, the wheel-rail contact forces vanish. In this situation, it is very difficult to determine the status of the vehicle operation using these criteria. We therefore considered two additional derailment criteria based on the wheel-rail contact geometry to evaluate the critical conditions of running safety when high-speed vehicles are subjected to crosswinds. These two criteria are the wheel rise (Zup) limit with respect to the rail (criterion (9)) and the lateral coordinate (ycon) limit of the wheel-rail contact point (criterion (10)). Based on the dynamic simulation and the derailment safety assessment criteria listed above, the boundaries of the safe operation area, the warning area, and the derailment area were calculated for conditions of strong crosswinds in which high-speed vehicles operate.
4. Simulation of high-speed vehicle dynamic behavior under crosswinds
To investigate the effect of crosswinds on the dynamic responses and running safety of high-speed railway vehicles, the coupled vehicle-track dynamic model discussed in Section 2 was used to carry out a dynamic analysis in the time domain. The parameters of a Chinese high-speed passenger car and a tangent track were used in the numerical simulation (Xiao et al., 2008). Normal track irregularity was neglected because its effects on the dynamic behavior of the vehicle-track system are very small compared to the effect of crosswind excitation. The dynamic responses of a high-speed vehicle subjected to crosswinds, including the rolling and lateral displacements of the car body and the wheel-rail normal forces, were investigated as described in Section 4.1. The safety and overturning risk of the high-speed vehicle were assessed by analyzing the transient values of two derailment criteria: wheel unloading and wheel rise with respect to the rail top. The effects of the crosswind speed, the crosswind attack angle, and the vehicle speed on the running safety of the vehicle were examined in detail, as discussed in Sections 4.2 and 4.3.
4.1. Vehicle dynamic responses to crosswind
First, the dynamic behaviors of the vehicle system as the vehicle enters a crosswind scenario with a constant crosswind attack angle and a constant driving speed were investigated. The vehicle speed VT was set to 300 km/h, the crosswind speed U was varied from 12 to 24 m/s, and the crosswind attack angle αw was 90°. The strong crosswind was assumed to blow from the left side to the right side of the vehicle, as shown in Fig. 4.
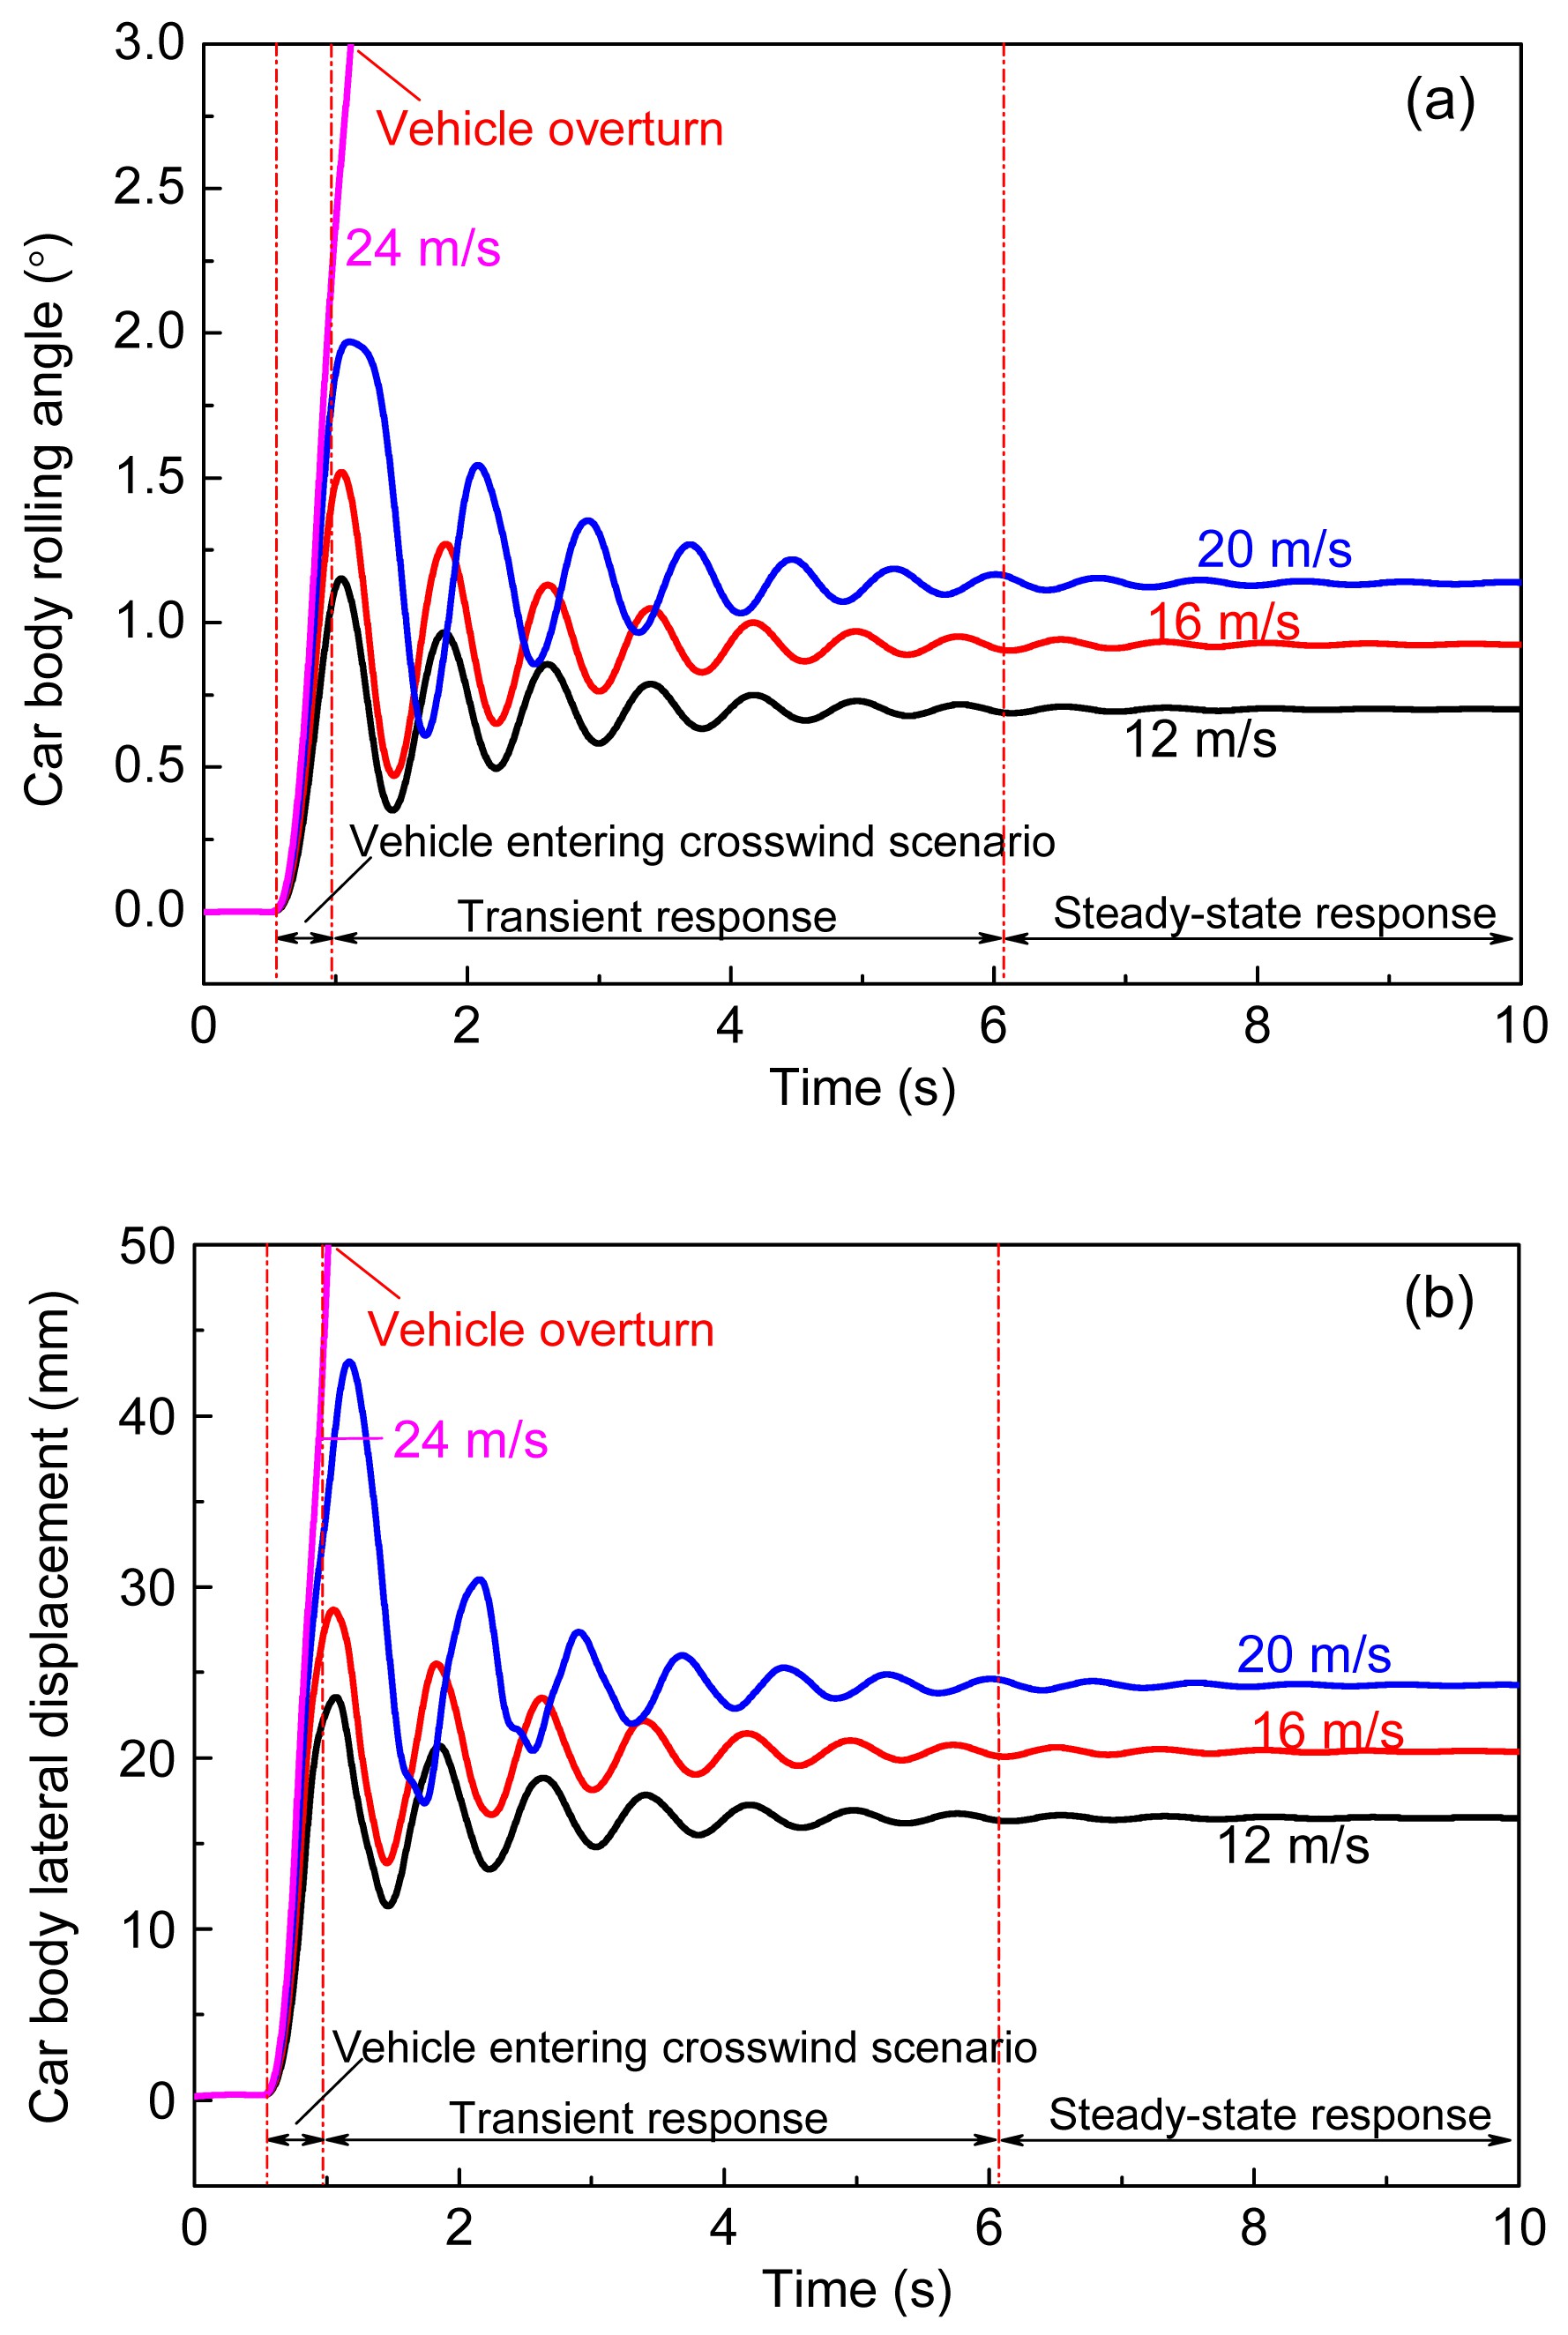
Fig. 6 illustrates the time histories of the lateral and rolling displacements of the car body under the excitation of crosswinds. When the vehicle enters the crosswind scenario, the dynamic response of the car body sharply increases, and there occurs a fierce transient fluctuation of the body. This fluctuation decays periodically with time and returns to a steady-state response. The oscillation period and the amplitude of the transient response of the vehicle system increase as the crosswind speed increases.
Fig.6 Rolling angles (a) and lateral displacements (b) of car body
As shown in Fig. 6, the crosswind has a great influence on the ride comfort and safety of the passengers. As the crosswind speed increases, the dynamic responses of the car body become very strong. When the crosswind speed reaches 24 m/s, the maximum values of the car body rolling angle and lateral displacement exceed 3° and 50 mm, respectively. In this extreme situation, the high-speed vehicle overturns. Although the amplitudes of the rolling angle and lateral displacement are very large, overturning or derailment does not occur when the crosswind speed is less than 24 m/s. Furthermore, the transient responses of the car body rolling motion are much larger than the steady-state responses, as shown in Fig. 6a. The trends for the lateral displacement are similar, as shown in Fig. 6b. This means that the vehicle can easily overturn or derail during the fierce transient fluctuation period in strong crosswinds.
The derailment criteria most commonly used in the evaluation of the operating safety of a railway vehicle, including the flange climbing derailment coefficient L/V and the wheel unloading ratio ∆V/V, are calculated based on the wheel-rail contact forces. Therefore, the dynamic responses of the wheel-rail contact forces could reflect the derailment or rollover risk when high-speed vehicles operate in crosswinds. Fig. 7 shows the time histories of the normal forces of the first wheelset. When the vehicle enters the crosswind scenario, fierce transient fluctuation of the normal forces occurs. The amplitudes of the normal forces on the leeward wheels, i.e., the right wheels, are much larger than those on the left wheels. In other words, the crosswind increases the normal loads on the leeward wheels and reduces the wheel loads on the windward side of the vehicle. When the wind speed is greater than 16 m/s, the minimum value of the normal forces is zero during the first oscillation period, which means that the windward wheels lose contact with the left rail, as shown in Fig. 7a. At the same time, the maximum values of the normal forces are greater than 110 kN (Fig. 7b).
Fig.7 Responses of wheel-rail normal forces: (a) windward wheel (left wheel) and (b) leeward wheel (right wheel)
In this study, the windward wheels were found to lose contact with the rail and the vehicle overturning was found to take place when the crosswind speed reached 24 m/s (Fig. 7a). During the derailment process, fierce oscillation of the normal forces on the right wheels occurs (Fig. 7b). The maximum values of the normal forces in the course of the vehicle’s transient response are much larger than the steady-state values. The variations in the normal forces were found to be similar for all of the wheels considered in the analysis.
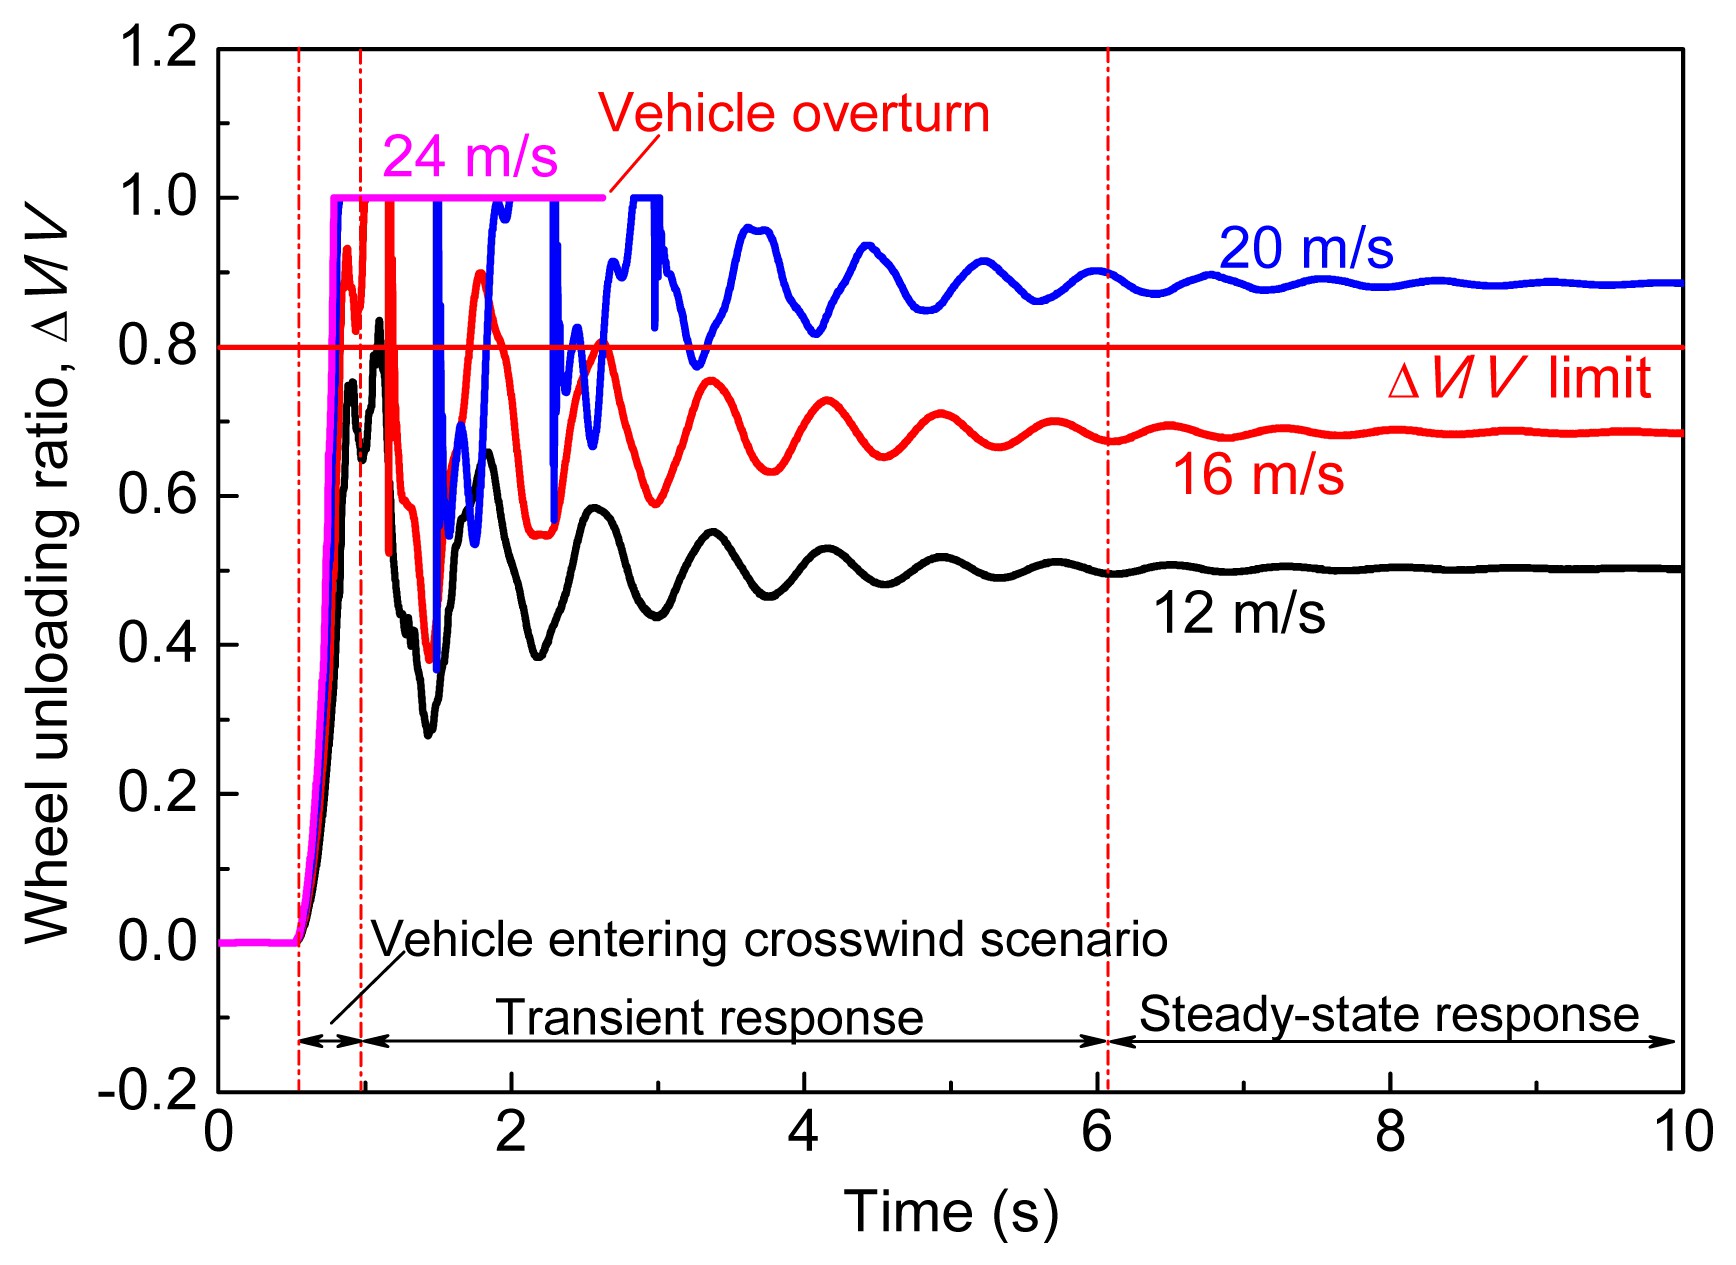
The wheel unloading ratio ΔV/V is an important safety criterion for assessing the overturning risk of railway vehicles subjected to crosswinds. An analysis of ΔV/V for all wheelsets was therefore carried out for crosswind speeds from 12 to 24 m/s. The results are shown in Fig. 8. The maximum values of the wheel loading reduction occur in the first period, corresponding to the first oscillation period of the normal forces, as shown in Fig. 7. The maximum ΔV/V values for all of the cases considered in Fig. 8 are greater than 0.8, which is the current limit value of ΔV/V for safe operation of high-speed trains in China. For wind speeds in excess of 16 m/s, the peak values of ΔV/V for all wheelsets are equal to 1.0, which means that wheel-rail separation occurs, as shown in Fig. 8. Figs. 7 and 8 show that when the crosswind speed reaches 24 m/s, derailment of the high-speed vehicle occurs.
Fig.8 Responses of wheel unloading ratio ΔV/V
Fig. 8 illustrates another interesting issue that should be considered. Derailment or overturning does not occur when the value of ΔV/V exceeds 0.8 or even when its value reaches 1.0 (when the wheel-rail separation occurs). This means that a value of 0.8 for the wheel unloading criterion ΔV/V is somewhat conservative. A value of 0.8 for this criterion is thus not an accurate predictor of when vehicle derailment will occur. A more effective derailment assessment method should be put forward to address this problem.
In this study, the wheel rise Zup was used together with the wheel unloading creation ΔV/V to evaluate the running safety and derailment mechanism of a high-speed vehicle subjected to strong crosswinds. Fig. 9 illustrates the time histories of the wheel rise Zup of the first wheelset, which were obtained from calculations of the wheel-rail contact geometry during vehicle operation. The solid horizontal line indicates the wheel rise limit, namely, Žup=28.272 mm (Fig. 9a).
Fig.9 Responses of wheel rises: (a) windward wheel (left wheel) and (b) leeward wheel (right wheel)
When the vehicle enters the crosswind scenario, the wheel rises of the leeward wheels increase gradually (Fig. 9b). In this situation, the leeward wheels climb up the right rail top. When the vehicle has entered the wind scenario completely, the crosswind rolling moment increases the vertical load on the climbing leeward wheels, and the wheels stop climbing. As a result, flange climbing derailment is not dominant in railway vehicle derailment caused by strong crosswinds. As the crosswind speed increases, the wheel rises of the windward wheels jump sharply (Fig. 9a). At crosswind speeds less than 20 m/s, the Zup of the windward wheels does not exceed the wheel rise limit Žup=28.272 mm. At a crosswind speed U=24 m/s, the windward wheels lose the left rail constraint, and the vehicle overturns.
4.2. Effect of crosswind attack angle
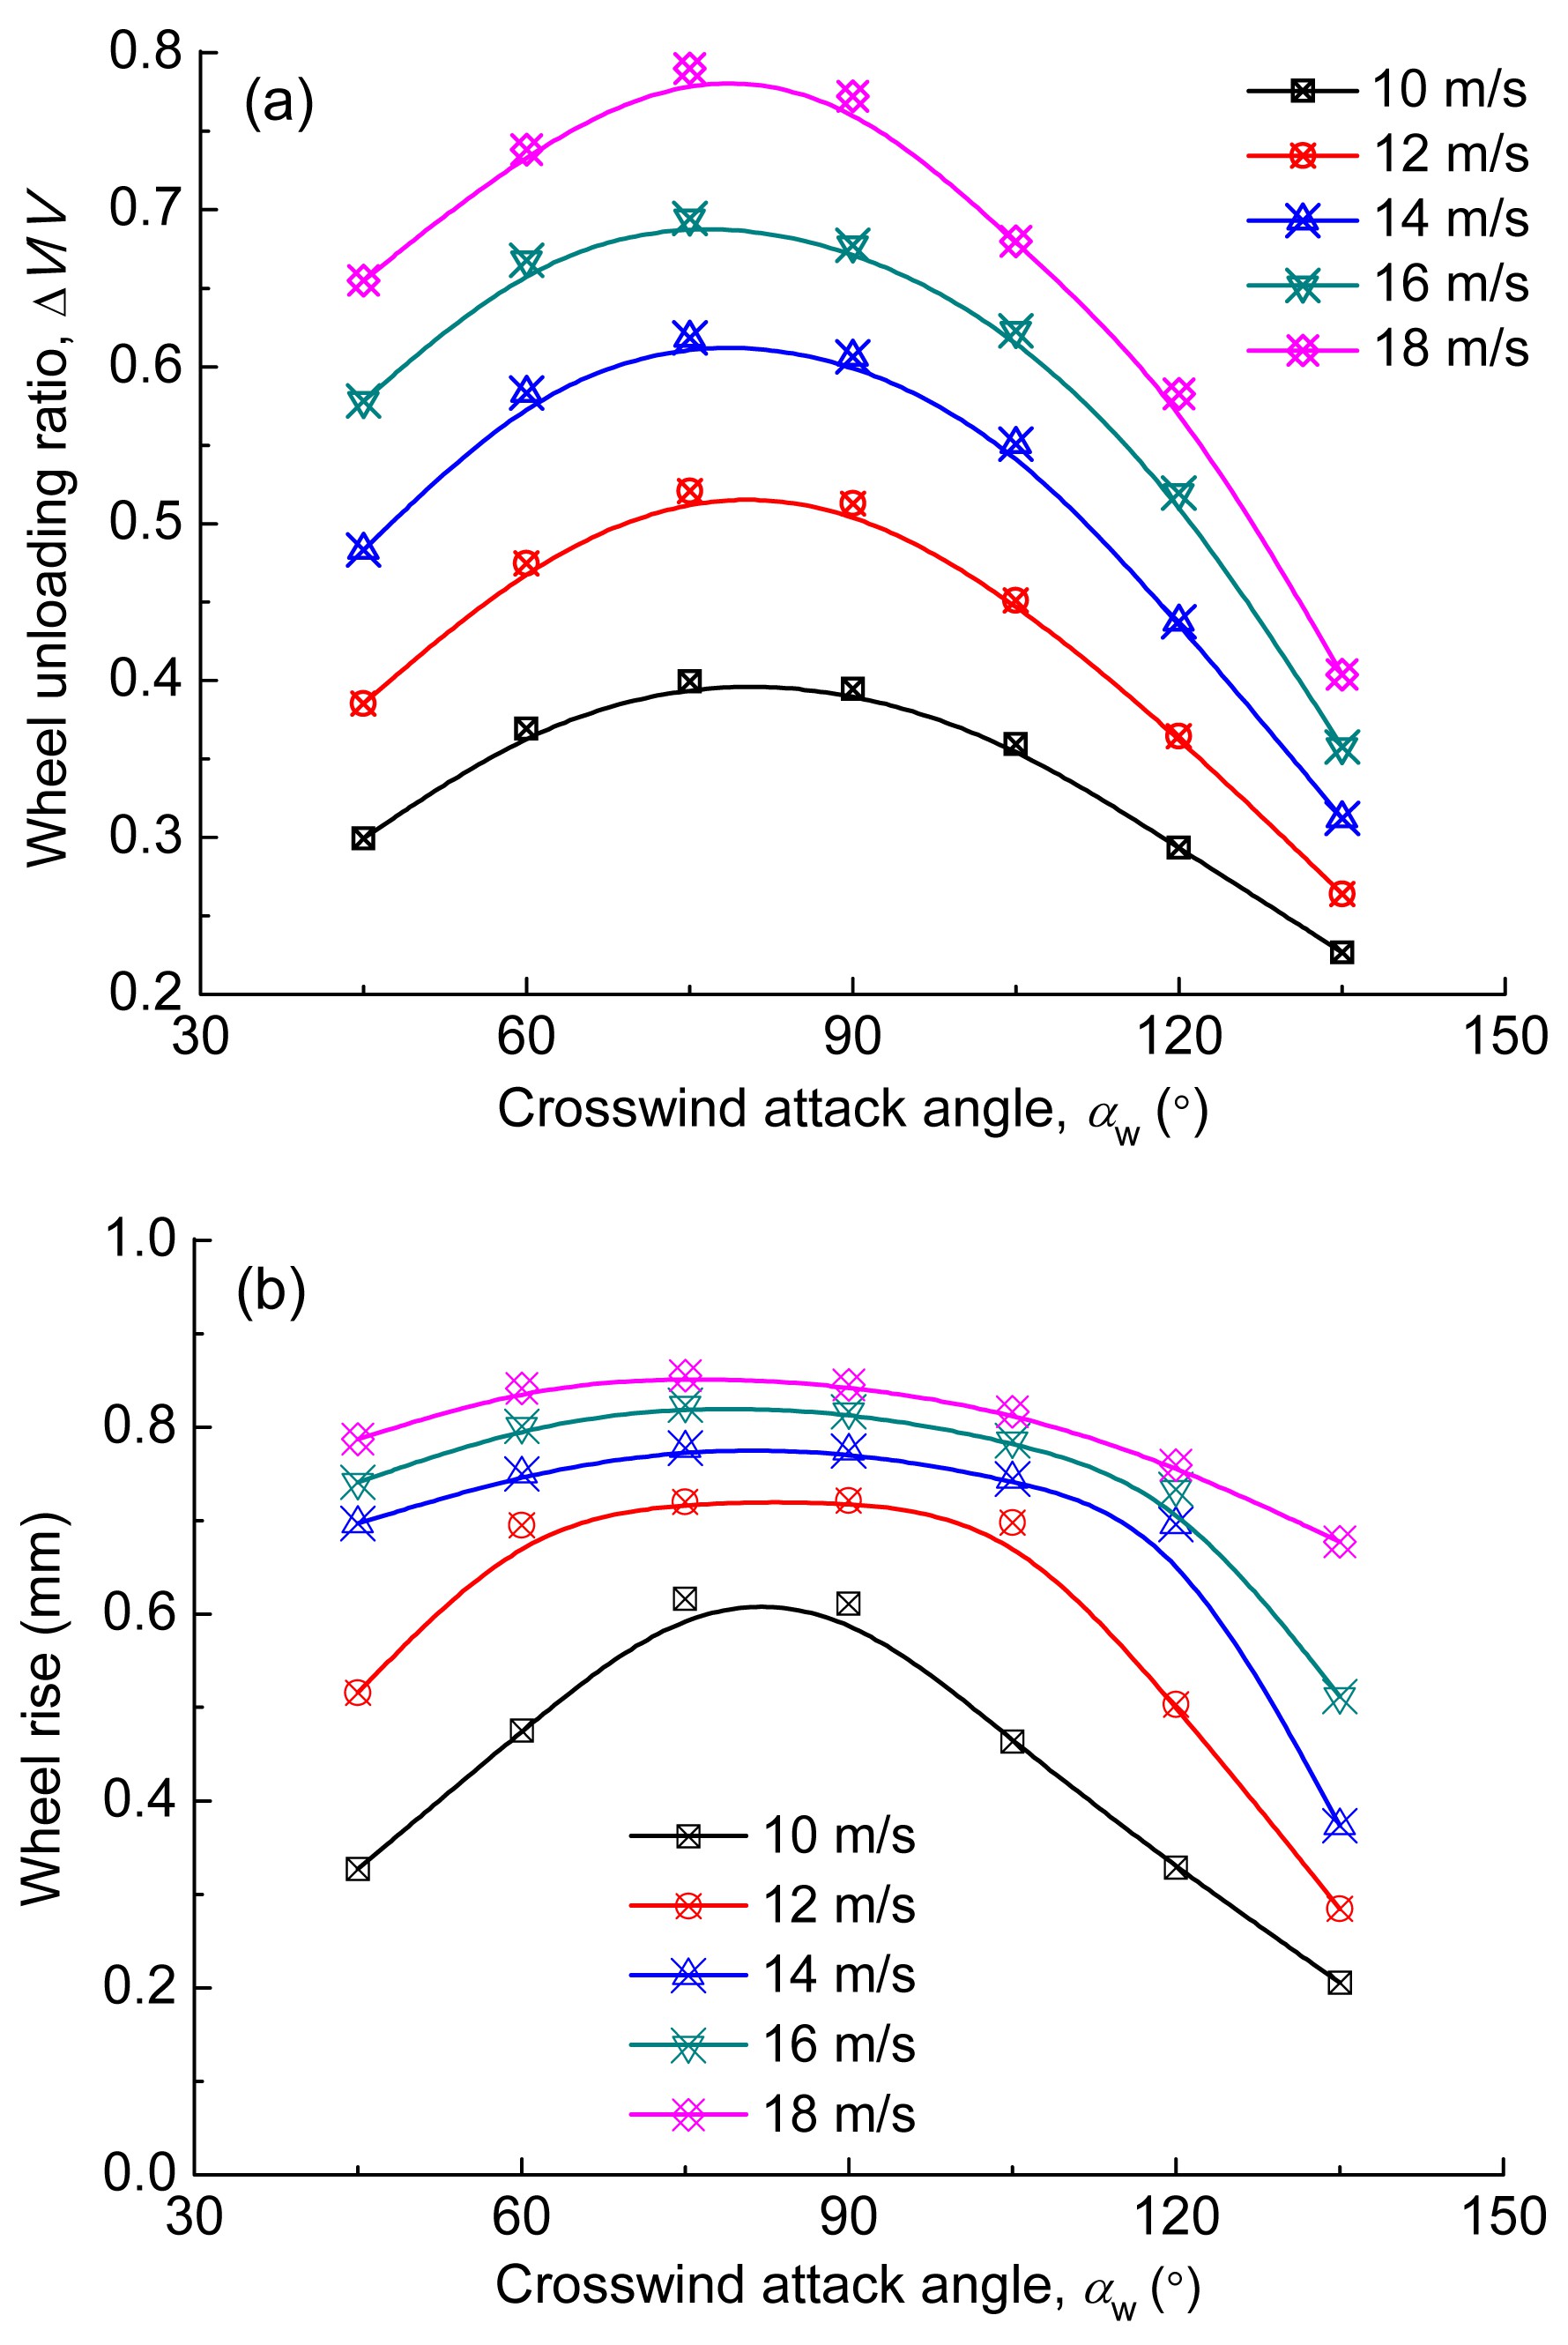
In the calculations described above, only the constant crosswind attack angle was considered. The crosswind attack angle αw can be expected to have a very important effect on the operating safety of the vehicle in crosswinds. Fig. 10 illustrates the effects of the crosswind attack angle αw on the wheel unloading ratio ΔV/V and the wheel rise Zup at various crosswind speeds. In these calculations, the vehicle operating speed was 300 km/h. The values of the other parameters were the same as those in the analysis described in Section 4.1.
Fig.10 Wheel unloading ratio ΔV/V (a) and wheel rise Zup (b) vs. crosswind attack angle αw
As shown in Fig. 10, crosswind attack angles of 75°–90° correspond to the worst-case scenarios. At crosswind attack angles less than 75°, the wheel unloading ratio ΔV/V and the wheel rise Zup increase gradually as αw increases. When αw exceeds 90°, the values of these two derailment criteria decrease as the crosswind attack angle increases. As shown in Fig. 10, at different crosswind speeds considered, the rates of increase in the wheel unloading ratio ΔV/V are almost the same. However, the influence of the crosswind attack angle on the wheel rise Zup is greater at low crosswind speeds than at high crosswind speeds (Fig. 10b). These results indicate that the crosswind attack angle has a considerable effect on the likelihood of derailment and that the crosswind direction should be taken into account in assessing the safety of high-speed railway vehicles in operation.
4.3. Combined effects of vehicle speed and crosswind speed
This section describes an analysis conducted to assess the combined effects of the vehicle speed and the crosswind speed on the derailment behavior of the vehicle. The vehicle speed VT was varied from 200 km/h to 360 km/h, the crosswind speed U was varied from 10 m/s to 40 m/s, and the crosswind attack angle αw was held constant at 90°. The other parameter values were the same as in the analysis described in Section 4.1.
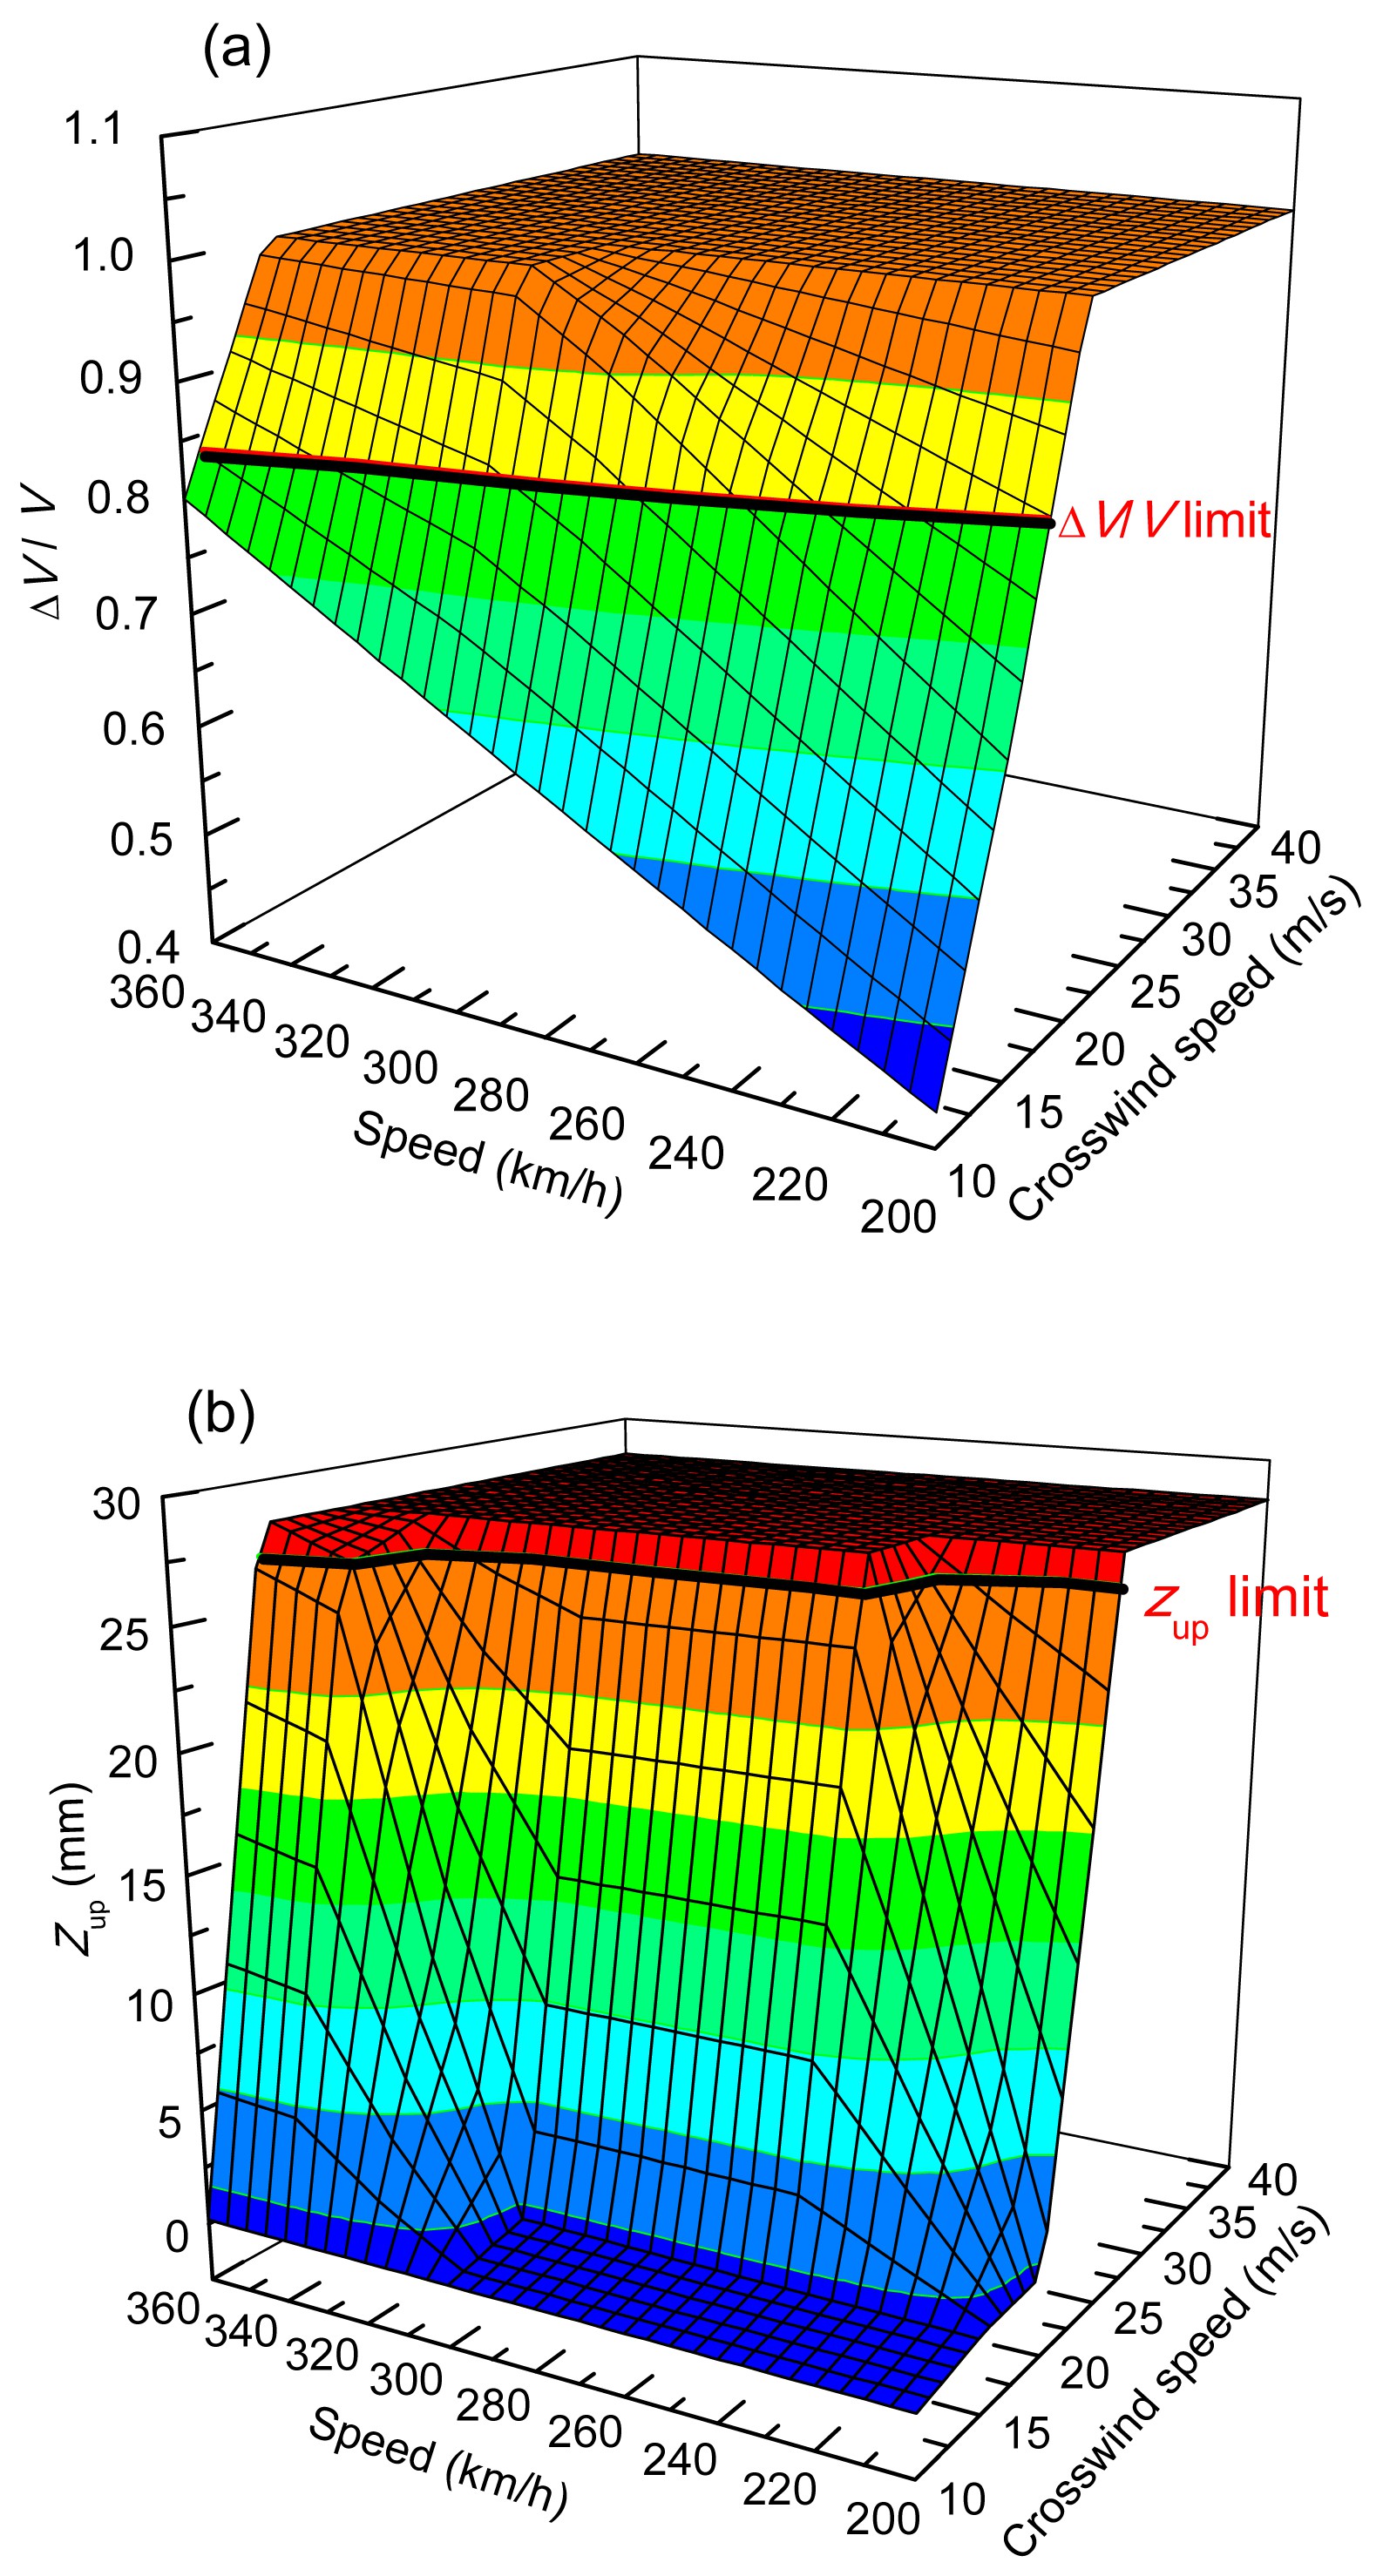
Fig. 11 illustrates the effects of the vehicle speed and crosswind speed on the maximum values of the wheel unloading ratio ΔV/V and the wheel rise Zup for all of the wheelsets. The bold solid line in Fig. 11a indicates the ΔV/V limit value of 0.8 that is used in evaluating the safety operations of high-speed trains in China. The flat top of the curved surface in Fig. 11a indicates that when the wheel unloading ratio reaches 1.0, separation of the windward wheels from the rails occurs for the combinations of vehicle speeds and crosswind speeds that fall within this area. The bold solid line in Fig. 11b indicates the Zup limit value of 28.272 mm. In plotting Fig. 11b, 28.272 mm was assigned to Zup when the wheel rise exceeded 28.272 mm. As a result, the top of the curved surface is flat. The variations in the values of ΔV/V and Zup indicate that both the vehicle speed and the wind speed greatly influence the operating safety of a high-speed train subjected to crosswinds.
Fig.11 Wheel unloading ratio ΔV/V (a) and wheel rise Zup (b) vs. vehicle speed VT and crosswind speed U
As expected, the crosswind speed U greatly affects the wheel load reduction and wheel rise. As the crosswind speed increases, ΔV/V increases linearly (Fig. 11a). For vehicle operating speeds VT<300 km/h and crosswind speeds U<15 m/s, Zup is much less than the limit value of 28.272 mm. Apart from these cases, however, the wheel rise increases rapidly with the mean crosswind velocity. For the range of vehicle speeds considered in this analysis, Zup exceeded the limit at crosswind speeds U>25 m/s (Fig. 11b).
As the vehicle speed increases, the interaction between the vehicle and track increases. Furthermore, increasing the combined wind velocity relative to the vehicle decreases the yaw angle of the combined wind. As shown in Fig. 11, for the range of crosswind speeds considered in this analysis, the rates of increase of the wheel unloading ratio ΔV/V and the wheel rise Zup were almost the same. It is obvious that the operational speed has a great influence on the vehicle operating safety and that decreasing the operating speed decreases the risk of derailment of a railway vehicle in operation.
5. Evaluation of operational safety area for high-speed vehicles under crosswind excitations
To estimate the safety surplus of each criterion limit and identify the overturning boundary of high-speed vehicles subjected to crosswinds, the derailment boundaries determined from the dynamic simulation and the operational safety area defined by the safety assessment criteria discussed in Section 3 were calculated. The analysis results discussed in Section 4 clearly indicate that the crosswind attack angle αw, the vehicle operating speed VT, and the crosswind speed U have a great influence on the operating safety of high-speed vehicles subjected to crosswinds; hence, they were considered in this study to be three key parameters influencing the operating safety of the vehicle.
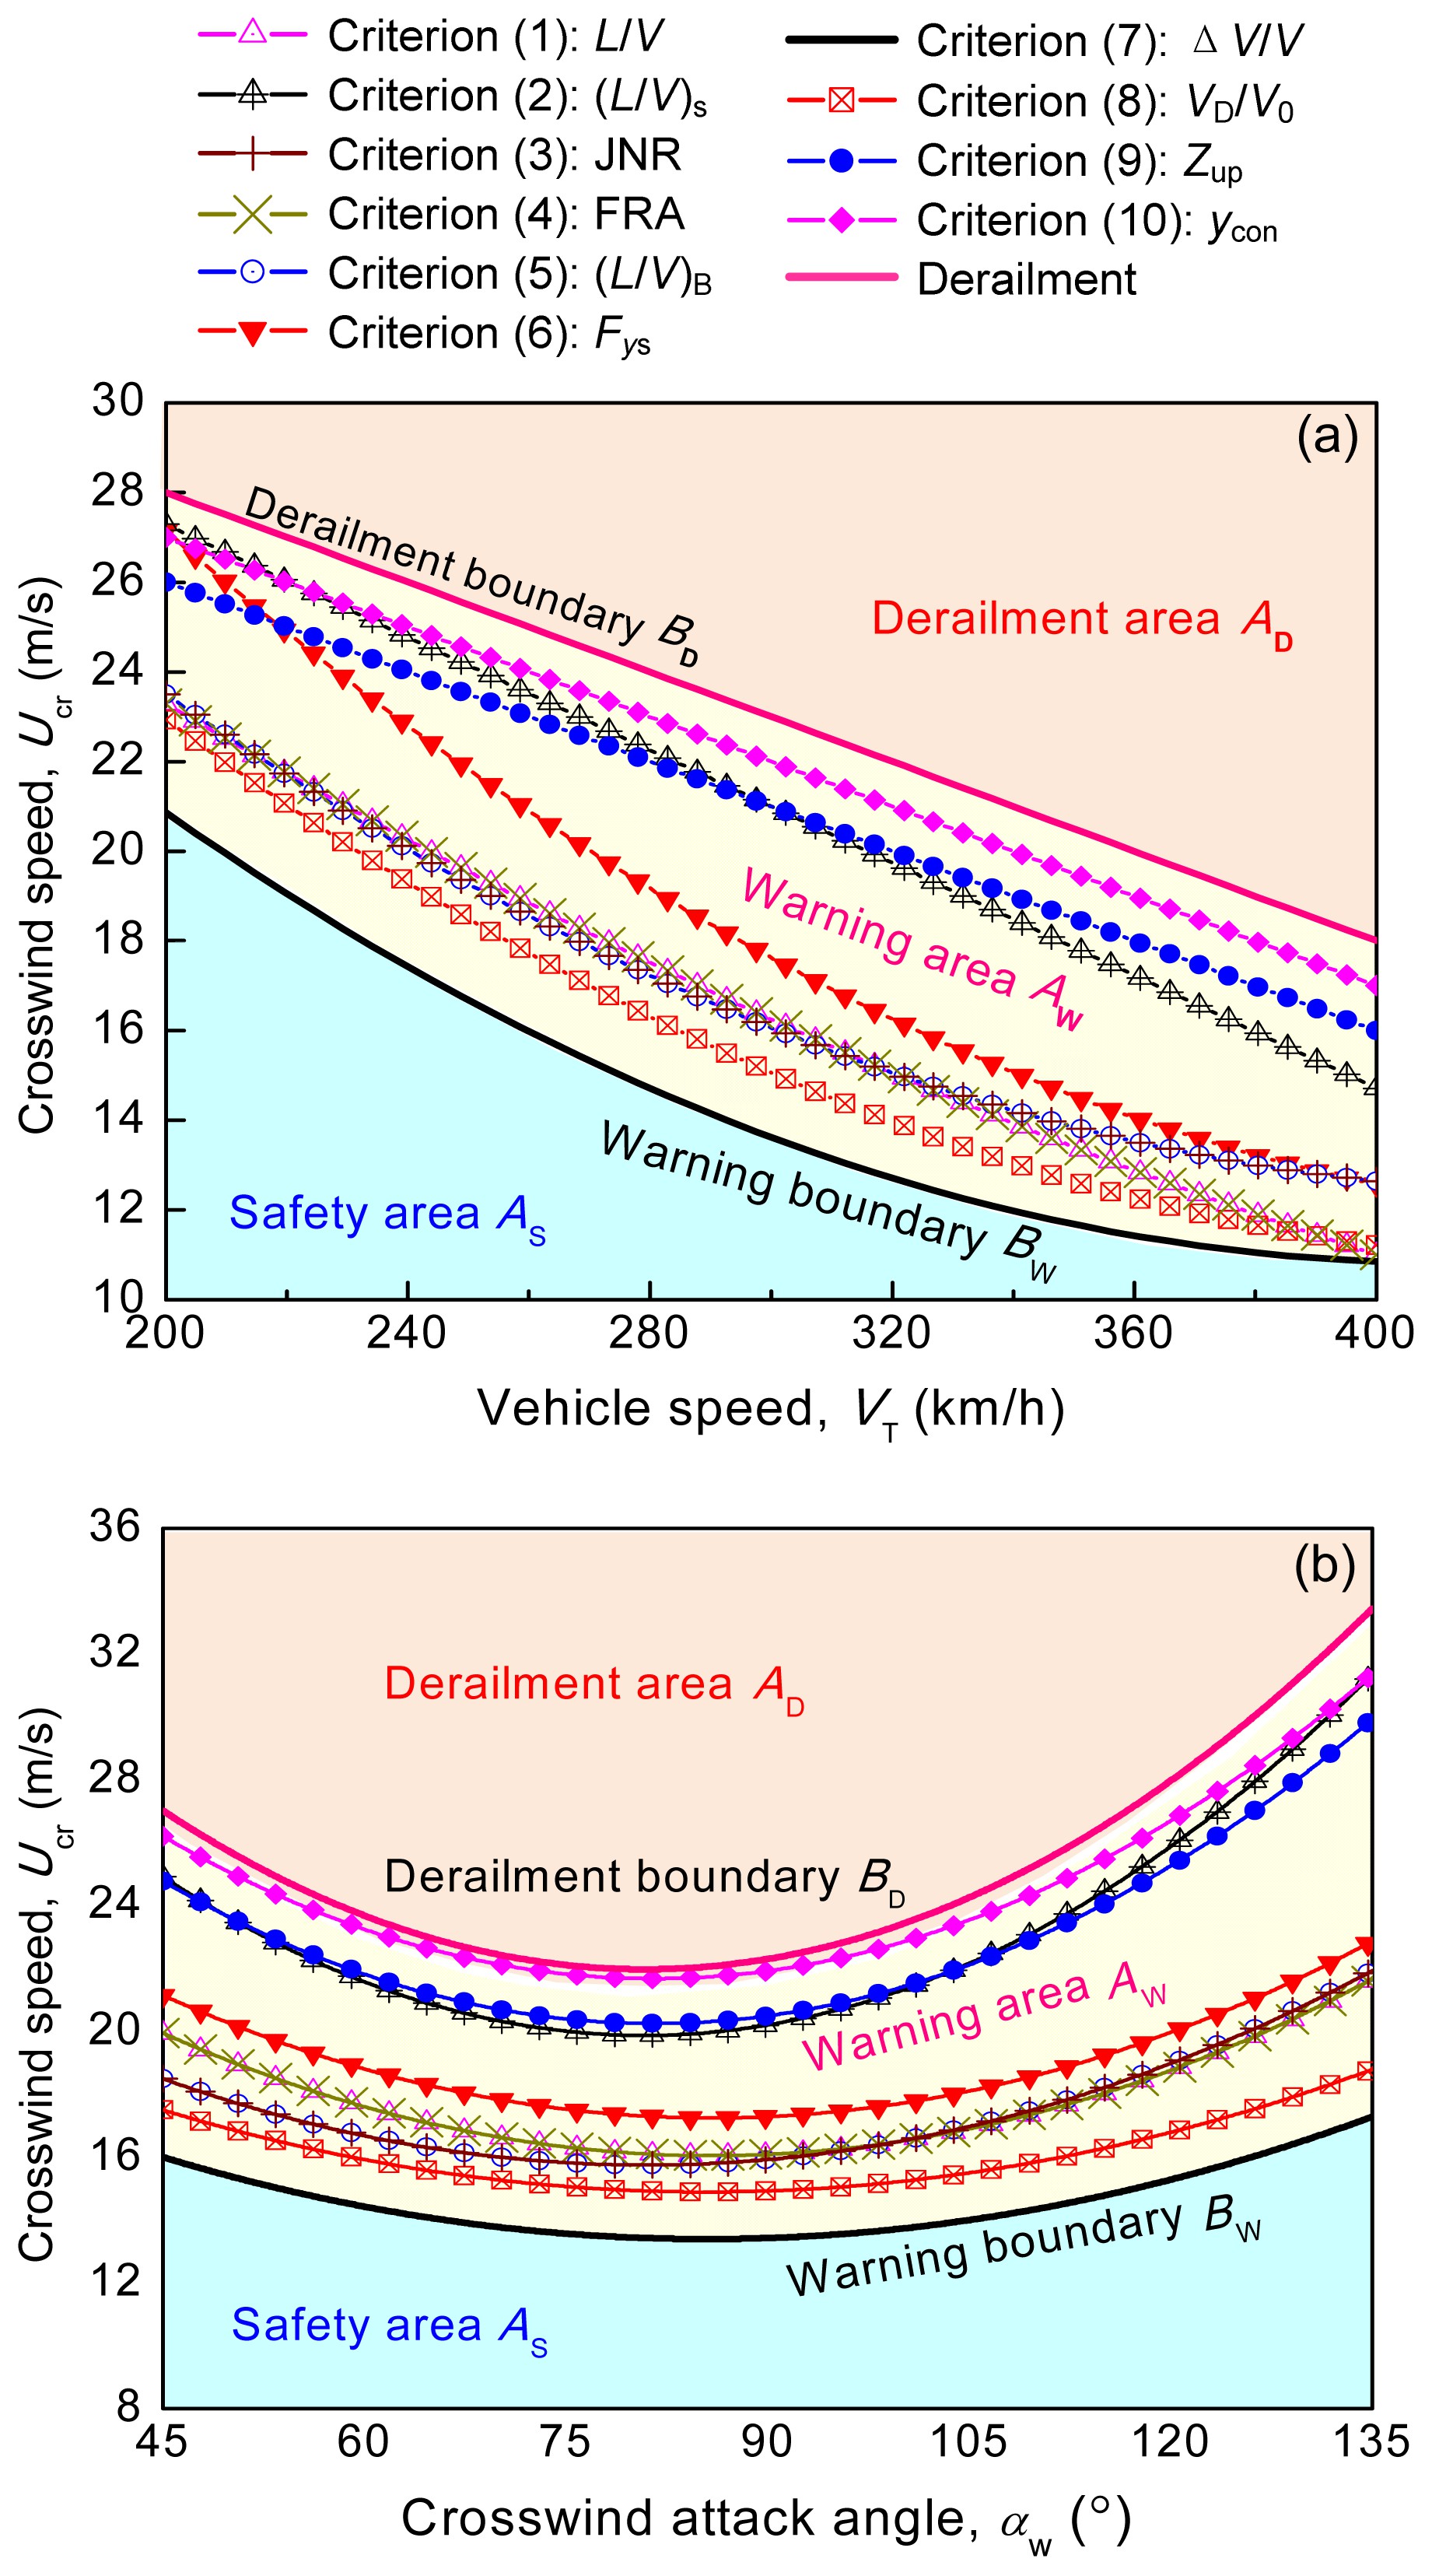
Fig. 12 illustrates the derailment and operational safety boundaries obtained from the results of the dynamic simulation of the vehicle-track coupling for conditions of a tangent track and a steady crosswind. The results shown in Fig. 12a were obtained for crosswinds perpendicular to the direction of the vehicle’s motion (αw=90°) and vehicle speeds VT from 200 km/h to 400 km/h. The results shown in Fig. 12b were obtained for a fixed vehicle speed of 300 km/h and crosswind attack angles αw from 45° to 135°. The boundaries determined by the safety assessment criteria L/V, (L/V)s, T[L/V>0.8], Dis[L/V>0.8], (L/V)B, Fys, ΔV/V, VD/V0, Zup, and ycon were treated as functions of the vehicle operating speed VT and the crosswind attack angle αw. The calculations were conducted for an L/V limit of 0.8, an (L/V)s limit of 1.5, a T[L/V>0.8] limit of 50 ms duration, a Dis[L/V>0.8] limit of 1.5 m, an Fys limit of 10+P0/3, an (L/V)B limit of 0.6, a ΔV/V limit of 0.8, a VD/V0 limit of 0.8, a Zup limit of 28.272 mm, and a ycon limit of −38.875 mm. The operational safety boundaries are defined as the separatrices that clearly indicate the safe operation area AS, the warning area AW, and the derailment area AD. The safe operation area AS and the warning area AW are divided by the warning boundary BW, which is determined by the boundary of the ΔV/V limit, as shown in Fig. 12. The boundary separating the derailment area from the warning area is defined as the derailment boundary BD, as indicated by the upper solid curve in Fig. 12. The derailment boundary BD was determined from the results of the dynamic simulation of the coupled vehicle-track system.
Fig.12 Operational safety boundaries as a function of vehicle speed VT (a) and crosswind attack angle αw (b)
As shown in Fig. 12, the safety boundaries determined by the ΔV/V limit are the lowest, and the operational safety area surrounded by the boundaries of the ΔV/V limit is the smallest. That is to say, the critical crosswind speed Ucr determined by the ΔV/V criterion is the lowest. The limit boundaries of the ycon criterion are close to the derailment (vehicle overturning) boundary BD, which means that the critical crosswind speed Ucr determined by the ycon criterion is the highest. In other words, compared to the other criteria, the ΔV/V limit is the most conservative or the safest criterion for use in estimating the high-speed operational safety of high-speed railway vehicles in crosswinds, whereas the ycon criterion is the least conservative or least safe one. Note that the boundaries determined by the other derailment criterion limits fall between the warning boundary BW and the derailment boundary BD.
Fig. 12 also shows the effects of the vehicle speed VT and the crosswind attack angle αw on the safety boundaries and the critical crosswind speeds. The limiting crosswind Ucr decreases as the vehicle speed increases, as shown in Fig. 12a. At crosswind attack angles of 75° to 90°, the heights of the safety boundaries are the lowest, as shown in Fig. 12b. An increase in the crosswind speed at an attack angle of 75° to 90° could easily lead to the overturning of a high-speed vehicle. A comparison of the limiting values of the crosswind Ucr at an attack angle of 45° (the vehicle operating with the wind) and an attack angle of 135° (the vehicle operating against the wind) shows that the vehicle operating against the crosswind is at a lower risk of derailment.
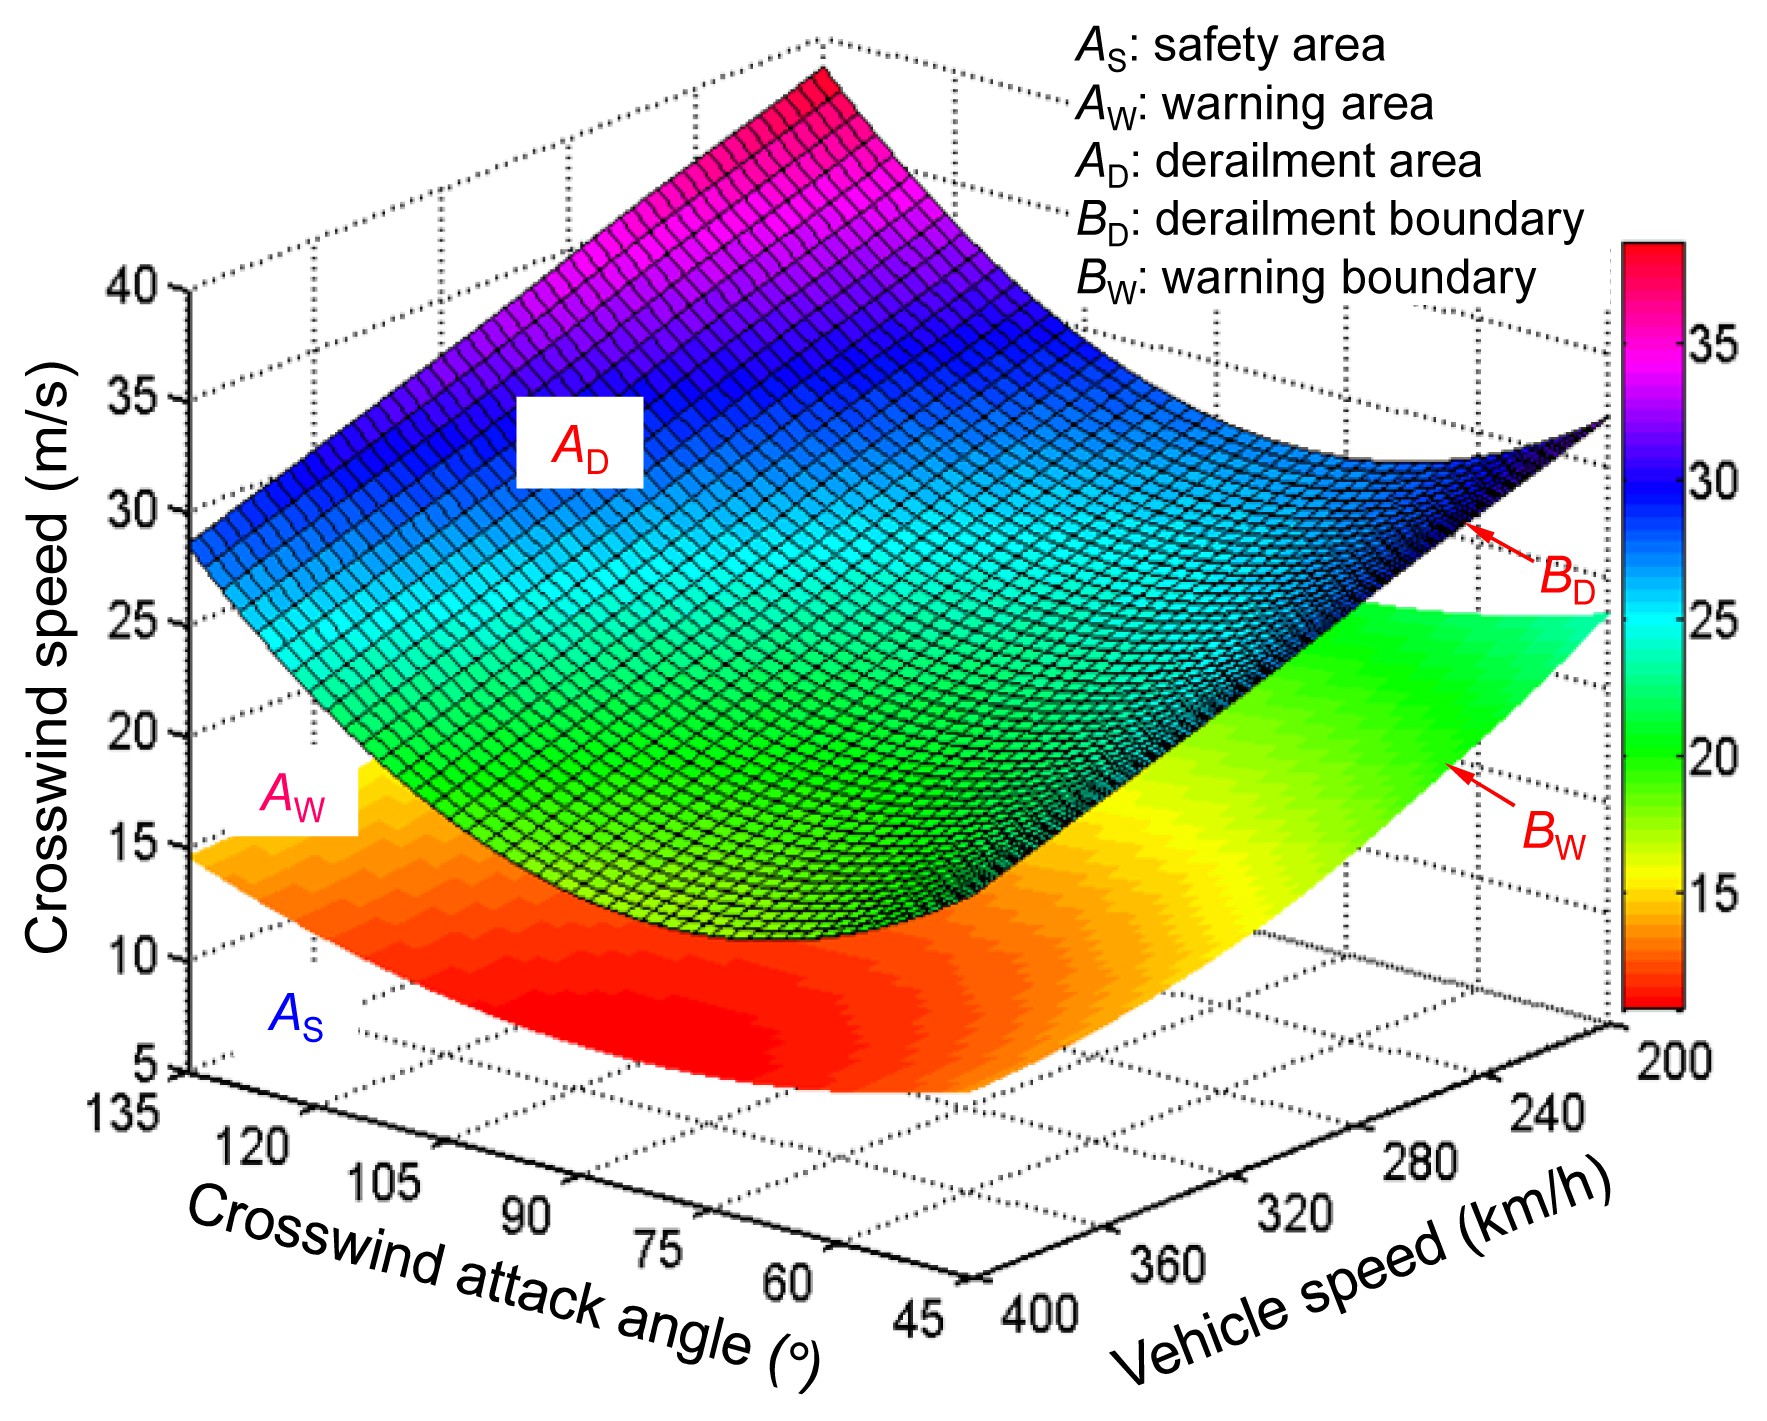
Fig. 13 illustrates the derailment and safety areas for high-speed vehicles in crosswinds for vehicle speeds from 200 to 400 km/h, crosswind attack angles from 45° to 135°, and crosswind speeds from 0 to 40 m/s. The upper curved surface corresponds to the derailment boundary BD, and the lower curved surface corresponds to the boundary BW for the safe operation of high-speed railway vehicles under the given conditions. The boundaries BW and BD divide the domain defined by the three key parameters that influence the dynamic behavior of high-speed railway vehicles subjected to crosswinds into three areas. The three areas are the safety area AS, the warning area AW, and the derailment area AD. The three key factors of influence are the vehicle speed, the crosswind attack angle, and the crosswind speed.
Fig.13 Derailment and safe operation areas in crosswinds
The results shown in Fig. 13 can be used in automatic safety control systems installed on high-speed trains. If the sensors of the automatic safety control systems detect that at a crosswind attack angle of 90°, the vehicle and crosswind speeds approach those at the boundary BD or drop into the warning area AW, the vehicle speed can be reduced rapidly to ensure the safe operation of the high-speed train.
6. Conclusions
In this study, a dynamic model for a coupled vehicle-track system was developed to investigate the effect of crosswinds on the operating safety of high-speed railway vehicles. The steady aerodynamic forces caused by crosswinds were modeled as ramp-shaped external forces exerted on the vehicle. Numerical analyses were conducted to investigate the dynamic responses and the dynamic derailment mechanism of a high-speed vehicle in strong crosswind scenarios. The effects of the crosswind speed, crosswind attack angle, and vehicle speed on the operating safety of the vehicle were examined. The operational safety area, warning area, and derailment area and their boundaries were defined and were calculated using the dynamic coupled vehicle-track model and existing criterion limits. The results obtained clearly indicate the operational safety surplus of each derailment criterion for a high-speed train operating in crosswinds, namely, the gap between the criterion limit boundary and the derailment boundary. The following conclusions can be drawn from the numerical results.
The crosswind has a great influence on the ride comfort and safety of railway passengers. As the crosswind speed increases, the dynamic responses of the car body and the wheel-rail forces increase linearly. Flange climbing does not play a key role in the likelihood of derailment of high-speed railway vehicles subjected to strong crosswinds. Overturning usually occurs when a vehicle enters into a crosswind scenario.
The crosswind attack angle, vehicle speed, and wind speed have a great influence on the operating safety and the likelihood of overturning of a high-speed vehicle operating in crosswinds. As the crosswind speed and vehicle speed increase, the wheel unloading ratio and the wheel rise increase linearly. Crosswind attack angles of 75° to 90° correspond to the worst-case scenarios and have the greatest influence on the likelihood of derailment of such vehicles. The crosswind direction should also be taken into account in assessing the safety of high-speed railway vehicles operating in crosswinds.
The wheelset unloading ratio ΔV/V determines the boundary of the common safety area, which is the smallest area defined by the three key factors of influence. This area is considered the safety area for high-speed trains operating in crosswinds. The three key factors of influence are the vehicle speed, the crosswind speed, and the attack angle.
Note that the crosswind scenarios considered involved constant mean wind speeds in this study. In fact, real crosswind scenarios are unsteady and involve fluctuating wind speeds. Unsteady models, such as the “Chinese Hat” wind gust model (CEN, 2010) or the “stochastic process” crosswind model (RSSB, 2000; Cheli et al., 2006; Xu and Ding, 2006), should be considered for use in future research.
It is not common to use a vehicle-track coupling model to evaluate the operating safety of railway vehicles operating in crosswinds. However, the dynamic behavior of vehicles subjected to crosswinds is influenced by many factors, some of which are unknown. Further research should be carried out to assess the sensitivity of the results to the parameters of the dynamic vehicle and track models. The proposed model can be used to assess the most important physical effects that should be modeled in dynamic simulation.
Because the aerodynamic characteristics of different vehicles in the same train may be different, the proposed vehicle-track coupling model needs to be improved to characterize the dynamic behavior of train-track interaction in severe crosswind conditions.
[1] Baker, C., Calleja, F., Jones, J., 2004. Measurements of the cross wind forces on trains. Journal of Wind Engineering and Industrial Aerodynamics, 92(7-8):547-563.
[2] Baker, C., Cheli, F., Orellano, A., 2009. Cross wind effects on road and rail vehicles. Vehicle System Dynamics, 47(8):983-1022.
[3] Carrarini, A., 2006. Reliability Based Analysis of the Crosswind Stability of Railway Vehicles. PhD Thesis, Berlin Institute of Technology,Berlin, Germany :
[5] Cheli, F., Belforte, P., Melzi, S., 2006. Numerical-experimental approach for evaluating cross-wind aerodynamic effects on heavy vehicles. Vehicle System Dynamics, 44(sup1):791-804.
[6] Cheli, F., Ripamonti, F., Rocchi, D., 2010. Aerodynamic behaviour investigation of the new EMUV250 train to cross wind using wind tunnel tests and CFD analysis. Journal of Wind Engineering and Industrial Aerodynamics, 98(4-5):189-201.
[7] Chen, G., Zhai, W.M., 2004. A new wheel/rail spatially dynamic coupling model and its verification. Vehicle System Dynamics, 41(4):301-322.
[8] Diedrichs, B., 2005. Computational Methods for Crosswind Stability of Railway Trains: A Literature Survey. Department of Aeronautical and Vehicle Engineering, Royal Institute of Technology,Stockholm, Sweden :26-36.
[10] Fujii, T., Maeda, T., Ishida, H., 1999. Wind induced accidents of train vehicles and their measures in Japan. Quarterly Report of RTRI, 40(1):50-55.
[11] Gawthorpe, R.G., 1994. Wind effects on ground transportation. Journal of Wind Engineering and Industrial Aerodynamics, 52:73-92.
[12] Jin, X.S., Xiao, X.B., Ling, L., 2013. Study on safety boundary for high-speed trains running in severe environments. International Journal of Rail Transportation, 1(1-2):87-108.
[13] Kalker, J.J., 1967. On the Rolling Contact of Two Elastic Bodies in the Presence of Dry Friction. PhD Thesis, Delft University,the Netherlands :
[14] Knothe, K., Grassie, S.L., 1993. Modeling of railway track and vehicle/track interaction at high frequencies. Vehicle System Dynamics, 22(3-4):209-262.
[15] Ling, L., Xiao, X.B., Jin, X.S., 2012. Study on derailment mechanism and safety operation area of high speed trains under earthquake. Journal of Computational and Nonlinear Dynamics, 7(4):041001
[16] Nadal, M.J., 1896. Theorie de stabilit’e des Locomotives, part 2, Mouvement de Lacet. Annales des Mines 10, (in French),:232
[20] Shen, Z.Y., Hedrick, J.K., Elkins, J.A., 1983. A comparison of alternative creep-force models for rail vehicle dynamic analysis. Vehicle System Dynamics, 12(1-3):79-83.
[21] Silla, A., Kallberg, V.P., 2012. The development of railway safety in Finland. Accident Analysis & Prevention, 45:737-744.
[22] Weinstock, H., 1984. Wheel climb derailment criteria for evaluation of rail vehicle safety. , Proceedings of the ASME Winter Annual Meeting, New York, USA, 1-7. :1-7.
[23] Wilson, N., Fries, R., Witte, M., 2011. Assessment of safety against derailment using simulations and vehicle acceptance tests: a worldwide comparison of state-of-the-art assessment methods. Vehicle System Dynamics, 49(7):1113-1157.
[24] Wu, H., Wilson, N., 2006. Railway vehicle derailment and prevention. Handbook of Railway Vehicle Dynamics. Taylor & Francis,London, UK :209-238.
[25] Xiao, X.B., Jin, X.S., Deng, Y.Q., 2008. Effect of curved track support failure on vehicle derailment. Vehicle System Dynamics, 46(11):1029-1059.
[26] Xiao, X.B., Jin, X.S., Wen, Z.F., 2011. Effect of tangent track buckle on vehicle derailment. Multibody System Dynamics, 25(1):1-41.
[27] Xinhua News Agency, 2007. Train overturned by strong wind in NW China. China Daily, Feb. 28, :
[28] Xu, Y.L., Ding, Q.S., 2006. Interaction of railway vehicles with track in cross-winds. Journal of Fluids and Structures, 22(3):295-314.
[29] Yokose, K., 1966. A theory of the derailment of a wheelset. Quarterly Report of RTRI, 7(3):30-34.
[30] Zhai, W.M., Cai, C.B., Guo, S.Z., 1996. Coupling model of vertical and lateral vehicle/track interactions. Vehicle System Dynamics, 26(1):61-79.
Open peer comments: Debate/Discuss/Question/Opinion


Open peer comments: Debate/Discuss/Question/Opinion
<1>