Soil bacterial and fungal community successions under the stress of chlorpyrifos application and molecular characterization of chlorpyrifos-degrading isolates using ERIC-PCR*
Affiliation(s):
1.
Department of Plant Protection, College of Agriculture & Biotechnology, Zhejiang University, Hangzhou 310029, China; moreAffiliation(s): 1.
Department of Plant Protection, College of Agriculture & Biotechnology, Zhejiang University, Hangzhou 310029, China; 2.
State Key Laboratory Breeding Base for Zhejiang Sustainable Pest and Disease Control, Institute of Plant Protection and Microbiology, Zhejiang Academy of Agricultural Sciences, Hangzhou 310021, China; less
Lie-zhong Chen, Yan-li Li, Yun-long Yu. Soil bacterial and fungal community successions under the stress of chlorpyrifos application and molecular characterization of chlorpyrifos-degrading isolates using ERIC-PCR[J]. Journal of Zhejiang University Science B, 2014, 15(4): 322-332.
@article{title="Soil bacterial and fungal community successions under the stress of chlorpyrifos application and molecular characterization of chlorpyrifos-degrading isolates using ERIC-PCR", author="Lie-zhong Chen, Yan-li Li, Yun-long Yu", journal="Journal of Zhejiang University Science B", volume="15", number="4", pages="322-332", year="2014", publisher="Zhejiang University Press & Springer", doi="10.1631/jzus.B1300175" }
%0 Journal Article %T Soil bacterial and fungal community successions under the stress of chlorpyrifos application and molecular characterization of chlorpyrifos-degrading isolates using ERIC-PCR %A Lie-zhong Chen %A Yan-li Li %A Yun-long Yu %J Journal of Zhejiang University SCIENCE B %V 15 %N 4 %P 322-332 %@ 1673-1581 %D 2014 %I Zhejiang University Press & Springer %DOI 10.1631/jzus.B1300175
TY - JOUR T1 - Soil bacterial and fungal community successions under the stress of chlorpyrifos application and molecular characterization of chlorpyrifos-degrading isolates using ERIC-PCR A1 - Lie-zhong Chen A1 - Yan-li Li A1 - Yun-long Yu J0 - Journal of Zhejiang University Science B VL - 15 IS - 4 SP - 322 EP - 332 %@ 1673-1581 Y1 - 2014 PB - Zhejiang University Press & Springer ER - DOI - 10.1631/jzus.B1300175
Abstract: Chlorpyrifos is a widely used insecticide in recent years, and it will produce adverse effects on soil when applied on crops or mixed with soil. In this study, nested polymerase chain reaction (PCR) and denaturing gradient gel electrophoresis (DGGE) were combined to explore the bacterial and fungal community successions in soil treated with 5 and 20 mg/kg of chlorpyrifos. Furthermore, isolates capable of efficiently decomposing chlorpyrifos were molecular-typed using enterobacterial repetitive intergenic consensus-PCR (ERIC-PCR). Under the experimental conditions, degradation of chlorpyrifos in soil was interpreted with the first-order kinetics, and the half-lives of chlorpyrifos at 5 and 20 mg/kg doses were calculated to be 8.25 and 8.29 d, respectively. DGGE fingerprint and principal component analysis (PCA) indicated that the composition of the fungal community was obviously changed with the chlorpyrifos treatment, and that samples of chlorpyrifos treatment were significantly separated from those of the control from the beginning to the end. While for the bacterial community, chlorpyrifos-treated soil samples were apparently different in the first 30 d and recovered to a similar level of the control up until 60 d, and the distance in the PCA between the chlorpyrifos-treated samples and the control was getting shorter through time and was finally clustered into one group. Together, our results demonstrated that the application of chlorpyrifos could affect the fungal community structure in a quick and lasting way, while only affecting the bacterial community in a temporary way. Finally, nine typical ERIC types of chlorpyrifos-degrading isolates were screened.
Darkslateblue:Affiliate; Royal Blue:Author; Turquoise:Article
Article Content
1. Introduction
Chlorpyrifos is a broad-spectrum moderately toxic organophosphorus insecticide. It is widely applied to prevent pests like stem borers, army worm, coccid, and aphids. Whether sprayed on the crops or mixed with soil, eventually there will be a large number of chlorpyrifos entered into the soil environment. The half-life of chlorpyrifos in soil usually ranges from 60 to 120 d, while sometimes less than two weeks, and sometimes greater than one year, depending on soil type, soil microorganisms, and climate conditions (Anwar et al., 2009). The residues of chlorpyrifos in soils may affect the stability of the soil microbial community and function (Kulkarni et al., 2000). Soil microorganisms participating in the decomposition and transformations of soil materials are important factors influencing the fertility of soil, thus they play an important role in the sustainable utilization of soil (Sebiomo et al., 2011). Interactions between chlorpyrifos and soil microorganisms, including microbial biomass carbon and nitrogen, microbial populations, microbial functional diversity, microbial respiration, enzymatic activities, and nitrogen cycling, have been widely studied (Sardar and Kole, 2005; Pandey and Singh, 2006; Fang et al., 2009; Xie et al., 2010). In addition, many strains capable of degrading chlorpyrifos have been isolated to amend the chlorpyrifos-polluted environment (Maya et al., 2011). However, the successions of soil bacterial and fungal community structures, which can truly reveal dynamic changes of microbes, have remained unknown. Furthermore, different chlorpyrifos-degrading isolates may exist in different soil environments.
Denaturing gradient gel electrophoresis (DGGE) originally developed in the 1980s (Muyzer et al., 1993) has been widely used in characterizations of soil bacterial and fungal communities. In DGGE, DNA fragments of the same length but of different sequences can be separated. DGGE profiles can visualize what constitute all the major microorganisms, and provide data for difference analysis in the tested samples. Although DGGE has numerous advantages, it cannot obtain functional strains for deep analysis and practical application. Traditional isolation of microbes will make up for the disadvantage and obtain a large number of cultural strains. Enterobacterial repetitive intergenic consensus (ERIC) (Sampaio et al., 2006) sequences are repetitive elements distributed along the bacterial chromosome of Gram-negative bacteria, at intergenic regions of polycistronic operons or flanking open reading frames. ERIC-polymerase chain reaction (PCR) relying on the amplification of genomic DNA fragments using different sets of primers complimentary to the short repetitive sequences has been observed with extremely good discriminatory index and reproducibility for molecular typing of microbes (Gillings and Holley, 1997; Yuan et al., 2010).
In this study, we aimed to reveal the response of soil bacterial and fungal community structures to chlorpyrifos applications, furthermore, to molecular characterize chlorpyrifos-degrading strains isolated from chlorpyrifos-contaminated soil by ERIC-PCR.
2. Materials and methods
2.1. Chemicals and media
Chlorpyrifos standard (≥99.5%) was purchased from the Beijing Cubic Joint Institute of Chemical Technology, China. Acetone and petroleum ether (60–90 °C) of analytical grade were purchased from the Changqing Chemical Co., Hangzhou, China. Commercial formulation of chlorpyrifos (Dursban, 48%) was purchased from an agro-chemical store.
Mineral salt medium (MM) was constituted by 5.0 g of (NH4)2SO4, 1.0 g of KH2PO4, 0.1 g of NaCl, 0.5 g of MgSO4·7H2O, 0.1 g of CaCl2, and 0.2 g of yeast extract in 1000 ml distilled water. MM medium containing 40 mg/L of chlorpyrifos (MMC) as the single carbon source was used for enriching and screening chlorpyrifos-degrading strains. Luria-Bertani medium, Czapek’s agar medium, and Gause’s agar medium were used to isolate the chlorpyrifos-degrading strains.
2.2. Soil samples and soil treatment
Soil was collected from experimental plots untreated with chlorpyrifos in the most recent five years located at Zhejiang Academy of Agricultural Sciences, Hangzhou, China. Soil samples taken from the top layer (0–15 cm) were mixed thoroughly and air-dried in the shade at room temperature, and then passed through a 2-mm sieve to remove any stones and debris. Its major characteristics were as follows: sand, 25.5%; silt, 70.1%; clay, 4.4%; organic matter, 3.95%; water holding capacity, 35.4%; cationic exchange capacity, 10.6 cmol/kg; total nitrogen, 0.14%; and, pH 6.8.
Soil samples (5 kg) were first pre-incubated in the dark for one week at 25 °C, and then chlorpyrifos commercial formulation following proper dilution with distilled water was added to give a final concentration of 5 and 20 mg/kg corresponding to the recommended dose and quadruple dose, respectively. Soil samples with the same amount of sterilized water without adding chlorpyrifos were used as the control, whose water content reached 10%. Soil water content was maintained by the regular addition of distilled water every one week. Each treatment was conducted three times. At the intervals of 1, 7, 15, 30, 45 and 60 d after treatment, using five-spot sampling method, soil samples (about 500 g) were obtained to determine the chlorpyrifos residues and to extract soil DNA for PCR-DGGE analysis. Furthermore, chlorpyrifos-treated soil samples were used to isolate the potential strains capable of degrading chlorpyrifos at the end of the experiment.
2.3. Determination of chlorpyrifos residues in soil
The soil sample (20 g) was suspended in 140 ml of acetone-petroleum ether mixture (1:1) in a 300-ml Erlenmeyer flask on a rotary shaker under 30 °C. After 2 h, soil suspensions were then filtered through a filter paper, and the filter residue was rinsed three times with 20 ml of acetone-petroleum ether mixture (1:1, v/v). The filtrate (approximately 200 ml) was gathered in a 300-ml separatory funnel, and was further extracted three times with 50 ml of 3% sodium sulfate to eliminate any acetone. The mixture of acetone and 3% sodium sulfate was then extracted three times with 40 ml of petroleum ether. Approximately 220 ml of ethereal extract was collected in a 300-ml flat-bottom flask, dried by anhydrous sodium sulfate overnight, and then filtered. The filtrate was concentrated on a rotary evaporator till it was almost dry, and then ultrasound-dissolved with methanol. The final volume was made up to 10.0 ml before gas chromatography-electron capture detector (GC-ECD) analysis. The residue of chlorpyrifos was determined using GC (GC-14B, Shimadzu, Japan) equipped with an ECD and an SPB-5 quarz capillary column (30 m×0.53 mm×0.10 μm). Operating conditions were as follows: detector, 280 °C; injector port, 260 °C; carrier gas (N2) flow rate, 100 ml/min; and, injection volume, 2 μl.
2.4. DNA extraction
The soil sample (0.25 g) was weighed to extract soil DNA using the soil DNA isolation kit (MoBio Laboratories, Solana Beach, CA). A microbe with a logarithmic growth phase was utilized to extract the microbial DNA via the ultraclean microbial DNA isolation kit (MoBio Laboratories, Solana Beach, CA). All the operations were carried out according to the manufacturer’s instructions except that vortex mixing was used instead of a 2×30 s bead-beating.
2.5. PCR amplifications
All PCRs were performed in an automated thermal cycler (Mastercycler, Eppendorf). Amplifications were carried out in a final volume of 50 μl containing 1× PCR buffer, 5 mmol/L MgCl2, 2 mmol/L dNTP’s, 10 μmol/L each of primers, 2.5 U TransStart Taq DNA polymerase from Transgene, and 1 μl (∼10 ng) DNA template (chromosomal DNA or diluted PCR product).
ERIC-PCR analysis: ERIC (5'-AAG TAA GTG ACT GGG GTG AGC G-3') and ERIC-R (5'-ATG TAA GCT CCT GGG GAT TCA C-3') were applied to carry out molecular typing of chlorpyrifos-degrading strains. The thermal cycling scheme was heated to 95 °C for 5 min, then 30 cycles were run at 95 °C for 40 s, 52 °C for 90 s, and 65 °C for 2 min, and finally 65 °C for 10 min.
Fungal community analysis: ITS1f (5'-CTT GGT CAT TTA GAG GAA GTA A-3') and ITS1f-gc (5'-CGC CCG CCG CGC GCG GCG GGC GGG GCG GGG GCA CGG GGG GCT TGG TCA TTT AGA GGA AGT AA-3') were used for forward primers. ITS2 (5'-GCT GCG TTC TTC ATC GAT GC-3') and ITS4 (5'-TCC TCC GCT TAT TGA TAT GC-3') were used for reverse primers (Valášková and Baldrian, 2009). ITS1 region of fungal ribosomal DNA (rDNA) was amplified by nested PCR. With primer pair ITS1f/ITS4 and soil DNA as the template in the first round of PCR testing, amplified products of 700–900 bp comprising both ITS1 and ITS2 regions were obtained. With primer pair ITS1f-gc/ITS2 and the first-round PCR products, using the 10× dilution as a template in the second round of PCR testing, the ITS1 region about 200–300 bp was specifically amplified. The PCR included a 4-min denaturation step at 94 °C followed by 35 thermal cycles of 1 min at 94 °C, 30 s at 52 °C, and 1 min at 72 °C, and a final extension at 72 °C for 10 min.
Bacterial community analysis: 16S rDNA PCR amplification was carried out using the soil DNA as the template and bacterial-specific primers, 8F (5'-AGA GTT TGA TCC TGG CTC AG-3') and 1492R (5'-GGT TAC CTT GTT ACG ACT T-3'). A nested PCR for the V3 region was performed on the 8F/1492R PCR products using the 341F-gc (5'-CGC CCG CCG CGC GCG GCG GGC GGG GCG GGG GCA CGG GGG GCC TAC GGG AGG CAG CAG-3') and 518R (5'-ATT ACC GCG GCT GCT GG-3') primers (Valášková and Baldrian, 2009). The PCR included a 4-min denaturation step at 94 °C followed by 35 thermal cycles of 1 min at 94 °C, 30 s at 52 °C, and 90 s at 72 °C, and a final extension at 72 °C for 10 min.
All the PCR products were resolved by 1.0% agarose gel electrophoresis and gel image was photographed with Tanon-2500 (Shanghai, China). The amplified products with a GC clamp were stored at −20 °C for subsequent DGGE analysis.
2.6. Analysis of PCR products by DGGE
The DCode Universal Mutation Detection System (Bio-Rad, CA, USA) was used for DGGE analysis (Li et al., 2008). Approximately 20 μl PCR products mixed with 10 μl 3× loading buffer were loaded into a 8% (w/v) polyacrylamide gel with a linear denaturing gradient from 40% to 55% for ITS1f-gc/ITS2 amplicons and 45% to 60% for 341F-gc/518R amplicons (100% denaturant corresponds to 40% formamide and 7 mol/L urea). The gel was run for 15 h under 45 V in 1× Tris-acetate-EDTA (TAE) buffer at a constant temperature of 60 °C. After electrophoresis, the gel was stained for 20 min in an ethidium bromide solution (0.5 mg/L), and then destained for 30 min in distilled water. The DGGE profile image was digitally captured and saved in a Tanon 2500 gel image system.
2.7. Enrichment and isolation of chlorpyrifos-degrading strains
The soil samples (5 g) were first inoculated in 300-ml Erlenmeyer flasks containing 50 ml MMC, and then incubated under the condition of 30 °C on a shaker at 200g for 4 d. One milliliter culture broth was transferred to 50 ml fresh MMC for another 4 d, and this procedure was done four times. After four rounds of enrichment culture, culture broth was gradient diluted and spread on plates of Luria-Bertani, Czapek’s, and Gause’s solid media. After 1-d incubation under 37 °C for bacteria and 3-d incubation under 30 °C for fungi, 9 strains of bacteria and 17 strains of fungi were obtained. To test their ability in degrading chlorpyrifos, screened cultures were inoculated in 50 ml MMC. After shaking under 30 °C for 7 d, the residue of chlorpyrifos was measured according to the method of Yu et al. (2006). MMC without cultures was used as a control. Each treatment was conducted three times.
2.8. DNA sequence analysis for chlorpyrifos-degrading strains
PCR products of primer pairs 8F/1492R for bacterial strains and ITS1f/ITS4 for fungal strains were ligated with vector pEASY-T4 (TransGen Biotech, China) and transformed into E. coli DH5α. This was verified by primer pair M13+/M13−, and three positive clones in each plate were selected for sequencing (Sangon, Shanghai, China). The sequences were analyzed with the BLAST program at the NCBI website (http://www.ncbi.nlm.nih.gov/blast). All genomic fragment sequences in this work were deposited in GenBank database under the accession numbers of JX966388, JX915245-JX915247, JX915250-JX915252, JX915254, and JX915255.
2.9. Statistical analysis
The banding patterns of DGGE and ERIC-PCR profiles were analyzed using the Quantity One V4.62 Software (Bio-Rad), and a binary matrix showing presence (1) and absence (0) of DGGE and ERIC-PCR bands was used. The Shannon-Wiener index H was calculated by (da Mota et al., 2005)
,
where S is the observed number of bands and Pi stand for the observed number of clones of a given species divided by the total number of organisms. Principal component analysis (PCA) of DGGE data was performed using MatLab (MathWorks). Cluster analysis of ERIC-PCR data was performed based on Dice’s similarity coefficient (SD) with a 1% position tolerance and the unweighted pair group method using arithmetic averages (UPGMA), and isolates of more than 90% similarity were considered to be the same kind of isolate (Borges et al., 2003).
Each set of tests was repeated three times, and the results were averaged. Statistica software 5.5 was used for statistical data analysis. Least significant difference (LSD) multiple range test was considered to be significant when P<0.05.
3. Results
3.1. Degradation of chlorpyrifos in soil
The degradation curve of chlorpyrifos in soil is shown in Fig. 1. Chlorpyrifos residues of 0.009 and 0.077 mg/kg were detected in the 60-d samples of 5 and 20 mg/kg chlorpyrifos-treated soils, respectively. The dissipation of chlorpyrifos in soil followed the first-order kinetics, and the calculated half-lives of 5 and 20 mg/kg chlorpyrifos were 8.25 and 8.29 d, respectively (Table 1).
Fig.1 Degradation of chlorpyrifos in soil
Table 1
Kinetics data of chlorpyrifos in soil
Chlorpyrifos treatment (mg/kg)
Dynamic function
DT50 (d)
R2
5
y=5.252e−0.09x
8.25
0.910
20
y=19.41e−0.08x
8.29
0.908
DT50: half-life of chlorpyrifos in this experiment
3.2. Effects of chlorpyrifos on total bacterial and fungal communities in soil
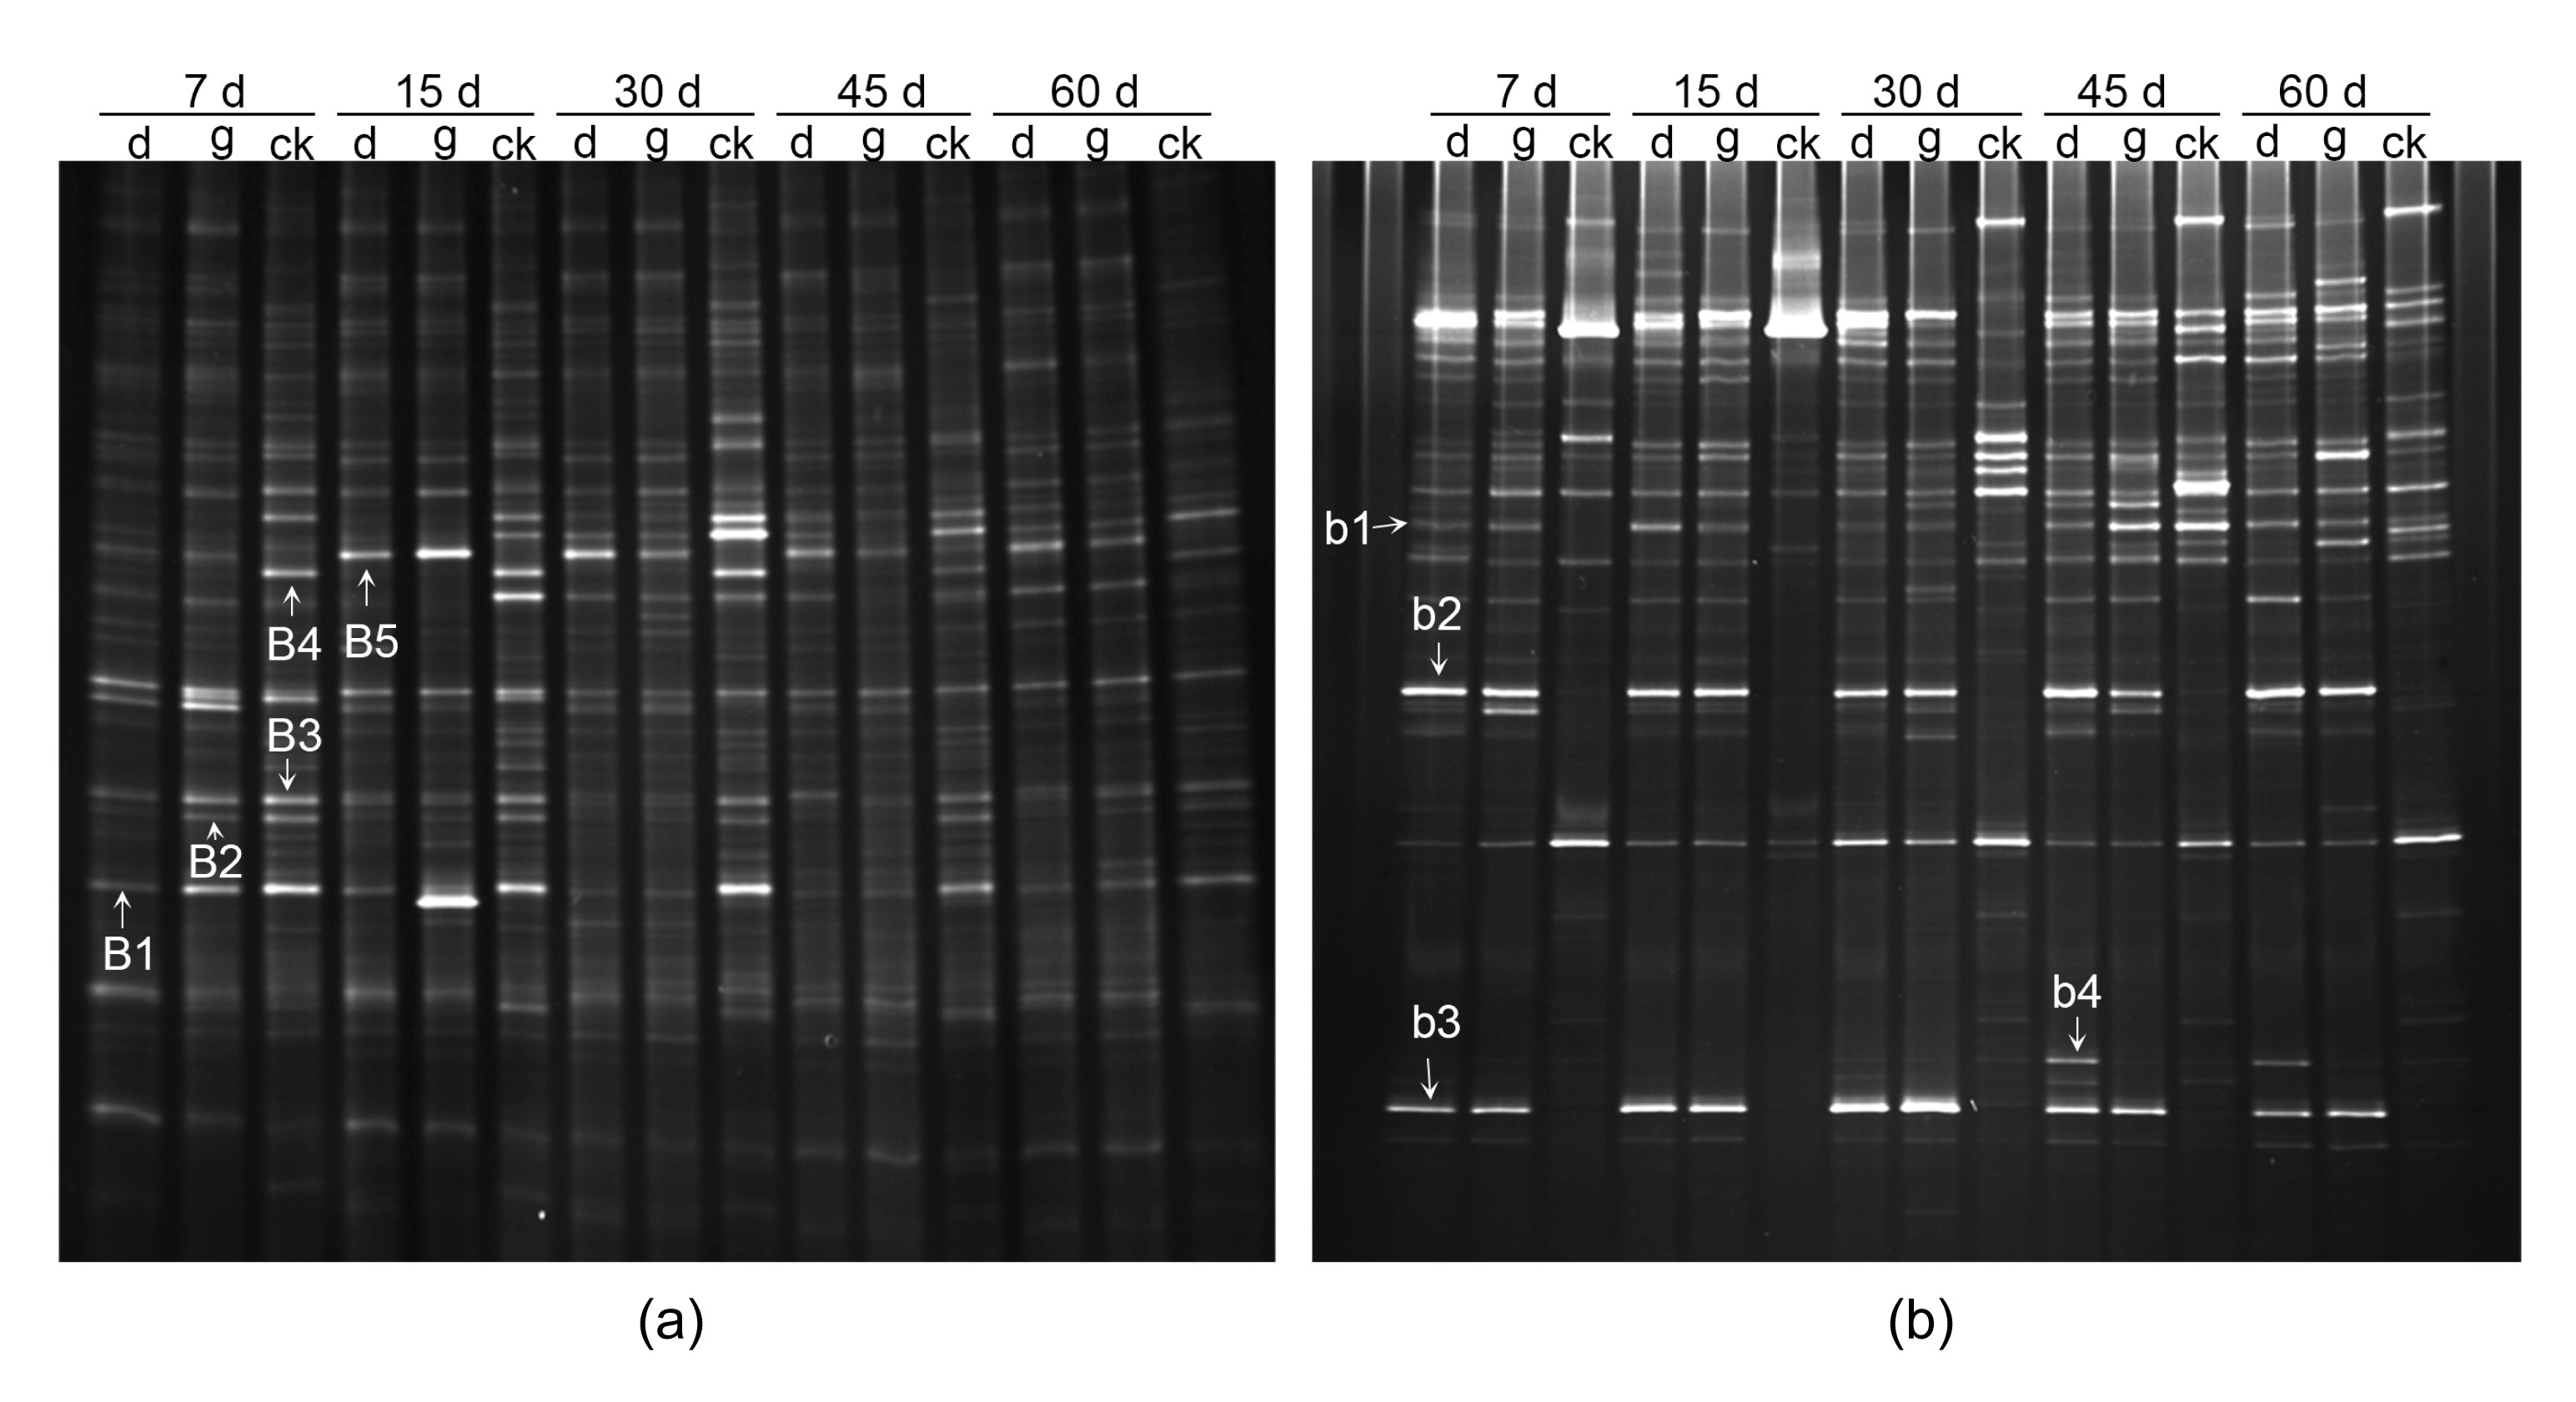
The PCR-DGGE banding profiles revealed clearly the dominant bacterial (Fig. 2a) and fungal (Fig. 2b) bands for each treatment. Most bands, like B1, B2, and B3, appeared in all samplings and only had a faint difference in intensity. Band B4 appeared only in the control, indicating that certain ribotype is suppressed by chlorpyrifos. Band B5 is common to the 15-, 30-, 45-, and 60-d samplings of chlorpyrifos-contaminated soils, but is missing in the 7-d sampling of chlorpyrifos-contaminated soil and all control sampling, suggesting that B5 ribotype proliferation needs a long-time chlorpyrifos stimulation. Band b1 first appeared only in the chlorpyrifos-treated soils in 7-, 15-, and 30-d samplings, while common to all treatments in 45- and 60-d samplings, the reasons for these observations are not clear. Some bands, like b2 and b3, are typical for all the chlorpyrifos-contaminated soils, indicating certain ribotypes are rapidly stimulated by chlorpyrifos and kept stable in soil. Band b4 appeared only in the 45- and 60-d samplings of chlorpyrifos-treated soil, suggesting that b4 ribotype might be stimulated by the 3,5,6-trichloro-2-pyridinol (TCP), the main biodegradation product of chlorpyrifos.
Fig.2 DGGE community fingerprints of soil total bacteria (a) and fungi (b) in soil samples amended with chlorpyrifos at different sampling times Lanes d, g, and ck stand for soil contaminated by chlorpyrifos of 5, 20, and 0 mg/kg, respectively
Shannon-Wiener diversity indices (Table 2) showed that soil bacterial and fungal communities were impacted differently by the presence of chlorpyrifos. For the total bacterial community, 5 mg/kg chlorpyrifos treatment had a similar diversity index as the control, while 20 mg/kg chlorpyrifos had the lowest diversity indices except on Day 30 during the first 30 d; diversity indices in all chlorpyrifos-treated soil samples were higher than the control on Day 45 sampling, while getting similar to the control at the end of the experiment. For the total fungi community, diversity indices in chlorpyrifos-treated samples rose during the first 15-d incubation and were slightly higher than that of the control. Subsequently, the diversity indices in the control samples rose on Day 30 and were higher than those of the treated samples. After 30–60 d of chlorpyrifos application, diversity indices in 5 mg/kg chlorpyrifos-treated samples were higher than that of the control, while the 20 mg/kg chlorpyrifos-treated samples had a similar diversity index as the control.
Table 2
Shannon-Wiener diversity indices of total bacterial and fungal communities under the stress of chlorpyrifos
Samplea
Shannon-Wiener index H
Bacterial community
Fungal community
d7
3.68±0.12cd
3.35±0.03d
g7
3.56±0.04b
3.30±0.04c
ck7
3.69±0.03cd
3.06±0.02b
d15
3.66±0.05cd
3.42±0.03fg
g15
3.48±0.04a
3.39±0.02ef
ck15
3.62±0.02bc
2.68±0.02a
d30
3.68±0.04cd
3.43±0.02g
g30
3.88±0.06e
3.29±0.02c
ck30
3.67±0.02cd
3.53±0.02i
d45
3.96±0.01f
3.54±0.02i
g45
4.02±0.05f
3.34±0.01d
ck45
3.72±0.02d
3.37±0.05de
d60
3.82±0.02e
3.56±0.02i
g60
3.87±0.02e
3.44±0.02gh
ck60
3.83±0.02e
3.47±0.02h
ad, g, and ck stand for soils contaminated by chlorpyrifos of 5, 20, and 0 mg/kg, respectively
7, 15, 30, 45, 60 stand for the sampling days after the chlorpyrifos treatment. Values are expressed as mean±SD of triplicate samples, means followed by the same letter within a column are not significantly different according to LSD’s multiple range test (P<0.05)
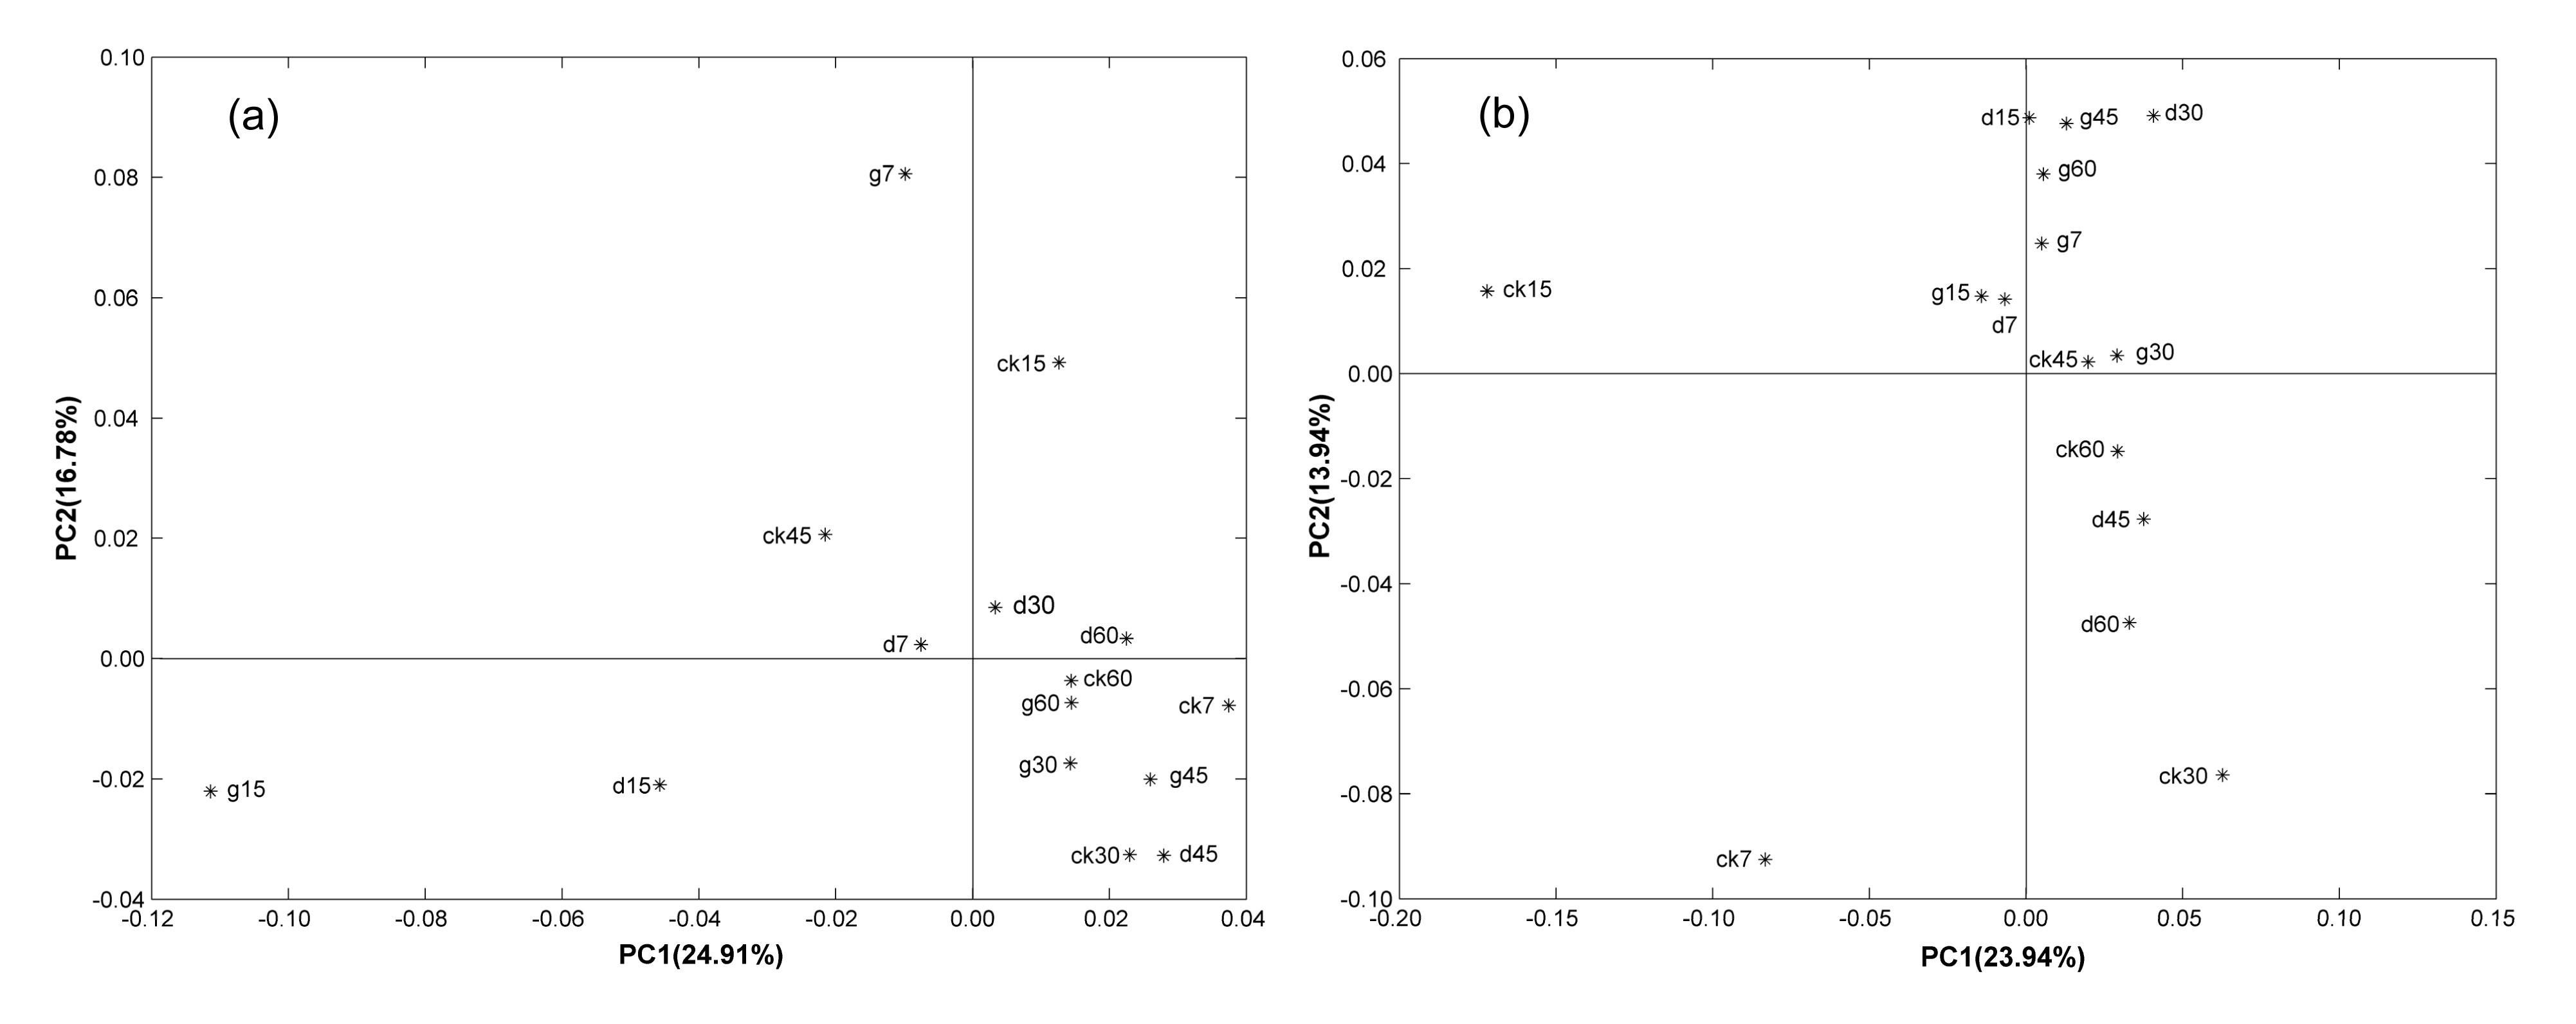
The PCA of the total bacterial community structure (Fig. 3a) showed that, during the first 30 d of chlorpyrifos application, whether 5 or 20 mg/kg, the chlorpyrifos-treated samples were far apart from the control, especially on Day 7. The distance between the chlorpyrifos-treated samples and the control was getting shorter through time and clustered into one group on Day 60. This is probably because the soil bacteria had high tolerance and adaption to chlorpyrifos.
Fig.3 PCA analysis of the soil total bacteria (a) and fungi (b) in soil samples amended with chlorpyrifos d, g, and ck stand for soils contaminated by chlorpyrifos of 5, 20, and 0 mg/kg, respectively; 7, 15, 30, 45, and 60 stand for the sampling days after the chlorpyrifos treatment. The values following the PC1 and PC2 in the axes stand for percentages of the first and second principal components to all components, respectively
The fungal community as to whether 5 or 20 mg/kg chlorpyrifos-treated sample was far apart from the control during the first 30 d of chlorpyrifos application, which was in accordance with the changes in the bacterial community. While even though the diversity indices of total fungi in the 20 mg/kg chlorpyrifos-treated samples were similar to that of the control on Day 60, the population structures of the chlorpyrifos-treated samples did not recover to the control level as indicated by the PCA analysis (Fig. 3b). The result indicates that soil fungal community was affected rapidly and persistently under the stress of chlorpyrifos.
3.3. Isolation of chlorpyrifos-degrading strains and ERIC-PCR analysis
Twelve fungal strains (8 from Czapek’s medium, named CR9, CR10, CR12, CR4, CR13, CR11, CR1, and CR14; 4 from Gause’s medium, named GR2, GR4, GR3, and GR1) and two bacterial strains (from Luria-Bertani medium, named LR4 and LR5) were isolated from the chlorpyrifos-treated soils, and they could degrade more than 80% of chlorpyrifos after 7-d cultivation (Table 3), while only a 23.14% degradation rate was observed in the control.
Table 3
Chlorpyrifos degradation rates of strains isolated from chlorpyrifos-treated soils after 7-d cultivation
Medium
Clone No.
Degradation rate (%)
Czapek’s
CR1
92.47±0.90gh
CR4
87.98±1.54de
CR9
97.54±2.02i
CR10
91.54±1.71g
CR11
94.11±1.72h
CR12
87.16±0.80de
CR13
82.85±1.23bc
CR14
91.68±1.00g
Gause’s
GR1
82.02±0.49b
GR2
83.22±1.74bc
GR3
84.49±0.74c
GR4
86.86±1.09d
Luria-Bertani
LR4
90.44±1.19fg
LR5
89.16±1.33ef
Control
23.14±1.68a
All values are mean±SD of triplicate samples, means followed by the same letter within a column are not significantly different according to LSD multiple range test (P>0.05)
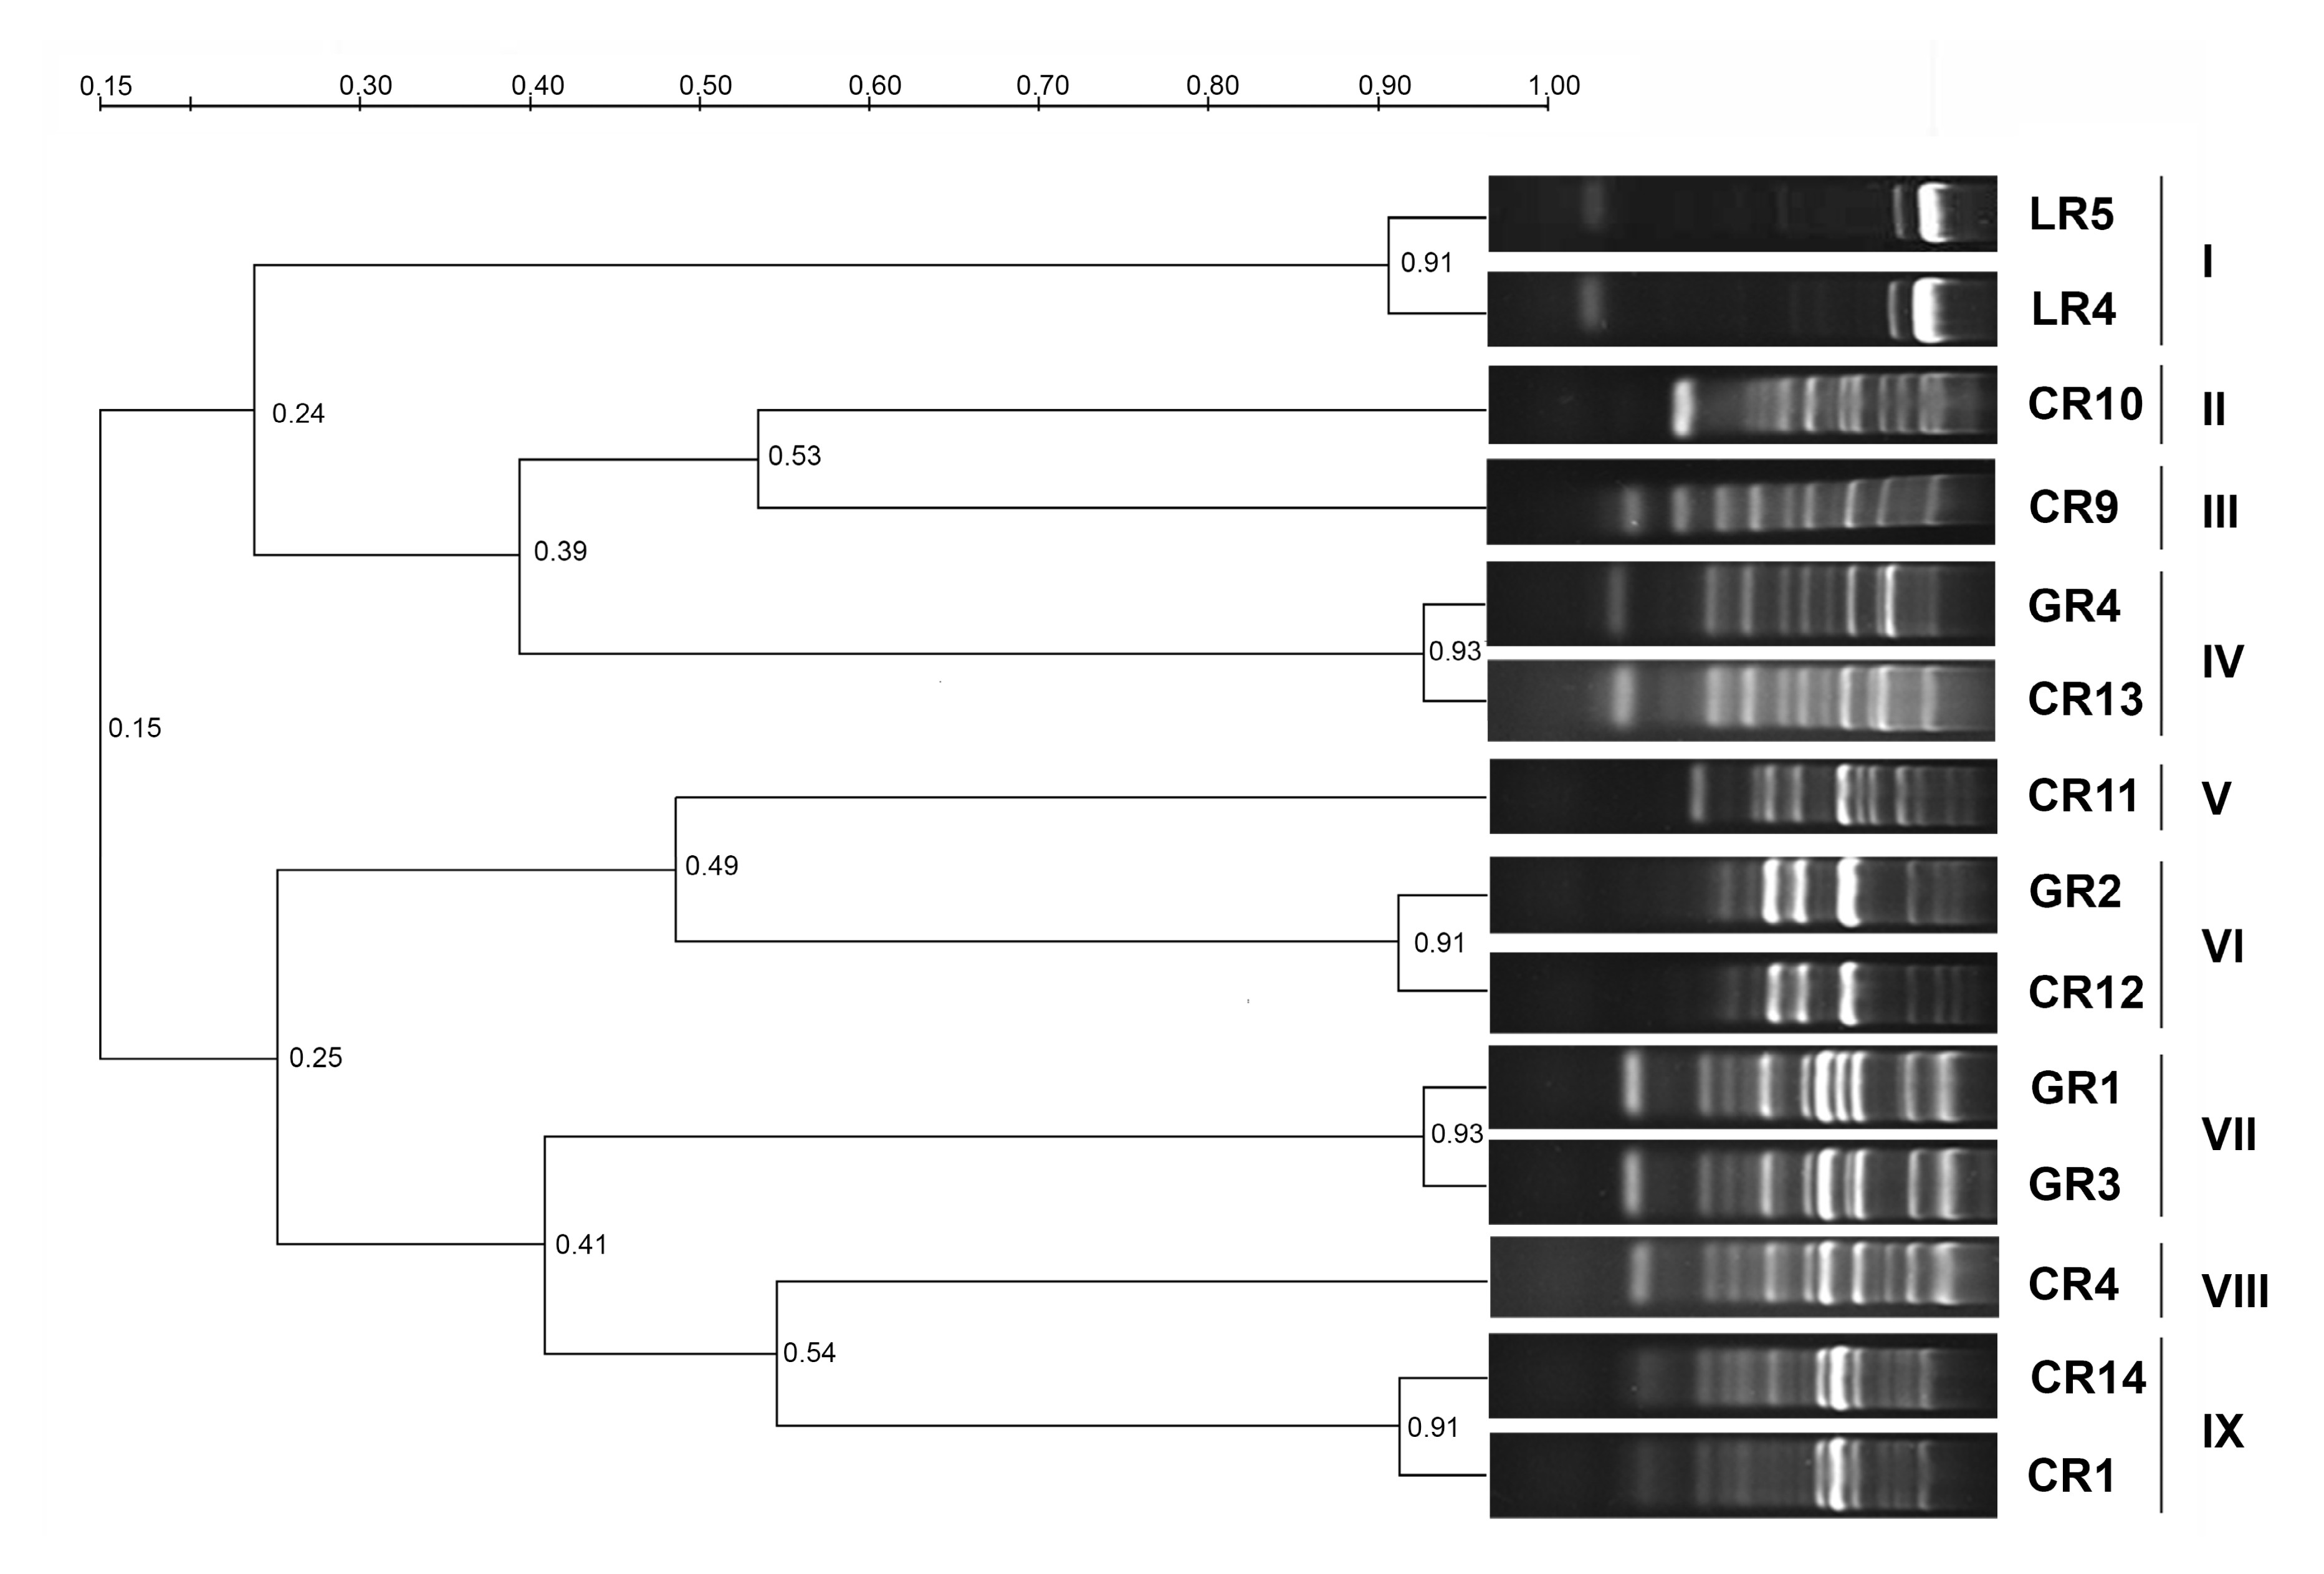
The electrophoresis prowls of ERIC-PCR products were determined for the 14 chlorpyrifos-degrading isolates. The data matrix based on the DNA fragments was constructed. As shown in the ERIC-PCR fingerprint of isolates (Fig. 4), the similarities for LR4 and LR5, GR4 and CR13, GR2 and CR12, GR1 and GR3, and CR1 and CR14 reached above 90%. Isolates of more than 90% similarity in the ERIC-PCR fingerprint were treated as the ERIC type, so all the chlorpyrifos-degrading isolates obtained in this study were grouped into nine different ERIC types based on the ERIC-PCR pattern similarity.
Fig.4 ERIC-PCR fingerprints of 14 chlorpyrifos-degrading strains I–IX stand for ERIC types of chlorpyrifos-degrading strains
The PCR products of 8F/1492R for ERIC-I and ITS1f/ITS4 for ERIC-II to -IX were ligated with vector pEASY-T4 and transformed into E. coli DH5α. Sequences of the nine representative ERIC types were obtained (Table 4), further BLAST analysis demonstrated that clones of ERIC-I type showed a 99% similarity to Bacillus cereus, clones of ERIC-II, -III, and -IV types were of 100% similarities to Fusarium sp.; clones of ERIC-V, -VII, and -VIII showed 99%, 100%, and 100% similarities to Gibberella moniliformis, respectively; clones of ERIC-VI type showed a 95% similarity to Dipodascaceae sp.; and, clones of ERIC-IX type showed a 100% similarity to Chaetomium globosum.
Table 4
Species of clones with ITS sequence for fungi and 16S rDNA sequence for bacteria in NCBI GenBank database most similar to the nine ERIC types of chlorpyrifos-degrading strains
ERIC type
Clone No.
Closest match from GenBank
GenBank accession No.
Match
Sequence similarity by BLAST (%)
I
LR4, LR5
Bacillus cereus
99
JX966388
II
CR10
Fusarium sp.
100
JX915255
III
CR9
Fusarium oxysporum
100
JX915246
IV
GR4, CR13
Fusarium sp.
100
JX915247
V
CR11
Gibberella moniliformis
99
JX915252
VI
CR12, GR2
Dipodascaceae sp.
95
JX915245
VII
GR3, GR1
Gibberella moniliformis
100
JX915251
VIII
CR4
Gibberella moniliformis
100
JX915250
IX
CR1, CR14
Chaetomium globosum
100
JX915254
4. Discussion
In this study, the degradation of chlorpyrifos shows the first-order kinetic characteristics with the determination coefficient of more than 0.9, which is in agreement with the dissipation of chlorpyrifos in most soil types (Devashis and Ramen, 2005; Fang et al., 2008; 2009). While sometimes the first-order kinetics is not satisfactory for the description of chlorpyrifos in soil, it can be better described by the biexponential model (Fang et al., 2006; Chu et al., 2008). This may be due to different soil environments and soil microorganisms.
DGGE fingerprinting and further PCA obtained in this study with soil DNA show shifts in the composition of dominant bacterial and fungal populations in different time after the application of chlorpyrifos to soil. The experimental results indicate that the application of chlorpyrifos at the recommended or four times dose to soil can affect the soil fungal community rapidly and persistently, while the bacterial community is significantly (P<0.05) different in the first 30 d and recovers to a similar level to the control until 60 d. Results from our studies are somewhat different from those of Chu et al. (2008), which reported that the populations of bacteria, fungi, and actinomycetes were significantly reduced by 44.1%, 61.1%, and 72.8%, respectively, on the first day after treatment by chlorpyrifos at the recommended dose and recovered to a similar level of the control until 14 d using the plate counting method. The responses of the dominant bacterial and fungal community structures are different from culturable and countable bacterial and fungal populations, probably because the culturable and countable microbes are only a minor part of total microbes in soil. Recovery of microbial quantity in soil only showed some microbes adapted to the existence of chlorpyrifos have been rapidly proliferated. Therefore, recovery in numbers of culturable microbes does not stand for the recovery in the community structure. To some extent, the number of culturable microbes may be associated with soil functions, because the study relied on the biology method (Fang et al., 2009) shows that the average well color development in soils is significantly (P<0.05) inhibited by chlorpyrifos in the first two weeks and thereafter recovers to a similar level as the control. A similar variation in the diversity indices (Simpson index 1/D and McIntosh index U) is observed, but no significant difference among the values of the Shannon-Wiener index H was found in chlorpyrifos-treated soils (Fang et al., 2009). In the same time, Wang et al. (2010) found that microbial metabolic parameters (growth rate constant k, total heat evolution QT, metabolic enthalpy ΔHmet, mass specific heat rate JQ/S, microbial biomass C, and inhibitory ratio I) and urease activity almost keep constant when exposed to chlorpyrifos (<5.0 mg/kg). Therefore, it is concluded that the soil microbial function can keep stable by shifting resources from other biological activities (such as reproduction or growth) toward survival to some extent. We can see that a combination of different methods can give a more comprehensive analysis of chlorpyrifos effects on soil ecology.
Nine typical ERIC types of chlorpyrifos-degrading isolates were screened from chlorpyrifos-treated soil, which showed high similarity to Bacillus cereus, Fusarium sp., Gibberella moniliformis, Dipodascaceae sp., and Chaetomium globosum, respectively by DNA BLAST in GenBank database. Among them, Bacillus cereus (Vidya et al., 2009) and Fusarium sp. (Xie et al., 2010) had been reported for their ability of degrading chlorpyrifos, while Gibberella moniliformis, Dipodascaceae sp., and Chaetomium globosum were first reported in public literature. Robertson et al. (1998) found that rapid loss of chlorpyrifos is more likely to occur at sites where the chlorpyrifos has been applied in previous crop cycles, compared to sites where there has been no prior use. The rcommon opinion was that microbial degradation has contributed to rapid loss of chlorpyrifos. Biodegradation using native microorganisms is considered to be a safe, cost-effective, efficient, and eco-friendly method. Therefore, it is necessary to isolate different kinds of strains for bioremediation of chlorpyrifos-contaminated soil under different soil types and climatic conditions.
5. Conclusions
At the end of the microcosm experiment (60 d after chlorpyrifos application), chlorpyrifos-treated soil samples and the control ad a similar diversity index, and were clustered into one group in PCA for the total bacterial community; for the total fungal community, even though the diversity indices in chlorpyrifos-treated soil samples was similar to that of the control, the population structures of chlorpyrifos-treated samples did not recover to the control. Our data show that chlorpyrifos applications can affect fungal community structures in a quick and lasting way, while only affecting the bacterial community in a temporary way. Finally, 14 typical chlorpyrifos-degrading isolates were screened and classified into 9 ERIC types, which showed high similarities to Bacillus cereus, Fusarium sp., Gibberella moniliformis, Dipodascaceae sp., and Chaetomium globosum, respectively, by DNA BLAST in GenBank database.
Acknowledgements
We sincerely express our thanks to Dr. Xin WANG (Institute of Plant Protection and Microbiology, Zhejiang Academy of Agricultural Sciences, China) for his help in analyzing the community structure.
[1] Anwar, S., Liaquat, F.M., Khan, Q.M., 2009. Biodegradation of chlorpyrifos and its hydrolysis product 3,5,6-trichloro-2-pyridinol by Bacillus pumilus strain C2A1. J Hazard Mater, 168(1):400-405.
[2] Borges, L.G.D., Dalla, V.V., Corao, G., 2003. Characterization and genetic diversity via REP-PCR of Escherichia coli isolates from polluted waters in southern Brazil. FEMS Microb Ecol, 45(2):173-180.
[3] Chu, X.Q., Fang, H., Pan, X.D., 2008. Degradation of chlorpyrifos alone and in combination with chlorothalonil and their effects on soil microbial populations. J Environ Sci, 20(4):464-469.
[4] da Mota, F.F., Gomes, E.A., Paiva, E., 2005. Assessment of the diversity of Paenibacillus species in environmental samples by a novel rpoB-based PCR-DGGE method. FEMS Microbial Ecol, 53(2):317-328.
[5] Devashis, S., Ramen, K.K., 2005. Metabolism of chlorpyrifos in relation to its effect on the availability of some plant nutrients in soil. Chemosphere, 61(9):1273-1280.
[6] Fang, H., Yu, Y.L., Wang, X.G., 2006. Dissipation of chlorpyrifos in pakchoi-vegetated soil in a greenhouse. J Environ Sci, 18(4):760-764.
[7] Fang, H., Yu, Y.L., Wang, X.G., 2008. Effects of repeated applications of chlorpyrifos on its persistence and soil microbial functional diversity and development of its degradation capability. Bull Environ Contam Toxicol, 81(4):397-400.
[8] Fang, H., Yu, Y.L., Chu, X.Q., 2009. Degradation of chlorpyrifos in laboratory soil and its impact on soil microbial functional diversity. J Environ Sci, 21(3):380-386.
[9] Gillings, M., Holley, M., 1997. Repetitive element PCR fingerprinting (rep-PCR) using enterobacterial repetitive intergenic consensus (ERIC) primers is not necessarily directed at ERIC elements. Lett Appl Microbiol, 25(1):17-21.
[10] Kulkarni, A.R., Soppimath, K.S., Dave, A.M., 2000. Solubility study of hazardous pesticide (chlorpyrifos) by gas chromatography. J Hazard Mater, 80(1-3):9-13.
[11] Li, X.Y., Zhang, H.W., Wu, M.N., 2008. Effect of methamidophos on soil fungi community in microcosms by plate count, DGGE and clone library analysis. J Environ Sci, 20(5):619-625.
[12] Maya, K., Singh, R.S., Upadhyay, S.N., 2011. Kinetic analysis reveals bacterial efficacy for biodegradation of chlorpyrifos and its hydrolyzing metabolite TCP. Process Biochem, 46(11):2130-2136.
[13] Muyzer, G., de Waal, E.C., Uitterlinden, A.G., 1993. Profiling of complex microbial populations by denaturing gradient gel electrophoresis analysis of polymerase chain reaction-amplified genes coding for 16S ribosomal RNA. Appl Environ Microbiol, 59(3):695-700.
[14] Pandey, S., Singh, D.K., 2006. Soil dehydrogenase, phosphomonoesterase and arginine deaminase activities in an insecticide treated groundnut (Arachis hypogaea L.) field. Chemosphere, 63(5):869-880.
[15] Robertson, L.N., Chandler, K.J., Stickley, B.D.A., 1998. Enhanced microbial degradation implicated in rapid loss of chlorpyrifos from the controlled-release formulation suSCon® Blue in soil. Crop Prot, 17(1):29-33.
[16] Sampaio, J.L.M., Viana-Niero, C., de Freitas, D., 2006. Enterobacterial repetitive intergenic consensus PCR is a useful tool for typing Mycobacterium chelonae and Mycobacterium abscessus isolates. Diagn Microbiol Infect Dis, 55(2):107-118.
[17] Sardar, D., Kole, R.K., 2005. Metabolism of chlorpyrifos in relation to its effect on the availability of some plant nutrients in soil. Chemosphere, 61(9):1273-1280.
[18] Sebiomo, A., Ogundero, V.W., Bankole, S.A., 2011. Effect of four herbicides on microbial population, soil organic matter and dehydrogenase activity. Afr J Biotechnol, 10(5):770-778.
[19] Valkov, V., Baldrian, P., 2009. Denaturing gradient gel electrophoresis as a fingerprinting method for the analysis of soil microbial communities. Plant Soil Environ, 55(10):413-423.
[20] Vidya, L.C., Kumar, M., Khanna, S., 2009. Biodegradation of chlorpyrifos in soil by enriched cultures. Curr Microbiol, 58(1):35-38.
[21] Wang, F., Yao, J., Chen, H.L., 2010. Comparative toxicity of chlorpyrifos and its oxon derivatives to soil microbial activity by combined methods. Chemosphere, 78(3):319-326.
[22] Xie, H., Zhu, L.S., Ma, T.T., 2010. Immobilization of an enzyme from a Fusarium fungus WZ-I for chlorpyrifos degradation. J Environ Sci, 22(12):1930-1935.
[23] Yu, Y.L., Fang, H., Wang, X., 2006. Characterization of a fungal strain capable of degrading chlorpyrifos and its use in detoxification of the insecticide on vegetables. Biodegradation, 17(5):487-494.
[24] Yuan, W., Chai, T.J., Miao, Z.M., 2010. ERIC-PCR identification of the spread of airborne Escherichia coli in pig houses. Sci Total Environ, 408(6):1446-1450.
Open peer comments: Debate/Discuss/Question/Opinion


Open peer comments: Debate/Discuss/Question/Opinion
<1>