Affiliation(s):
1. Department of Landscape Design and Management, National Chin-Yi Institute of Technology, Taiwan 41111, China; moreAffiliation(s): 1. Department of Landscape Design and Management, National Chin-Yi Institute of Technology, Taiwan 41111, China; 2. Department of Fire Science, Wu-Feng Institute of Technology, Ming-Hsiung, Chiayi, Taiwan 621, China; 3. Department of Construction Engineering, National Kaoshiang First University of Science and Technology, Taiwan 824, China; 4. Department of Civil Engineering, National Chung Hsing University, Taiwan 40227, China; less
SUNG Wen-pei, LIN Cheng-I, SHIH Ming-hsiang, GO Cheer-germ. Analysis modeling for plate buckling load of vibration test[J]. Journal of Zhejiang University Science A, 2005, 6(2): 132-140.
@article{title="Analysis modeling for plate buckling load of vibration test", author="SUNG Wen-pei, LIN Cheng-I, SHIH Ming-hsiang, GO Cheer-germ", journal="Journal of Zhejiang University Science A", volume="6", number="2", pages="132-140", year="2005", publisher="Zhejiang University Press & Springer", doi="10.1631/jzus.2005.A0132" }
%0 Journal Article %T Analysis modeling for plate buckling load of vibration test %A SUNG Wen-pei %A LIN Cheng-I %A SHIH Ming-hsiang %A GO Cheer-germ %J Journal of Zhejiang University SCIENCE A %V 6 %N 2 %P 132-140 %@ 1673-565X %D 2005 %I Zhejiang University Press & Springer %DOI 10.1631/jzus.2005.A0132
TY - JOUR T1 - Analysis modeling for plate buckling load of vibration test A1 - SUNG Wen-pei A1 - LIN Cheng-I A1 - SHIH Ming-hsiang A1 - GO Cheer-germ J0 - Journal of Zhejiang University Science A VL - 6 IS - 2 SP - 132 EP - 140 %@ 1673-565X Y1 - 2005 PB - Zhejiang University Press & Springer ER - DOI - 10.1631/jzus.2005.A0132
Abstract: In view of the recent technological development, the pursuit of safe high-precision structural designs has been the goal of most structural designers. To bridge the gap between the construction theories and the actual construction techniques, safety factors are adopted for designing the strength loading of structural members. If safety factors are too conservative, the extra building materials necessary will result in high construction cost. Thus, there has been a tendency in the construction field to derive a precise buckling load analysis model of member in order to establish accurate safety factors. A numerical analysis model, using modal analysis to acquire the dynamic function calculated by dynamic parameter to get the buckling load of member, is proposed in this paper. The fixed and simple supports around the circular plate are analyzed by this proposed method. And then, the monte Carlo method and the normal distribution method are used for random sampling and measuring errors of numerical simulation respectively. The analysis results indicated that this proposed method only needs to apply modal parameters of 7×7 test points to obtain a theoretical value of buckling load. Moreover, the analysis method of inequality-distant test points produces better analysis results than the other methods.
Darkslateblue:Affiliate; Royal Blue:Author; Turquoise:Article
Article Content
. INTRODUCTION
Buckling occurs when the stress loading on a member reaches a certain critical point and the member is in a state of neutral balance after losing resistance to outside forces. A large amount of drifts are generated, leaving the member in an unstable state. Thus, buckling load is a critical factor for designers in designing members. The amount of buckling load is related to the size, material, and the boundary restraint conditions of the member. Size and material are not significant variables and easily controlled, but the boundary restraint conditions are not easily evaluated accurately because connectors cannot be technically perfected. Although reduction factor can cover up the shortcoming, it is hard to examine if the buckling load of the member meets the design requirement during the construction. As a result, it is necessary to devise a method which can analyze the buckling load of the members and establish accurate safety factors without having to consider the boundary condition factor. Boundary connectors cannot be simulated, making it hard to estimate the boundary restraint conditions of the member or derive them from theories. Thus, in the past, scholars usually conducted experiments based on various static or dynamic theories, in order to obtain the value of the buckling load.
Experiments using dynamic theories include that of: (1) Lurie (1952), who conducted experiments to obtain the relation curve between axial loading and the square natural frequency, and get the structural members’ bulking load value by using linear extrapolation at the point of frequency = 0; (2) Sweet and Genin (1971), Sweet et al.(1976; 1977), who used the natural frequency obtained from the results of motion experiments to estimate the buckling load of structural members; (3) Segall and Baruch (1980), who derived the buckling load of flexible poles by conducting motion experiments in conjunction with integral pole equation; (4) Segall and Springer (1986), who used integral equation and motion parameters to get the buckling load value of model members; (5) Go et al.(1997), who created a parameter based model to analyze the buckling load of the model members. Richard and Faires (1989) proposed the experiment’s main static theory in which the slope of the W/P vs W curve is the buckling load value of the structural members (P being the measured structural member loading, W the deformation after buckling).
A dynamic analysis model is proposed to acquire buckling load of plate. We used the dynamic measured data from selected test points and by modal analysis got the modal parameters-mode shape and frequency; and then, derived a flexible matrix with the above model parameters. Force analysis was used to get the flexible matrix of equivalent force and the characteristic equation for determining the buckling load of the member. Under the equivalence, the buckling deformation function of the member was derived from the deformation tested at the test points and simulated by Lagrange’s Interpolation Equations. In this paper, we took the circular model member of ideal margins and fixed restraints on each side as an example. First, we used the given frequency and the corresponding mode shape to conduct the verification of the analysis model and then discussed the number and location of the test points and the mode shapes composing a linear isolated equation with the 1st, 2nd, 3rd, 4th, 5th, … values extracted from the vibration equation; and also discussed the impact of measured deviation caused by outside factors on buckling load. Monte Carlo Method was used to generate random scatter to simulate the values of measured deviations. Finally, we modeled the elements of the circular model member with simple restraint on each side based on the results of the above analysis, and used finite element analysis method to acquire modal parameters. Then, we verified the dynamic analysis model with the modal parameters obtained from measured data. The proposed analysis model is applicable to all kinds of loading and boundary conditions.
. ANALYSIS METHOD
. Simulation function of buckling shape
Assume that the deformation function of the plate after buckling is W(r,θ); then, select test points along the vertical direction of plate where lateral displacement is Dij (i, j=1, 2, …, n). Using Lagrange’s Interpolation Function to tie in with lateral displacement Dij to represent the deformation function of the plate after buckling W(r,θ) (Dym, 1974) shown as follows: is Lagrange’s interpolation function and Dij is the test point (i, j), lateral displacement.
. Energy equivalence
Assuming a homogeneous and isotropic plate, with radius a. When the plate is subjected to external forces Nrr, Nθθ and shear force Nrθ, the energy equation can be expressed as follows (Timoshenko and Gere, 1997):
Where, From the concept of the energy method, the axial and shear forces can be transformed as action force acting on test points. Then substitute Nrr=Nf1(r,θ); Nθθ=Nf2(r,θ); Nrθ=Nf3(r,θ) into Eq.(2). The equivalent force matrix can be acquired through Castigliano’s theorem, as follows:
Where: and [D] is the displacement matrix.
. Buckling analysis
Considering the relation between action [F] and displacement [D] in the system of equivalent condition. Then use the force method to analyze the following expression:
Where, [G] is flexible matrix.
G(i, j) means that applying one unit loading at j point, induced the deflection at i point. Substituting [F] in Eq.(3) into Eq.(4) to get the following expression:
Where, is buckling load.
Solving the Eq.(6) to obtain the characteristic solution. The reciprocal of the characteristic solution maximum value is the buckling load.
The theoretical model shows that [B] and [G] are two factors affecting the analysis accuracy of buckling load. When the test point has been determined, we use dynamic measurement and modal analysis to get the modal shape φ and frequency ω of the plate to analyze and study the flexible matrix [G] with regard to [B] matrix, and their relations with test positions and number of test points.
. Flexible matrix
The free vibration dynamic equation of circular plate is shown as follows (Meirovitch, 1967): where, is the deflection rigidity; is harmonic differential operator and ∇2∇2=∇4 is biharmonic differential operator.
Assuming deformation function is w(r,θ,t), and after using variable separation method to solve Eq.(8), the deformation function can be expressed as follows: where, φi(r, θ) is the ith Modal Shape.
Then substitute Eq.(9) into Eq.(8) to derive the following expression: where, ωi is the natural frequency for the ith modal shape and Ti is the time function of free vibration.
The forced vibration dynamic equation of circular plate is shown as follows (Meirovitch, 1967): where, f(r,θ,t) is the external force applied on the circular plate.
Assuming the deformation function is wf (r,θ,t) and given as: where, ψi(t) is time function of forced vibration.
Eq.(14) can be substituted into Eq.(13), then, multiplied by φj(r,θ) and integrated over the area of the circular plate to get the following equation:
Using the characteristics of Modal Orthogonal, Eq.(16) can be rearranged as follows: where, and is generalized mass.
Assuming the external force f(r,θ,t) as a period centralized force applied at the test point.
f(r,θ,t)=δ(r−ξ)δ(θ−η)×sin(Ωt) (17) where, δ(r−ξ) is the Dirac Delta Function.
The properties of Dirac Delta Function are shown as follows: Then, Eq.(17) can be integrated to get the following equation:
Substitution of Eqs.(12), (16) and (18) into Eq.(15), yields the following equation.
Substitution of initial conditions ψ′j(0)=ψj(0)=0 into Eq.(19) and use of Inverse Laplace Transform yield as:
Substitute Eq.(20) into Eq.(14) to obtain w(r,θ,t) shown as follows: (21)
If Ω→0, the external force approaches static load and the influence function can be shown as follows: where, Parameter G(r,θ,ξ,η) represents the induced deflection at test point (r,θ), one unit load is applied at the test point (ξ,η), which is the flexible matrix.
Use of the three-point method of Simpson’s rule yields the following expression for generalized mass Mi.
The measured error of numerical analysis test is used in the Monte Carlo method for sampling random variable, following the normal distribution model. The obtained error of simulation erri is multiplied by dynamic parameters−natural frequency ωi and modal shape φi(r,θ) and then substituted into the theoretical model before proceeding with the numerical analysis. The buckling load of circular plate with error of simulation can be acquired. The natural frequency and modal shape with error of simulation are as follows: where, err1 and err2 are simulation errors.
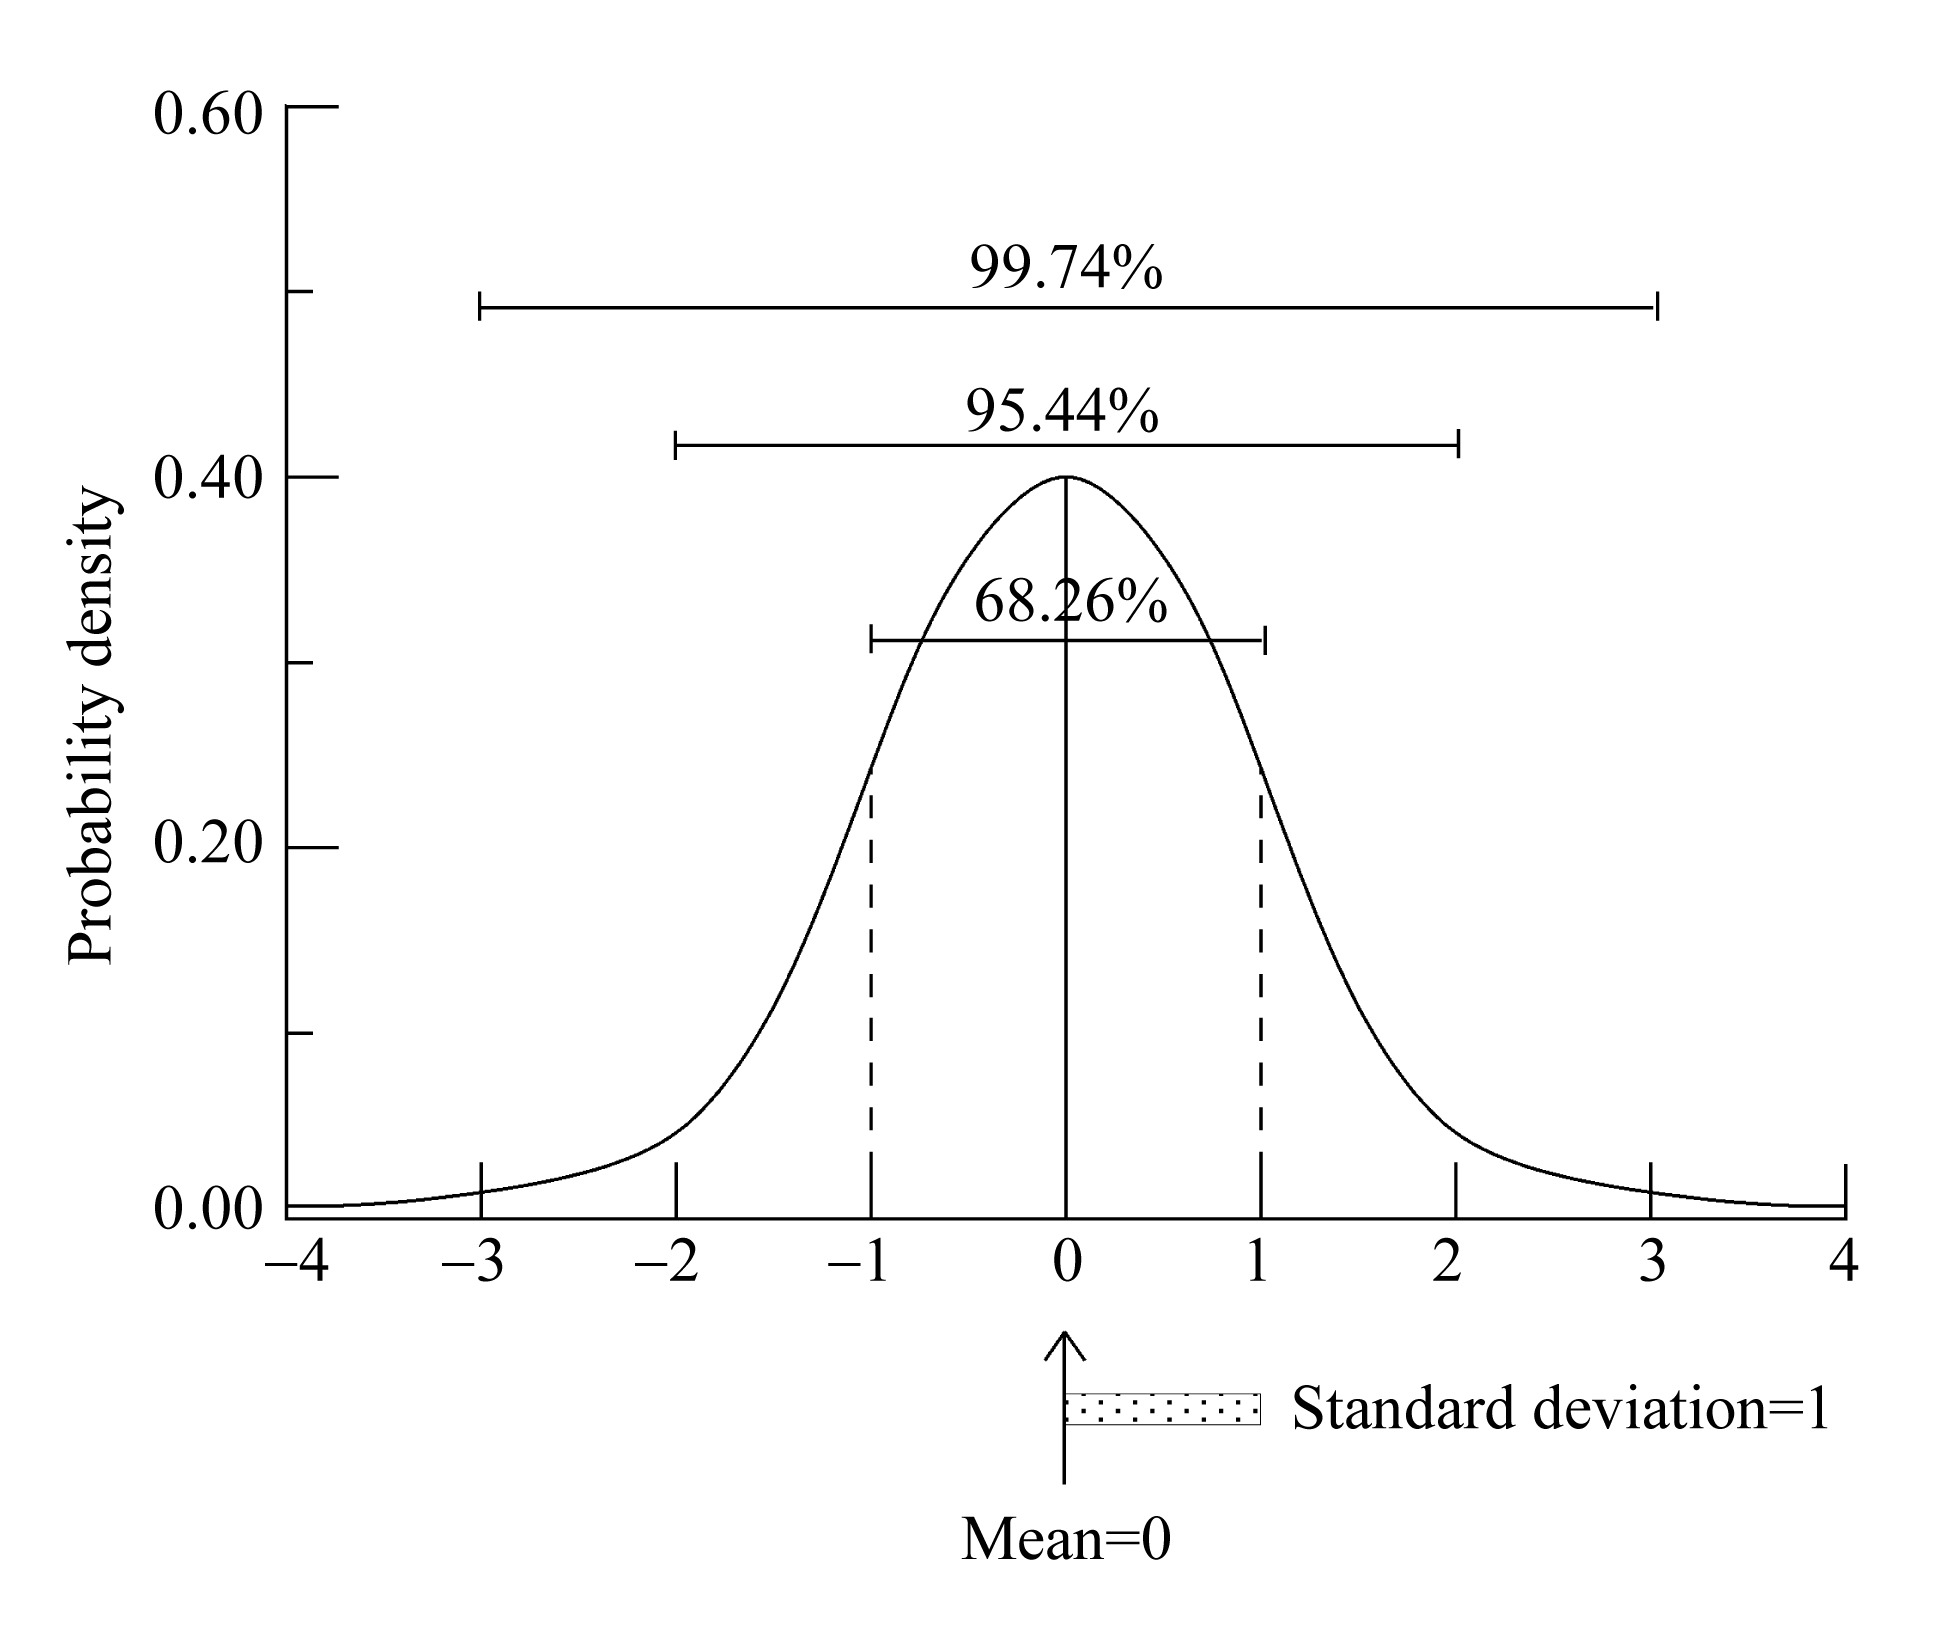
The normal random variable is produced through the uniform distribution random variation on the central limit theorem. The distribution situation is 99.7% of the weight factor plus/minus 100%. The standard deviation is 1/3. This diagram is shown in Fig.1. The normal random variable of RANn is shown as: where, n is the number of the selected distribution random variables. There are 1000 points for this paper; μ is the mean value of normal distribution and σ is the standard deviation of normal distribution. where, RANu is the uniform random variable between 0 and 1, Xu is the random variable and M is the unit length for sampling.
Fig.1 A diagram of standard normal distribution
. Influence parameters for buckling load of circular plate
In order to study the influence of position of selected test point, number of selected points and simulation of modal shape on the results of analysis of the buckling load of circular plate, using the given theoretical solution of buckling load, the constrain boundary conditions of a circular plate with uniform axial load Nrr, applied on it, as an example. The material properties of the circular plate are given in Table 1.
Table 1
Material properties of circular plate
Deflected rigidity D (kg(cm2)
Area of mass ( (kg/cm2)
Radius a (cm)
1
1
1
The feasibility study of this proposed theoretical analysis model of buckling loads used the given theoretical formula of natural frequency and modal shape where the boundary conditions of circular plate are fixed. The analysis results are shown in Tables 2 and 3. Table 2 is composed of five modal shapes for analysis of the simulation effects of modal shapes. The analysis results indicated that the comparison of analysis solution and theoretical solution of buckling load had barely 1.5% error number of test points 7×7 using equidistant test point and not equidistant test point. Table 3 is the simulation results of 7×7 test points with equidistant test point. The analysis results show that more accurate buckling load of circular plate can be acquired by using simulation model, which buckling load is obtained by the second mode. The positions of test points of equidistant test point and inequality-distant test point are shown in Tables 4, 5 and 6.
Table 2
The buckling load of fixed support of circular plate bearing uniform unit axial load (Nrr=1)
Test point arrangement
No. of test points
Analysis solution
Theoretical solution
Error ratio
Equidistant test point
5(5
35.270
14.684
+140.19 %
7(7
14.895
14.684
+1.4376 %
9(9
14.872
14.684
+1.1127 %
Not equidistant test point 1
5(5
18.021
14.684
+22.725 %
7(7
14.879
14.684
+1.3279 %
9(9
14.838
14.684
+1.0488 %
Not equidistant test point 2
5(5
17.898
14.684
+21.888 %
7(7
14.869
14.684
+1.2599 %
9(9
14.842
14.684
+1.0760 %
Table 3
The influence of number of modes shape for buckling load
No. of test points
No. of modal shape
Analytical solution
Theoretical solution
Error ratio
The first mode
15.196
14.684
3.483 %
The second mode
14.911
14.684
1.548 %
7(7
The third mode
14.911
14.684
1.544 %
The forth mode
14.902
14.684
1.485 %
The fifth mode
14.895
14.684
1.438 %
Table 4
Coordinates positions of equidistant test points of circular plate
No. of test points
Aspect
Position
5(5
r direction
0, a/4, a/2, 3a/4, a
( direction
0, (/2, (, 3(/2, 2(
7(7
r direction
0, a/6, a/3, a/2, 2a/3, 5a/6, a
( direction
0, (/3, 2(/3, (, 4(/3, 5(/3, 2(
9(9
r direction
0, a/8, a/4, 3a/8, a/2, 5a/8, 3a/4, 7a/8, a
( direction
0, (/4, (/2, 3(/4, (, 5(/4, 3(/2, 7(/4, 2(
Table 5
Coordinates positions of not equally test point 1 of circular plate
No. of test points
Aspect
Position
5(5
r direction
0, a/5, a/2, 4a/5, a
( direction
0, (/2, (, 3(/2, 2(
7(7
r direction
0, a/8, a/4, a/2, 3a/4, 7a/8, a
( direction
0, (/3, 2(/3, (, 4(/3, 5(/3, 2(
9(9
r direction
0, a/10, a/5, 3a/10, a/2, 7a/10, 4a/5, 9a/10, a
( direction
0, (/4, (/2, 3(/4, (, 5(/4, 3(/2, 7(/4, 2(
Table 6
Coordinates positions of not equally test point 2 of circular plate
No. of test points
Aspect
Position
5(5
r direction
0, a/5, 2a/5, 7a/10, a
( direction
0, (/2, (, 3(/2, 2(
7(7
r direction
0, a/8, a/4, 3a/8, 7a/12, 19a/24, a
( direction
0, (/3, 2(/3, (, 4(/3, 5(/3, 2(
9(9
r direction
0, a/10, a/5, 3a/10, 2a/5, 3a/5, 4a/5, 9a/10, a
( direction
0, (/4, (/2, 3(/4, (, 5(/4, 3(/2, 7(/4, 2(
The theoretical formulas of natural frequency and modal shape of circular plate with fixed support are expressed as Eqs.(27) and (28) respectively. where, a is the radius and m, n=1, 2, …
Then, the circular plate with simple support is used as an example. According to the analysis results of Table 2, the 7×7 equidistant and not equidistant test points of the finite element method were selected to calculate modal parameters of natural frequency and modal shape. The theoretical buckling load with simple support of circular plate bearing uniform unit axial load Nrr and composed of five modal shapes, was derived and used for simulating the analysis modal shape. The analysis solutions were close to the theoretical solutions, shown in Table 7. These results indicate that the analysis method employing vibration experiment conjunction with modal analysis method to obtain the buckling load of a structural member is certainly practicable.
Table 7
The buckling load with simple support of circular plate bearing uniform unit axial load (Nrr=1)
No. of test points
Style of test point
Analytical solution
Theoretical solution
Error ratio
7(7
Equidistant test point
4.263
4.204
1.483%
Not equidistant point
4.248
4.204
1.047%
. OUTCOME OF ERROR ANALYSIS
The error produced in the experimental measurement and having bearing on the theoretical analysis model for obtaining the buckling load of structural members was investigated using 7×7 equidistant test points with cyclic fixed support of circular plate as an example. As regards five sets with maximum measuring error of 2%, 4%, 6%, 8% and 10%, it is noteworthy that one thousand simulations experiments were set up for each of the simulations. The analysis results are shown in Tables 8 and 9. These analysis results revealed that the error scope of dynamic measuring theoretical model of buckling load accorded with the increase of the maximum measuring error.
Table 8
The theoretical buckling load influenced by 2%, 4% and 6% maximum measuring error
2% maximum measuring error
4% maximum measuring error
6% maximum measuring error
Error ratio (%)
Times
Error ratio (%)
Times
Error ratio (%)
Times
Error ratio (%)
Times
Error ratio (%)
Times
Error ratio (%)
Times
(0.115
0
(0.225
0
0.015
47
(0.365
0
(0.125
30
0.115
8
(0.105
1
(0.215
2
0.025
34
(0.355
1
(0.115
25
0.125
5
(0.095
3
(0.205
4
0.035
29
(0.345
0
(0.105
28
0.135
5
(0.085
13
(0.195
5
0.045
30
(0.335
1
(0.095
30
0.145
4
(0.075
25
(0.185
14
0.055
22
(0.325
0
(0.085
32
0.155
2
(0.065
38
(0.175
18
0.065
18
(0.315
3
(0.075
26
0.165
3
(0.055
63
(0.165
23
0.075
19
(0.305
12
(0.065
41
0.175
1
(0.045
59
(0.155
39
0.085
12
(0.295
7
(0.055
36
0.185
0
(0.035
74
(0.145
29
0.095
17
(0.285
11
(0.045
31
0.195
1
(0.025
74
(0.135
31
0.105
8
(0.275
19
(0.035
38
0.205
0
(0.015
92
(0.125
35
0.115
4
(0.265
23
(0.025
35
0.215
1
(0.005
99
(0.115
31
0.125
4
(0.255
25
(0.015
27
0.225
0
0.005
96
(0.105
28
0.135
3
(0.245
22
(0.005
28
0.015
113
(0.095
44
0.145
1
(0.235
21
0.005
30
0.025
74
(0.085
29
0.155
1
(0.225
18
0.015
28
0.035
62
(0.075
35
0.165
0
(0.215
22
0.025
20
0.045
46
(0.065
39
0.175
1
(0.205
30
0.035
19
0.055
39
(0.055
42
0.185
0
(0.195
26
0.045
16
0.065
13
(0.045
58
(0.185
19
0.055
20
0.075
7
(0.035
38
(0.175
24
0.065
14
0.085
5
(0.025
50
(0.165
22
0.075
8
0.095
2
(0.015
46
(0.155
20
0.085
13
0.105
2
(0.005
61
(0.145
21
0.095
12
0.115
0
0.005
49
(0.135
27
0.105
9
Table 9
The theoretical buckling load influenced by 8% and 10% the maximum measuring error
8% maximum measuring error
10% maximum measuring error
Error ratio (%)
Times
Error ratio (%)
Times
Error ratio (%)
Times
Error ratio (%)
Times
Error ratio (%)
Times
Error ratio (%)
Times
(0.485
0
(0.205
19
0.075
5
(0.585
0
(0.305
15
(0.025
16
(0.475
1
(0.195
20
0.085
5
(0.575
1
(0.295
13
(0.015
19
(0.465
1
(0.185
29
0.095
7
(0.565
1
(0.285
13
(0.005
14
(0.455
0
(0.175
17
0.105
5
(0.555
1
(0.275
23
0.005
13
(0.445
1
(0.165
21
0.115
9
(0.545
0
(0.265
16
0.015
6
(0.435
2
(0.155
26
0.125
3
(0.535
3
(0.255
15
0.025
9
(0.425
5
(0.145
24
0.135
4
(0.525
5
(0.245
19
0.035
9
(0.415
5
(0.135
19
0.145
3
(0.515
2
(0.235
28
0.045
8
(0.405
5
(0.125
28
0.155
4
(0.505
4
(0.225
13
0.055
5
(0.395
9
(0.115
24
0.165
3
(0.495
6
(0.215
20
0.065
5
(0.385
4
(0.105
30
0.175
2
(0.485
4
(0.205
25
0.075
5
(0.375
18
(0.095
28
0.185
1
(0.475
15
(0.195
19
0.085
4
(0.365
14
(0.085
28
0.195
2
(0.465
12
(0.185
23
0.095
3
(0.355
20
(0.075
23
0.205
0
(0.455
6
(0.175
20
0.105
3
(0.345
16
(0.065
26
0.215
1
(0.445
14
(0.165
24
0.115
4
(0.335
21
(0.055
29
0.225
0
(0.435
12
(0.155
21
0.125
6
(0.325
17
(0.045
21
0.235
1
(0.425
19
(0.145
21
0.135
2
(0.315
25
(0.035
22
0.245
1
(0.415
17
(0.135
23
0.145
4
(0.305
13
(0.025
19
0.255
0
(0.405
16
(0.125
28
0.155
1
. CONCLUSION
The proposed theoretical analysis method using dynamic measurement to acquire the buckling load of the structural member is truly feasible. The advantages of this proposed analysis model are: (1) it is not constrained by the boundary conditions; (2) there is no need to apply axial load; (3) there is no need to know the detailed material properties. Only the modal parameters–natural frequency and mode shape are required by this analysis model to figure out the buckling load.
Take a circular plate using fixed cyclic support as an example for using this proposed analysis model to analyze its buckling load with equidistant and not equidistant test points. The analysis results revealed that this proposed method only needs to apply the modal parameters of 7×7 test points for acquiring the theoretical approximate values of buckling load. Moreover, the analysis method using not equidistant test points produces better analysis results, mainly because that the test points of this method gather around the inflection point of the deformation curve.
The results of error simulation experiment indicated (1) the error range of the buckling load enlarges with the increase of the maximum measured error; (2) in order to obtain more exact analysis solution of the buckling load with minimum error, doing the calculation several times and getting the mean value of them is suggested.
[1] Dym, C.L., 1974. Stability Theory and Its Applications to Structural Mechanics, Noordhoff Publishing Company, Groningen,:
[2] Go, C.G., Lin, Y.S., Khor, E.H., 1997. Experimental determination of the buckling load of a straight structural member by using dynamic parameters. Journal of Sound and Vibration, 205(3):257-267.
[3] Lurie, R., 1952. Lateral vibrations as related to structural stability. Journal of Applied Mechanic, 19(2):195-203.
[4] Meirovitch, L., 1967. Analytical Methods In Vibrations. , The Macmillan Company, :
[6] Segall, A., Baruch, M., 1980. A nondestructive dynamic method for determination of the critical load of elastic columns. Experimental Mechanics, 20(8):285-288.
[7] Segall, A., Springer, G.S., 1986. A dynamic method for measuring the critical loads of elastic flat plate. Experimental Mechanics, 26:354-359.
[8] Sweet, A.L., Genin, J., 1971. Identification of a model for predicting elastic buckling. Journal Sound Vibration and Vibration, 14(3):317-324.
[9] Sweet, A.L., Genin, J., Mlakar, P.F., 1976. Vibratory identification of beam boundary condition. Journal of Dynamic Systems, Measurement, and Control, 98:387-394.
[10] Sweet, A.L., Genin, J., Mlakar, P.F., 1977. Determination of column buckling criteria using vibration data. Experimental Mechanics, 17:385-391.

Open peer comments: Debate/Discuss/Question/Opinion
<1>