Affiliation(s):
1.
State Key Laboratory of Clean Energy Utilization, Zhejiang University, Hangzhou 310027, China; moreAffiliation(s): 1.
State Key Laboratory of Clean Energy Utilization, Zhejiang University, Hangzhou 310027, China; 2.
Institute for New Energy and Energy Saving Technology, Zhejiang University of Science and Technology, Hangzhou 310023, China; less
Xue-cheng Wu, Ying-chun Wu, Cong-chang Zhang, Guo-neng Li, Qun-xing Huang, Ling-hong Chen, Kun-zan Qiu, Hao Zhou, Ke-fa Cen. Fundamental research on the size and velocity measurements of coal powder by trajectory imaging[J]. Journal of Zhejiang University Science A, 2013, 14(5): 377-382.
@article{title="Fundamental research on the size and velocity measurements of coal powder by trajectory imaging", author="Xue-cheng Wu, Ying-chun Wu, Cong-chang Zhang, Guo-neng Li, Qun-xing Huang, Ling-hong Chen, Kun-zan Qiu, Hao Zhou, Ke-fa Cen", journal="Journal of Zhejiang University Science A", volume="14", number="5", pages="377-382", year="2013", publisher="Zhejiang University Press & Springer", doi="10.1631/jzus.A1200233" }
%0 Journal Article %T Fundamental research on the size and velocity measurements of coal powder by trajectory imaging %A Xue-cheng Wu %A Ying-chun Wu %A Cong-chang Zhang %A Guo-neng Li %A Qun-xing Huang %A Ling-hong Chen %A Kun-zan Qiu %A Hao Zhou %A Ke-fa Cen %J Journal of Zhejiang University SCIENCE A %V 14 %N 5 %P 377-382 %@ 1673-565X %D 2013 %I Zhejiang University Press & Springer %DOI 10.1631/jzus.A1200233
TY - JOUR T1 - Fundamental research on the size and velocity measurements of coal powder by trajectory imaging A1 - Xue-cheng Wu A1 - Ying-chun Wu A1 - Cong-chang Zhang A1 - Guo-neng Li A1 - Qun-xing Huang A1 - Ling-hong Chen A1 - Kun-zan Qiu A1 - Hao Zhou A1 - Ke-fa Cen J0 - Journal of Zhejiang University Science A VL - 14 IS - 5 SP - 377 EP - 382 %@ 1673-565X Y1 - 2013 PB - Zhejiang University Press & Springer ER - DOI - 10.1631/jzus.A1200233
Abstract: A trajectory imaging based method for measuring the velocity and diameter of coal particles was presented. By using an industrial charge-coupled device (CCD) camera and a low power semiconductor laser, the images of coal particles under relatively long exposure time were recorded and then processed to yield both the velocities and sizes. Fundamental research on this method with special attention to recording parameters, e.g., magnification factor and exposure time, was carried out. For most of the test cases, the results agree with those obtained by particle image velocimetry (PIV) and shadow imaging method. Measurements with good accuracy can be obtained when the imaging magnification factor and exposure time are set appropriately, making N be larger than 3.5, and R between 5–7, where N and R are the number of pixels occupied by the average width and the ratio of length to width of particle trajectory on the image, respectively. The work indicates the feasibility and potential application of the present measurement method for online measurement of coal powder in pipes in industrial power plants.
Darkslateblue:Affiliate; Royal Blue:Author; Turquoise:Article
Article Content
1. Introduction
Pneumatic conveyance of coal powder plays an important part in power plants, and it can influence the capacity of coal mills, efficiency of boiler combustion and the prevention of material degradation. In order to achieve the maximum efficiency of the power plant, it is necessary to measure the parameters of the flow in an on-line continuous manner, such as flow velocity and particle size distribution.
The available techniques for particle size and velocity measurement can be classified into three categories: probe methods, non-contact sensor techniques and optical imaging methods. A near forward scattering probe was proposed (Lee Black et al., 1996) for particle velocity and size measurement. However, the major disadvantage of the probe is its disturbance to flow field. Non-contact sensor techniques have been used for measuring pulverized coal concentration, such as capacitor (Hu et al., 2006) and γ-ray attenuation methods (Yan et al., 1994). Among the techniques for particle velocity measurement, particle image velocimetry (PIV) (Raffel et al., 2001; Adrian and Westerweel, 2010) is capable of measuring the velocity distribution of a particle flow field in planar (2D) fields instantaneously and non-invasively, but the high price and complexity of the system restrict its application in online industry monitoring and measurement. Phase doppler particle analyzer (PDPA) (Albrecht et al., 2002) and multi-pulses laser holographic technique (Malkiel et al., 2004) can obtain the velocity and size of particles at the same time. However, PDPA is a single-point technique, and the system of the holographic technique is considerably complex. In recent years, a novel system based on imaging the particle trajectory to measure both particle size distribution and volumetric concentration by combining electrostatic sensors was developed (Carter and Yan, 2003; Carter et al., 2005; Peng et al., 2008; Song et al., 2009). In their research, the velocity of particles is determined by the cross correlation of two signals derived from a pair of electrostatic sensors and the volumetric concentration of particles is obtained using a digital imaging sensor.
Pulverized coal in power plants has characteristics of strong absorption and weak scattering, which makes it difficult to get information of particle velocity and size through processing the particle’s transient image. The authors have developed an imaging-based system to study the scattering light of coal powder at different detection angles and exposure times. The previous study (Wu et al., 2011) showed that the trajectory image of the coal particle is very clear under relatively long exposure time. In the present paper, a trajectory imaging based method was proposed to measure the velocity and diameter of coal particles using a low-cost charge-coupled device (CCD) camera and a low power semiconductor laser, with special attention to the recording parameters, e.g., magnification factor and exposure time.
2. Methodology
2.1. Experimental system
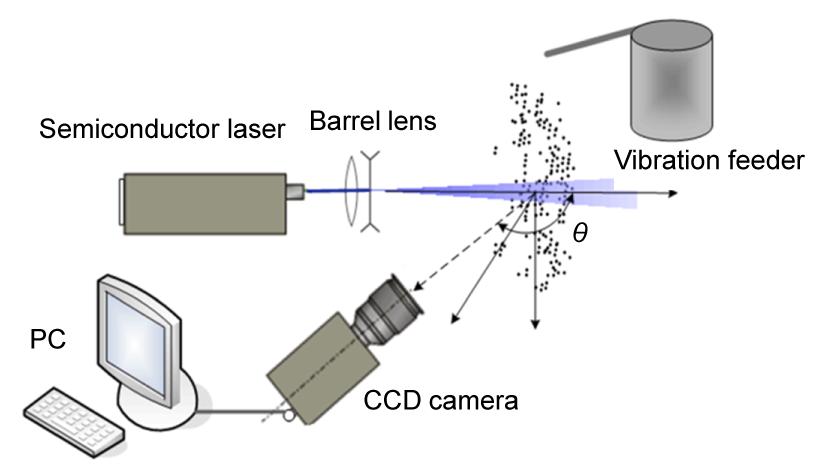
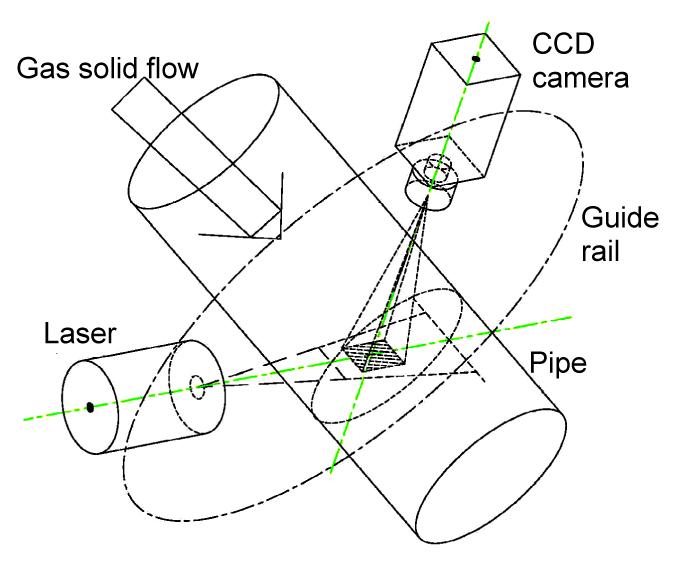
Fig. 1 shows the schematic of the particle trajectory imaging system. A 200-mW semiconductor continuous laser beam, with a wavelength of 532 nm, propagated to a cylindrical lens and was transformed into a laser sheet. The laser sheet passed through the particle field with the plane of the laser sheet parallel to the falling direction of the coal powder, and illuminated the trajectories of the particles. The side scattering of the particles was collected and projected to the plane of the CCD by an industrial microscope lens. The trajectory of the particles was digitized by the CCD with a resolution of 1392×1040, 2/3 inch (1 inch=2.54 cm) sensor chip and pixel size of 6.45 μm. The exposure time was adjusted to obtain a high quality image of the particle trajectory. The coal particle field was produced by a vibration feeder. To retrieve the absolute value of the particle velocity and size from the particle trajectory, calibration is necessary for further image processing. The calibration was carried out by taking a photo of a ruler bar which was located in the object plane (the plane of the laser sheet). By neglecting camera lens distortions, a simple linear pixel/mm scaling can be calculated based on the known distance between two points in the image of the ruler.
Fig.1 On-line PTV measurement system for coal particle flow
2.2. Data processing
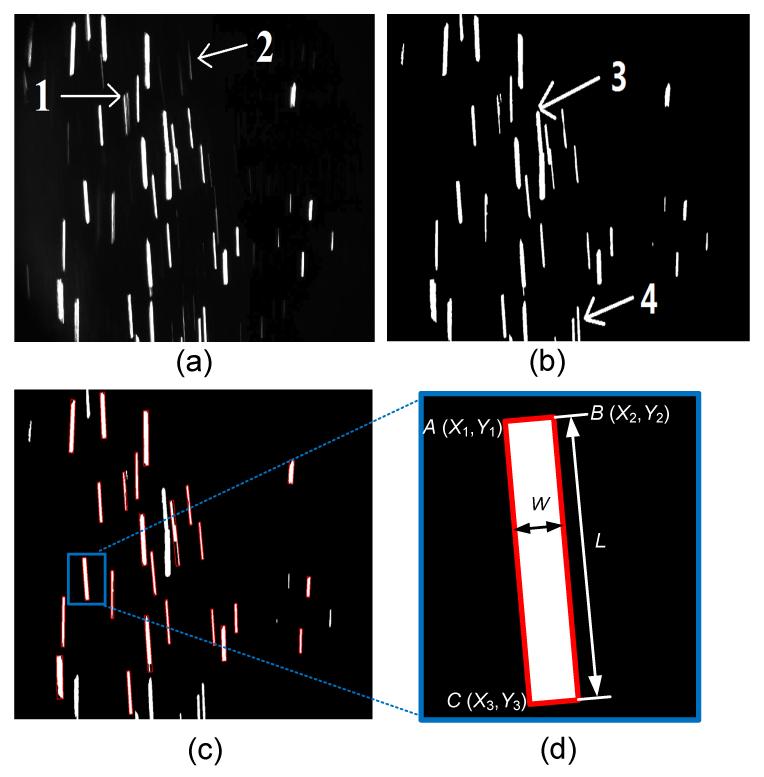
Fig. 2a shows a raw trajectory image of the coal particle field. Most of the trajectories are clearly recorded. A small number of the particle trajectories are not fully exposed (trajectory 1). In addition, the trajectories of some particles (such as trajectory 2), which may move out of the laser sheet, are fuzzy. The trajectory image was processed to retrieve the particle velocity and size, with the flow chart of the image preprocessing algorithm shown in Fig. 3. The raw image was firstly binarized by the Otsu algorithm (Otsu, 1979) to extract the particle trajectory from its background (Fig. 2b). Then morphology operations were applied to the binary image. Each connected region in binary images was labeled, except overlapping particles (trajectory 3) or those attached to the boundary (trajectory 4) (Fig. 2c). The circumscribed rectangle with the minimal area of each labeled region was computed. The computed rectangle vertex coordinates were used to calculate the length and width according to Eqs. (1) and (2) (Fig. 2d).
, ,
where Xi and Yi are the rectangle vertex coordinates in the x and y directions, respectively, i=1, 2, 3, as shown in Fig. 2d.
Fig.2 Image processing of typical trajectory image of the coal particle (a) Typical trajectory image; (b) Binary image; (c) Labeling the minimum bounding rectangle; (d) Extracting information from each trajectory
Fig.3 Image processing procedures
Let the CCD exposure time be δ and the imaging magnification be β, then the particle velocity u and diameter d can be obtained as follows:
, .
This algorithm was implemented in C++ program using Open Source Computer Vision Library (OpenCV) (Bradski and Kaehler, 2008). One hundred images can be processed in the batch processing mode within 4 s.
3. Results and discussion
In this section, the feasibility of the trajectory imaging method is firstly validated, and then the effects of recording parameters on the measurement results were investigated. Imaging spatial resolution, determined by the resolution and imaging magnification of the CCD chip, is related to particle diameter measurement, and exposure time of CCD is related to velocity measurement.
3.1. Validation
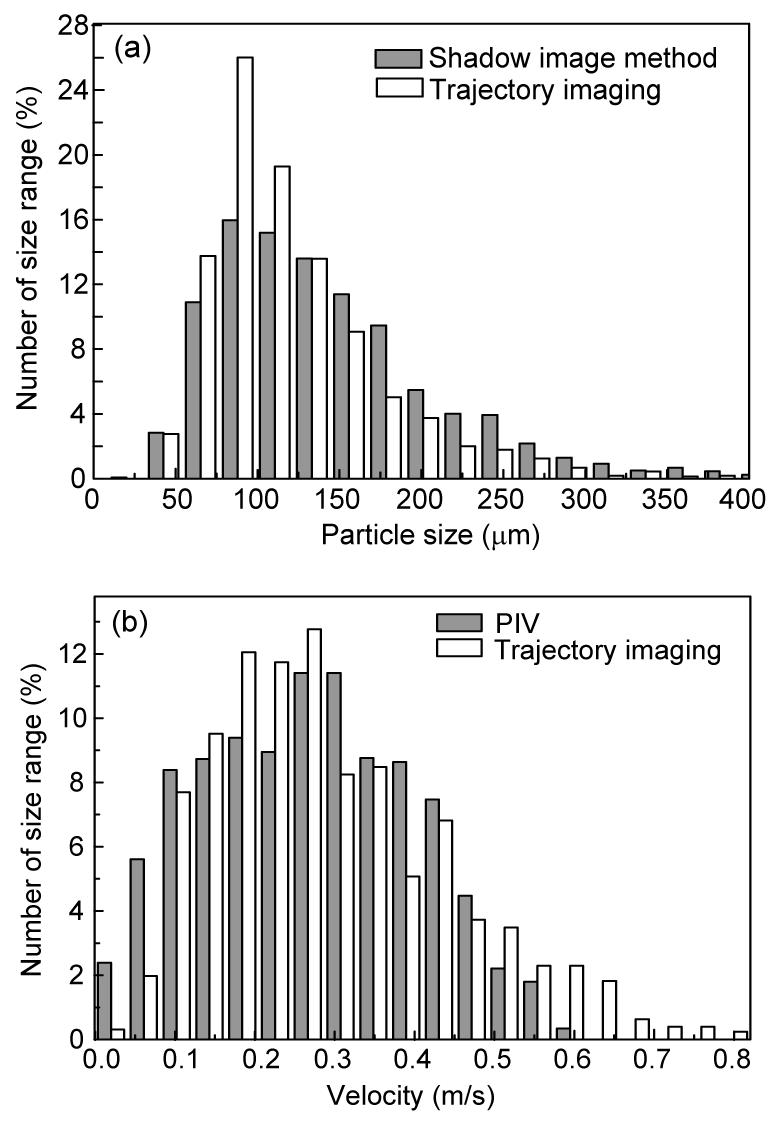
To validate the feasibility of simultaneously measuring the size and velocity of coal powder by trajectory imaging, about 2000 coal particles with a size range of 100–125 μm were recorded under the exposure time of 2 ms, and imaging magnification β=0.35. The obtained size and velocity were compared with that using the shadow image method and PIV, respectively. Fig. 4 shows a typical shadow image of the coal particles. As shown in Fig. 5, both the particle size distribution and velocity distribution from trajectory imaging agree generally with the results of the shadow image method and PIV. The discrepancy of mean diameter is 8%, with root mean square (RMS) of 23%, and the discrepancy of mean velocity is 9.8%, with RMS of 28%.
Fig.4 Typical shadow images of the coal particles
Fig.5 Comparison of particle size (a) and velocity distribution (b) results from trajectory imaging with those of shadow image method and PIV
The most obvious reason for such errors in particle size measurement is that a small number of coal particles were partly illuminated or not fully exposed, leading to the results from the trajectory imaging method to be lower than that of shadow image. Additionally, it is possible that particle overlapping could have contributed to this small discrepancy in velocity distribution between trajectory imaging and PIV. In spite of the issues discussed above, the results obtained are acceptable and the system shows great promise in online industrial measurement.
3.2. Imaging magnification β
In order to measure particle size and velocity distribution of a pneumatic conveyance flow, a suitable number of particle trajectories should be measured in the field of view, which is determined by CCD, imaging lens and the particle. A dimensionless parameter N, is the ratio of particle image size to CCD pixel size.
,
where dpix is pixel size, N characterizes the number of pixels occupied by the average width of the particle trajectories, and changes with imaging magnification β. Sufficient spatial resolution is needed to record information of the particle trajectory, so there is a minimal value Nmin of the corresponding βmin.
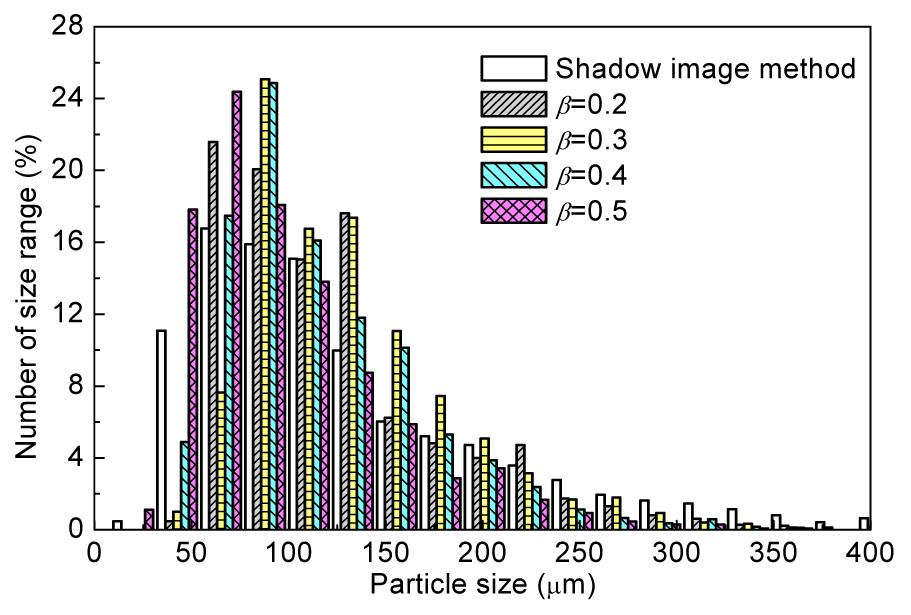
Fig. 6 shows the comparison of size distribution of the coal particles with a diameter of 74–100 μm obtained by the trajectory imaging method and shadow imaging method. It is carried out in different imaging magnifications with more than 1000 coal particles captured in each case.
Fig.6 Size distribution under various magnifications compared with shadow imaging method coal particle
Fig. 7 is the effect of N on the measurement inaccuracy. It indicates that the measurement inaccuracy decreases with the increase of N. The result is consistent with the shadow imaging method when N≥3.5. Thus, N=3.5 can be considered as the minimum imaging magnification parameter, with the corresponding imaging magnification β=0.26.
Fig.7 Discrepancies with different N
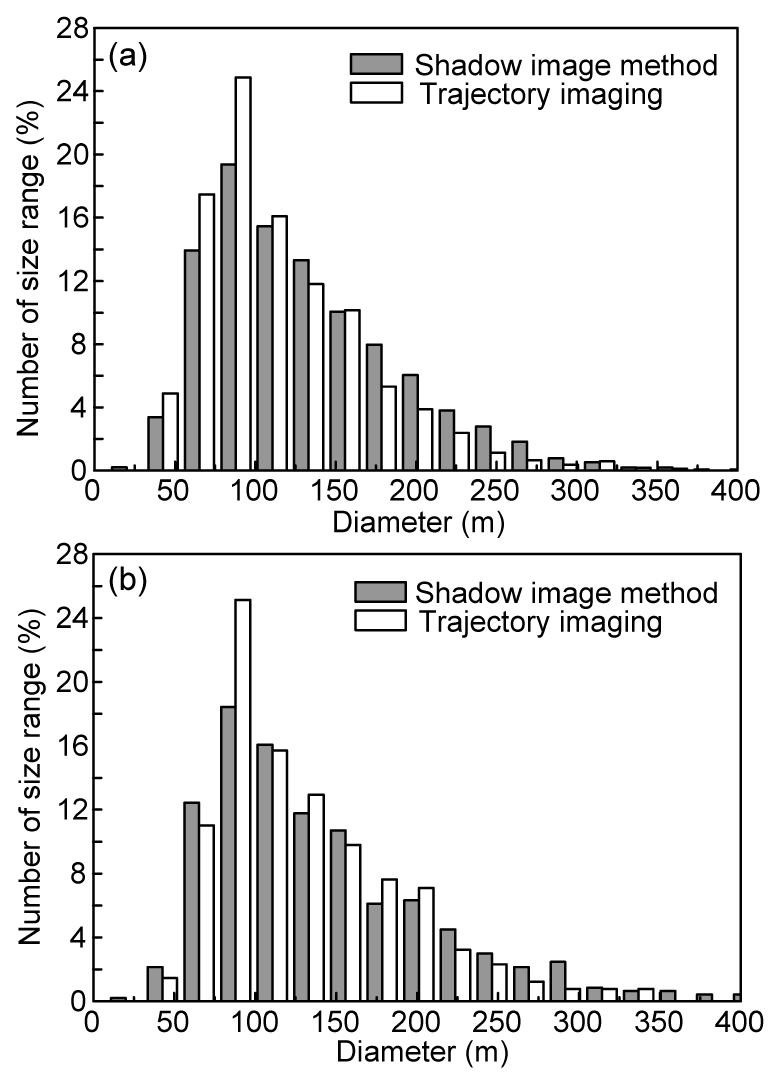
In order to verify the Nmin obtained above, coal particles with size range of 100–125 μm and 125–150 μm were measured under N=4. Fig. 8 is the trajectory imaging size distribution of 100–125 μm (Fig. 8a) and 125–150 μm (Fig. 8b) compared with the shadow imaging method. The consistency of the two measurements shows that Nmin is reasonable.
Fig.8 Different size distributions compared with those of shadow imaging method (a) 100–125 μm; (b) 125–150 μm
3.3. CCD exposure time δ
For a particle with a given velocity, the length of its trajectory is determined by the exposure time. A short trajectory obtained under short exposure time will lead to a large inaccuracy in velocity measurement. On the contrary, long exposure time will also reduce the measurement precision, because it increases the probability of overlapping of the particle trajectory. So the exposure time should be set appropriately. A dimensionless parameter is proposed to characterize the ratio of particle trajectory length to its width in the image:
.
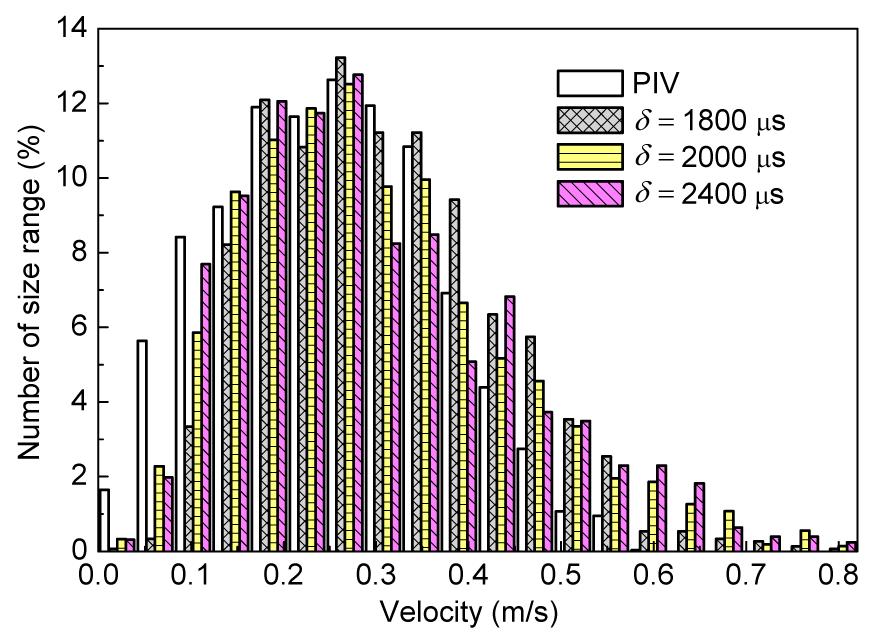
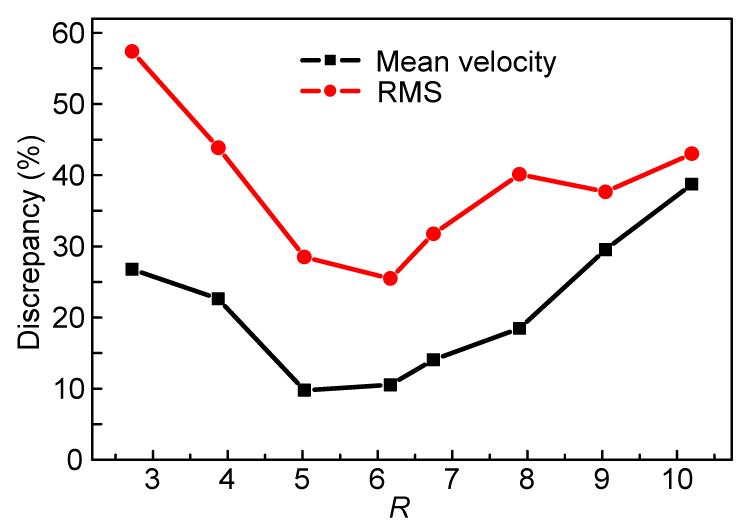
Fig. 9 shows the velocity distributions measured under various exposure times with particle size range 74–100 μm, and the comparison between the velocity measured by the tracing image and by PIV. The imaging magnification β is set to 0.4 according to the results in section 3.2. Table 1 is the discrepancy of velocity measurement versus R, as shown in Fig. 10. It indicates that the discrepancy of mean velocity maintains less than 25% and RMS 45% when R is in the range of 4–8. In general, the optimal range of R is 5–7, where the discrepancy of mean velocity maintains less than 15% and RMS 30%. There will be a substantial increase in both the discrepancy of mean velocity and RMS when R runs out of the optimal range.
Fig.9 Velocity distribution results under various exposure times (β=0.4)
Table 1
Experimental data under variable exposure time
Exposure time (μs)
R
Error of mean velocity (%)
Root mean square error of velocity (%)
600
2.7
26.8
57.4
1000
3.9
22.6
43.8
1400
5.0
9.8
28.5
1800
6.2
10.5
25.5
2000
6.8
14.1
31.7
2400
8.0
18.5
40.1
2800
9.1
29.5
37.6
3200
10.0
38.7
43.0
Fig.10 Discrepancy of variable R
The work presented here has shown that this online system is capable of measuring the particle size distribution and velocity of pulverized coal particle simultaneously. Fig. 11 shows the arrangement of this measurement system applied in an industrial situation. Note that at high concentrations this measurement system may become inaccurate due to many overlapping particle trajectories in the image, so the current system only works in relatively dilute phase flows, such as coal powder flow, typically with a mean particle diameter of 70 μm and solid concentration of 0.06–0.6 kg/kg in pipes in power plants. Another issue is the pipe fouling, which can be settled by boiler blowing.
Fig.11 Schematic diagram of industrial measurement system
4. Conclusions
This paper has presented a method for online size and velocity measurement of coal particles by imaging the trajectory. The trajectory images of coal particles were recorded by an industrial CCD camera and then processed to yield both the sizes and velocities. It is found that the results agree well with those from the shadow image method and PIV, which shows the feasibility of the present method for coal particle measurement. Further experiments with different imaging magnification factors and exposure times were carried out. Results reveal that both the imaging magnification factor and exposure time should be appropriately set to obtain a good measurement of particle velocity and size, making N larger than 3.5 and R between 5 and 7. This work can be a reference for choosing the appropriate recording parameters, which takes an important step towards successful application of the trajectory imaging method for coal particle measurement in coal fired power plants.
[2] Albrecht, H.E., Tropea, C., Borys, M., 2002. Laser Doppler and Phase Doppler Techniques. Springer Verlag,Berlin :
[3] Bradski, G., Kaehler, A., 2008. Learning OpenCV: Computer Vision with the OpenCV Library, OReilly Media,:
[4] Carter, R.M., Yan, Y., 2003. On-line particle sizing of pulverised and granular fuels using digital imaging techniques. Measurement Science and Technology, 14(7):1099-1109.
[5] Carter, R.M., Yan, Y., Cameron, S.D., 2005. On-line measurement of particle size distribution and mass flow rate of particles in a pneumatic suspension using combined imaging and electrostatic sensors. Flow Measurement and Instrumentation, 16(5):309-314.
[6] Hu, H.L., Xu, T.M., Hui, S.E., Zhou, Q.L., 2006. A novel capacitive system for the concentration measurement of pneumatically conveyed pulverized fuel at power stations. Flow Measurement and Instrumentation, 17(2):87-92.
[7] Lee Black, D., McQuay, M.Q., Bonin, M.P., 1996. Laser-based techniques for particle size measurement: a review of sizing methods and their industrial applications. Progress in Energy and Combustion Science, 22(3):267-306.
[8] Malkiel, E., Abras, J.N., Katz, J., 2004. Automated scanning and measurements of particle distributions within a holographic reconstructed volume. Measurement Science and Technology, 15(4):601-612.
[9] Otsu, N., 1979. A threshold selection method from gray-level histograms. Automatica, 11:285-296.
[10] Peng, L.H., Zhang, Y., Yan, Y., 2008. Characterization of electrostatic sensors for flow measurement of particulate solids in square-shaped pneumatic conveying pipelines. Sensors and Actuators A: Physical, 141(1):59-67.
[11] Raffel, M., Willert, C., Kompenhans, J., 2001. Particle Image Velocimetry. Springer,Berlin Heidelberg New York :
[12] Song, D., Peng, L.H., Lu, G., Yang, S.Y., Yan, Y., 2009. Velocity measurement of pneumatically conveyed particles through digital imaging. Sensors and Actuators A: Physical, 149(2):180-188.
[13] Wu, X.C., Cen, K.F., Chen, L.H., 2011. On-line Measurement Method and Apparatus of Two-dimensional Velocity and Size Distribution of Particles in Pipe. , :
[14] Yan, Y., Byrne, B., Coulthard, J., 1994. Radiometric determination of dilute inhomogeneous solids loading in pneumatic conveying systems. Measurement Science and Technology, 5(2):110-119.
Open peer comments: Debate/Discuss/Question/Opinion


Open peer comments: Debate/Discuss/Question/Opinion
<1>