Affiliation(s):
1.
College of Civil Engineering and Architecture, Zhejiang University, Hangzhou 310058, China; moreAffiliation(s): 1.
College of Civil Engineering and Architecture, Zhejiang University, Hangzhou 310058, China; 2.
Zhejiang Electric Power Design Institute, Hangzhou 310012, China; less
Yong Chen, Ji-yang Wang, Yong Guo, Guo-hui Shen, Li-xian Yang, Bin-nan Sun. Behavior of axially loaded tubular X-joints using bolted connection: mechanical model and validation[J]. Journal of Zhejiang University Science A, 2013, 14(12): 880-889.
@article{title="Behavior of axially loaded tubular X-joints using bolted connection: mechanical model and validation", author="Yong Chen, Ji-yang Wang, Yong Guo, Guo-hui Shen, Li-xian Yang, Bin-nan Sun", journal="Journal of Zhejiang University Science A", volume="14", number="12", pages="880-889", year="2013", publisher="Zhejiang University Press & Springer", doi="10.1631/jzus.A1300207" }
%0 Journal Article %T Behavior of axially loaded tubular X-joints using bolted connection: mechanical model and validation %A Yong Chen %A Ji-yang Wang %A Yong Guo %A Guo-hui Shen %A Li-xian Yang %A Bin-nan Sun %J Journal of Zhejiang University SCIENCE A %V 14 %N 12 %P 880-889 %@ 1673-565X %D 2013 %I Zhejiang University Press & Springer %DOI 10.1631/jzus.A1300207
TY - JOUR T1 - Behavior of axially loaded tubular X-joints using bolted connection: mechanical model and validation A1 - Yong Chen A1 - Ji-yang Wang A1 - Yong Guo A1 - Guo-hui Shen A1 - Li-xian Yang A1 - Bin-nan Sun J0 - Journal of Zhejiang University Science A VL - 14 IS - 12 SP - 880 EP - 889 %@ 1673-565X Y1 - 2013 PB - Zhejiang University Press & Springer ER - DOI - 10.1631/jzus.A1300207
Abstract: X-joints are one of the fundamental joint configurations used in a wide range of transmission tubular structures. Experimental investigation of four tubular X-joints with bolted connection was conducted in this study, and it was found that the annular plate was the main yielding control member of such X-joints. Moreover, the portion outside the effective width of the chord member still had a restriction effect on the annular plate, which led to reducing the yielding strength of the joint, while the gusset plate could help to improve the yield strength capacity. In the current design code of steel structures, the contribution to the strength capacity of the gusset plate has not been taken into account. Therefore, based on some mechanical assumptions, a general mechanical model was proposed. After the introduction of the gusset platestrength capacity factor, the yield capacity simplified calculation method of such X-joints was derived. Through the analyses of such X-joints with various diameters and thicknesses, it was concluded that a simple mechanical model could predict test results very well and that the contribution of the gusset plate was also taken into account.
Darkslateblue:Affiliate; Royal Blue:Author; Turquoise:Article
Article Content
1. Introduction
Strength and stiffness are the most common focus in current steel tubular joint researches. Extensive theoretical calculations and finite element method (FEM) analysis have been studied all over the world. Dexter and Lee (1999a; 1999b), Lee and Gazzola (2006), and Gho and Yang (2008) investigated the tubular cap K-joints and/or overlap K-joints, and developed a set of calculation formulas on the ultimate strength capacity. Soh et al. (2000) established two theoretical models on the strength capacity of axially loaded X-joint, considering the yield line theory. However, the chord members (main pipes) were directly connected without gusset plates or annular plates. Choo et al. (2004) extended the numerical study to doubler plate reinforced tubular X-joints, compared to corresponding un-reinforced joints. However, they did not consider the combined effect of axial force and axial brace force. Paul et al. (1994) studied the ultimate strength capacity of the steel tubular joints under multi-direction axial load through the FEM analysis and the experimental tests, and then obtained the calculation formula according to multiple regression. Liu and Guo (2001) applied the non-linear FEM to analyze the large elasto-plasticity deformation of four different types of tubular joint, and obtained the variation rule of the ultimate strength capacity with the geometrical parameter of the joints, but the calculation method on the yield strength was not utilized. Kim (2001) investigated the behavior and ultimate strength of axially loaded tube-gusset connections. An efficient numerical model was suggested to consider the combined effect of axial force and moment. Yam and Cheng (2002) also conducted 13 full-scale tests to investigate the compressive behavior and strength of gusset plate connections. The test results indicated that significant yielding of the gusset plate specimens occurred prior to reaching the ultimate load. You et al. (2010) analyzed the 1/4 annular plate enhanced K-joint, and obtained the influential coefficient of the chord member axial load on the strength capacity. Bao et al. (2008) suggested a cross-section deformation model on the ultimate strength capacity of the K-joint, introduced the ring generatrix model, and obtained the calculation formula on the joint ultimate strength capacity through the virtual work principle of the energy gradient. However, most models mentioned above were proposed for welded joints. Then van der Vegte et al. (2010) gave an overview of the main aspects of the FEM analysis relevant to welded joints and bolted joints. In a further example, relevant details were given of explicit FEM analysis on large-scale bolted connections.
In this study, the X-type steel tubular joint was set as the research object, the former calculation formula deduction methods on the multi-type joint strength capacity were referenced, and the simplified calculation model was established through theoretical analysis. The mechanical characteristics of the joint were analyzed through the experiments and the FEM analysis, and the empirical formula of the joint yield strength was obtained through fitting. The increased coefficient of the gusset plate on the joint strength capacity was considered in the analysis. The yield capacities of the joints with other dimensions were obtained by the FEM analysis, and were compared with the results using an empirical formula.
2. Experiments
2.1. Specimen and loading system
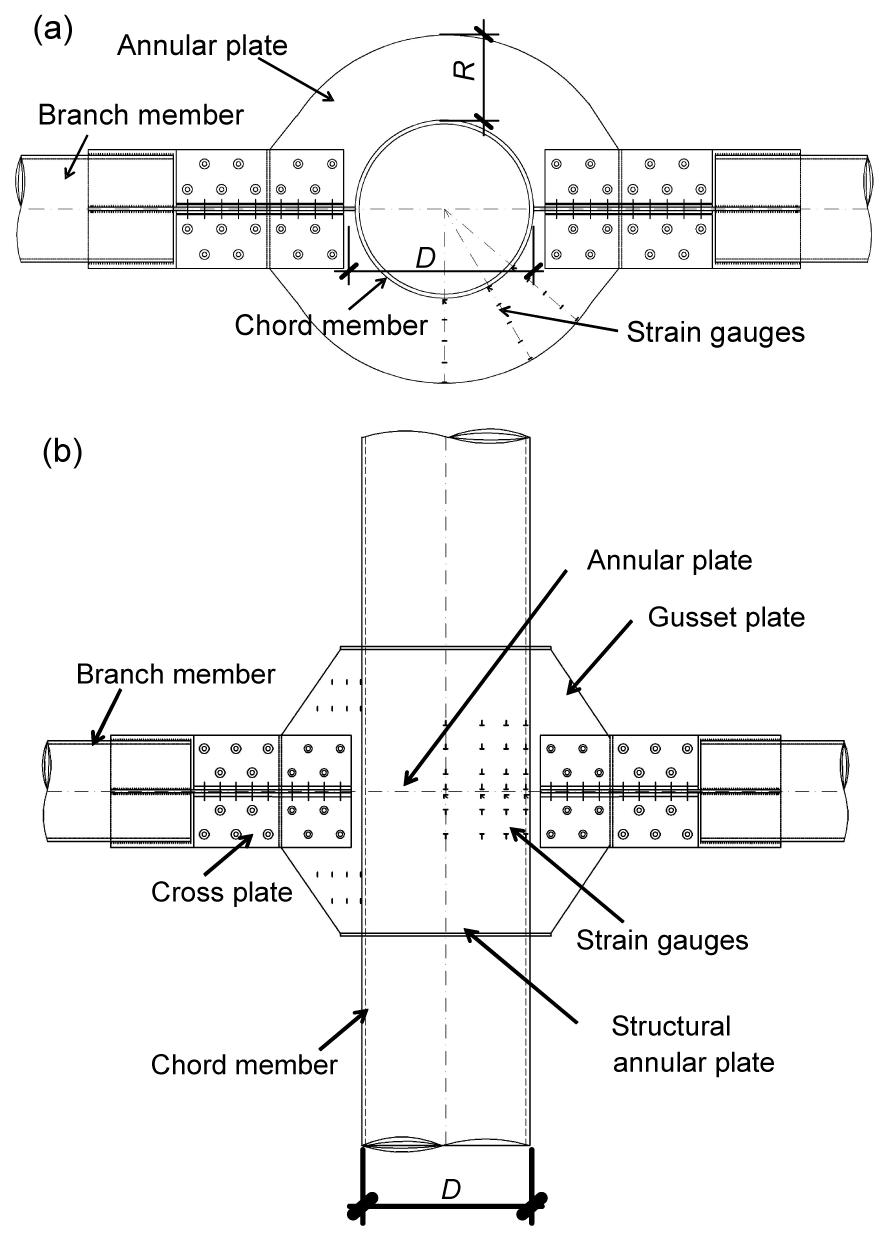
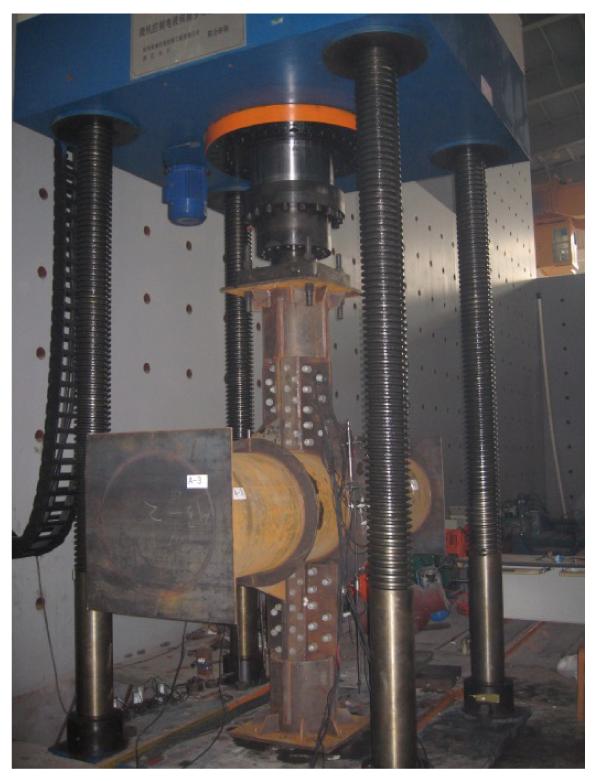
The X-joint in this study was a bolted connection of the steel tubular chord member with the steel tubular branch member by an annular plate and a gusset plate, which could be named as four types: X-1, X-2, X-3, and X-4. The dimension and the detail of the X-joints are shown in Table 1 and Fig. 1, respectively. The loading system was a YAW-10000F microprocessor control electro-hydraulic servo multi-functional testing machine. The photo of the specimen set up on the loading system is shown in Fig. 2.
Table 1
Dimension of specimens
Serial
Chord member
Branch member
Junction plate
Annular plate
Gusset plate
Length, L
Diameter/Thickness, D/T
Diameter/Thickness, d/t
Width/Thickness, R/h
Height×Width/Thickness, H×B/b
X-1
2650
630/14
377/14
400/12
530×400/12
X-2
2650
630/14
377/14
200/12
530×200/12
X-3
1680
325/6
219/10
200/10
280×200/10
X-4
1680
325/6
219/10
100/10
280×100/10
Fig.1 Experimental detail of X-joint specimen (a) Plan view; (b) Elevation view
Fig.2 Experimental setup photograph
2.2. Experimental results and analyses
As shown in Fig. 1, the strain rosette was arranged at the strain monitoring point of the annular plate. The linear strains at three different directional locations of 0°, 45°, and 90° for each measuring point were then obtained, and named as ε0, ε45, and ε90, respectively.
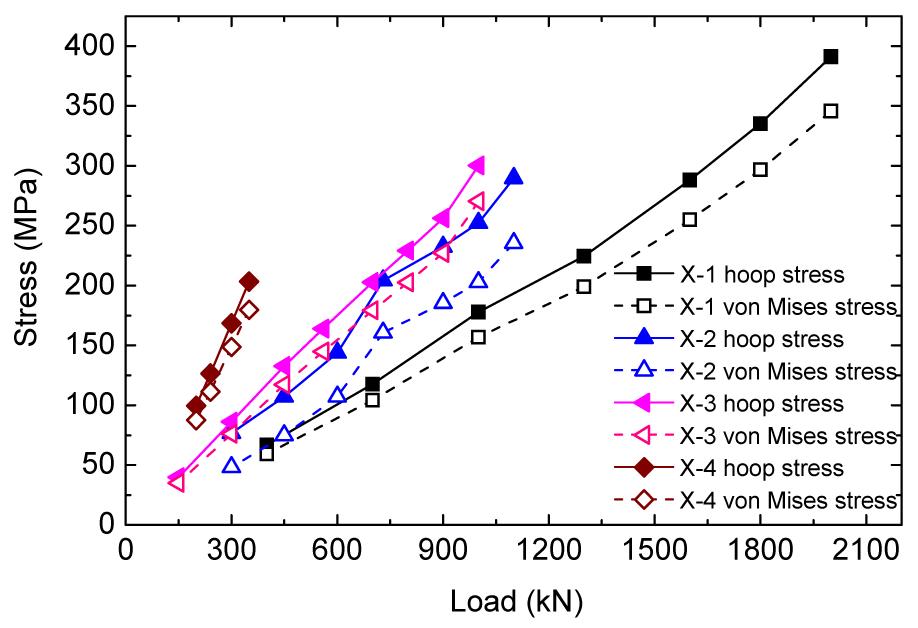
The hoop stress curve for the annular plate cross-section of the X-2 joint under the load is shown in Fig. 3. The horizontal ordinate meant the measure point location, while 0 meant the contact surface of the chord member, and the vertical ordinate meant the normal stress of the cross section. Note that the distribution of the stress with the section height was approximated to be linear, which could be considered as meeting the planar interface assumption. The average stress on the section was calculated by
,
where σ+, σ−, and A are the sectional normal stress, sectional negative stress, and sectional area, respectively. A+ and A− are the sectional areas of σ+ and σ−, respectively.
Fig.3 Hoop stress curve for the annular plate cross-section of X-2 joint (a) Hoop stress-measurement location; (b) Measurement location
The principal stress could be obtained by the linear strains (ε0, ε45, ε90) at three directional locations measured at each strain measure point as
,
,
where E and υ are the elasticity modulus and Poisson’s ratio, respectively. Then the equivalent von Mises stress of the measure point was
.
The curves for the equivalent von Mises stress on the middle section of the annular plate with the annular normal stress at each joint under the load are shown in Fig. 4, where they could be found to be relatively close. Therefore, it was reasonable to determine the strength capacity of the joint by directly using the hoop stress in the simplified model.
Fig.4 Hoop stress and von Misses stress on the middle section of the annular plate
3. Mechanical model and formula
3.1. Assumptions
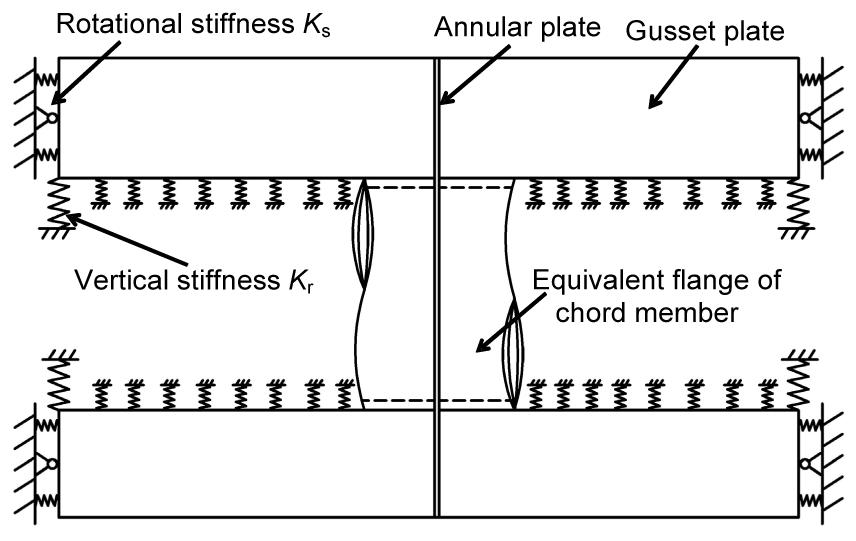
For the X-joint, the mechanical characteristic was basically reflected by adopting the simplified mechanical model in Fig. 5. The main mechanical simplifications were as follows:
T-type annular beam: T-beam was adopted to replace the annular plate of the joint. The effective length of the chord member and the annular plate were taken as the flange and the web of T-beam, respectively.
Flexible support: the support effect of the steel tubes outside the effective flange on the T-type beam and the change of the effective flange width with the arc length of the annular plate were both simulated with the flexible support.
Basis of the annular plate stress yield: the load when the hoop stress on the middle section of the annular plate reached the yield stress was taken as the designed value of the load as used normally.
Fig.5 Simplified calculation model for the X-joint
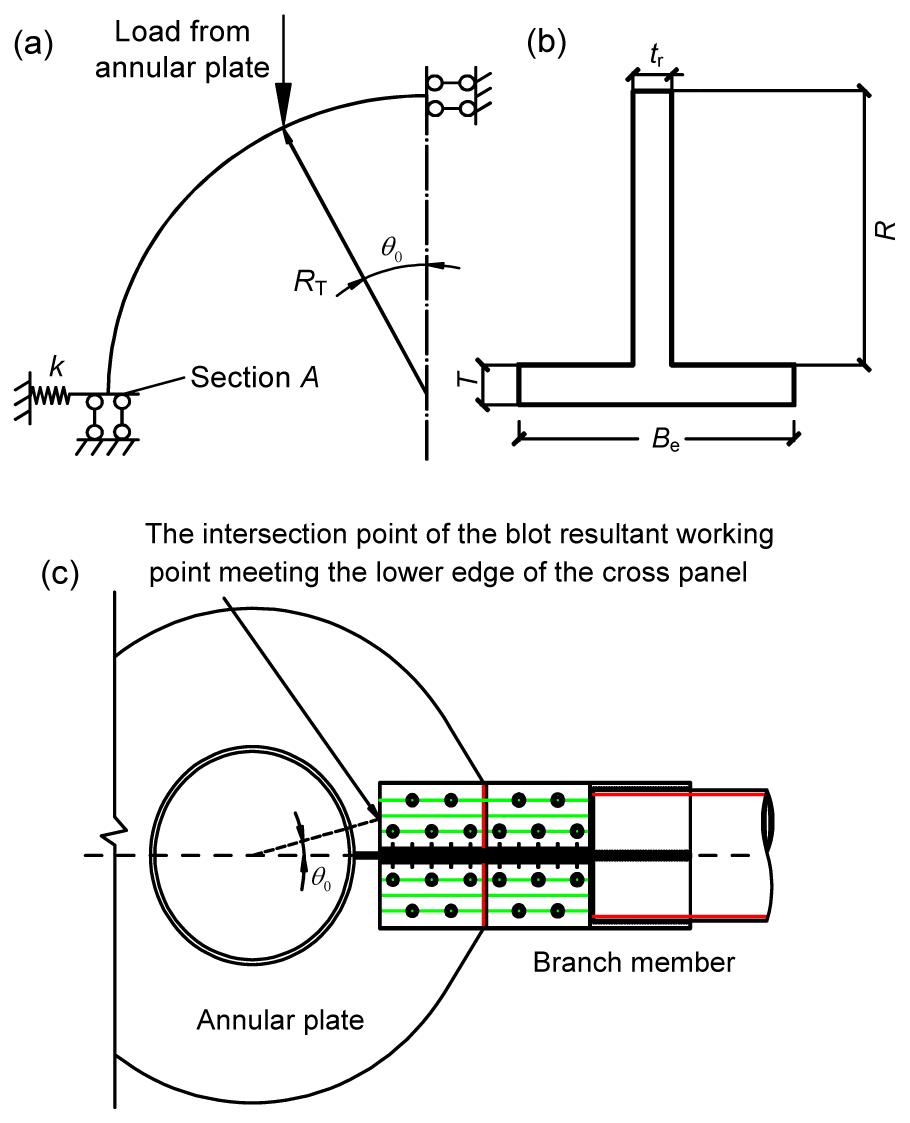
According to the simplified method above and the plan cross-section assumption verified by experiments, the yield criterion was chosen according to the normal stress on the section, and the calculation diagram was obtained as shown in Fig. 5. In the mechanical model shown in Fig. 5, RT is the calculated radius of the curvature of the T-annular beam, Be is the effective flange width, T is the flange height, namely the wall thickness of the chord member (main pipe), the web width tr is the thickness of the annular plate, and the web height R is the annular plate width. The spring support set at support A was mainly reflected by the spring stiffness coefficient k. θ0 was relevant to the bolt resultant force action point and then determined by the cross-point of the resultant force action point of all the bolts on the one side and the lower edge of the cross-shaped connection plate (Fig. 6c).
Fig.6 Simplified calculation diagram of the X-joint annular plate (a) Computational model; (b) Cross-section of T-type annular beam; (c) Definition of θ0
3.2. Simplified formula derivation
The parameters used in the simplified formula derivation are as follows: IT, AT, and iT are the sectional moment of inertia, the sectional area, and the turning radius, respectively; YN and YW are the distances from the section centroid of the T-type annular beam to the inwall of the chord member and the external rim of the annular plate, respectively; IH and RH are the sectional moment of inertia and the curvature radius of the T-type annular beam as only the annular plate is considered, respectively; IZ and RZ are the section moment of inertia and the curvature radius of the T-type annular beam as only the chord member is considered, respectively; IL and HL are the section moment of inertia and the height of the T-type beam, respectively.
The FEM analysis indicated that the effective flange width of the T-type annular beam changed with the arc length. However, the normal stress on the central section of the annular plate was adopted as the control stress to determine the yield point. Therefore, the equivalent flange width of the section was adopted as the flange width of the whole T-type annular beam with a uniform section. The Thurlimann formula as Eq. (5) was adopted to calculate the T-type annular beam flange width in the simplified calculation formula.
,
where RZ=(D−T)/2 and D is the outer diameter of the chord member.
Considering the yield location of the annular plate could be the inside compression yield or the outside tension yield, Eq. (6) was used to determine the yield load.
,
where PW is the outside tension yield load, while PN is the inside compression yield load. If the joint plate existed as the experimental result and the FEM result was analyzed, the part outside of the effective flange of the chord member would have a certain restraint effect on the annular plate, and remarkably reduce the yield strength of the annular plate. Therefore, in the simplified calculation model, this factor would be considered as a stiffness support, and the stiffness coefficient was set as k. Based on this, the joint yield strength capacity could be deduced as
,
where
,
,
where σy is the yield strength of steel, and η is the load sharing coefficient. The load taken by the annular plate and the gusset plate is distributed according to the stiffness ratio. γ1 and γ2 are the section plasticity development coefficients with reference to the steel structure code (GB50017-2003). λ is the coefficient being relevant with the bending moment on the central section (section A in Fig. 6), i.e.,
,
where α and β are the coefficients being relevant with the force action point (determined according to the bolt location). θ0 as shown in Fig. 6 could be calculated by
.
To determine the spring coefficient k in Eq. (8) and the load sharing coefficient η in Eq. (7a), the load proportion distribution coefficient ξ is defined as
,
where PH is the load taken by the annular plate, and PL is the load taken by the ribbed plate. From the simplified calculation model, k can be calculated with the known load and the bending moment of section A:
.
The axial load of the section is
.
The bending moment M can be calculated according to
.
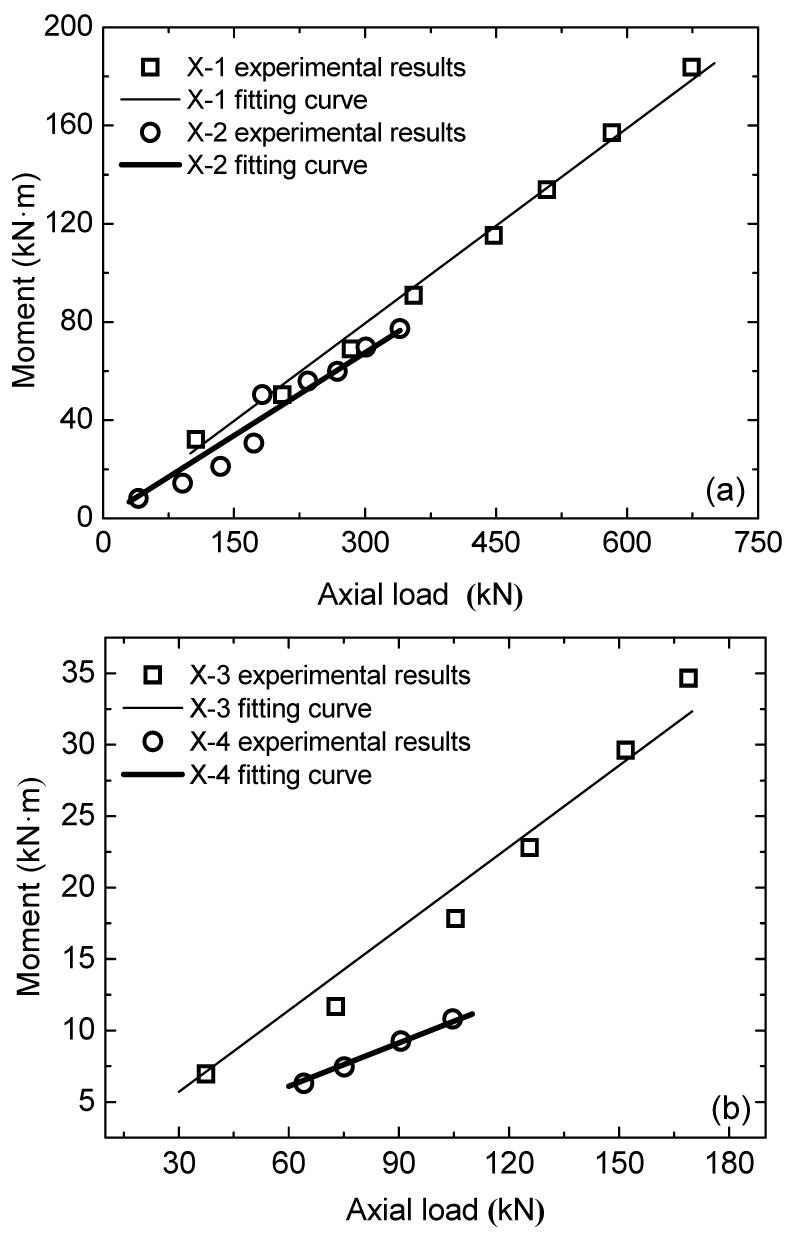
From Eq. (11), it can be observed that k is relevant with the ratio of M to N, the changing curves of the section bending moment at the four experimental X-joints with the axial load are shown in Fig. 7. From Fig. 7 it could be found that the relation of M with N was linear, thus the ratio of M to N was constant. The value of k for the four X-joints could be calculated and is listed in Table 2.
Fig.7 Axial force-bending moment relation (a) X-1 and X-2; (b) X-3 and X-4
Table 2
Flexible support stiffness coefficients of X-joints (N/mm)
Joint
k
X-1
−437 184.58
X-2
−94 510.65
X-3
−452 800.18
X-4
−79 276.77
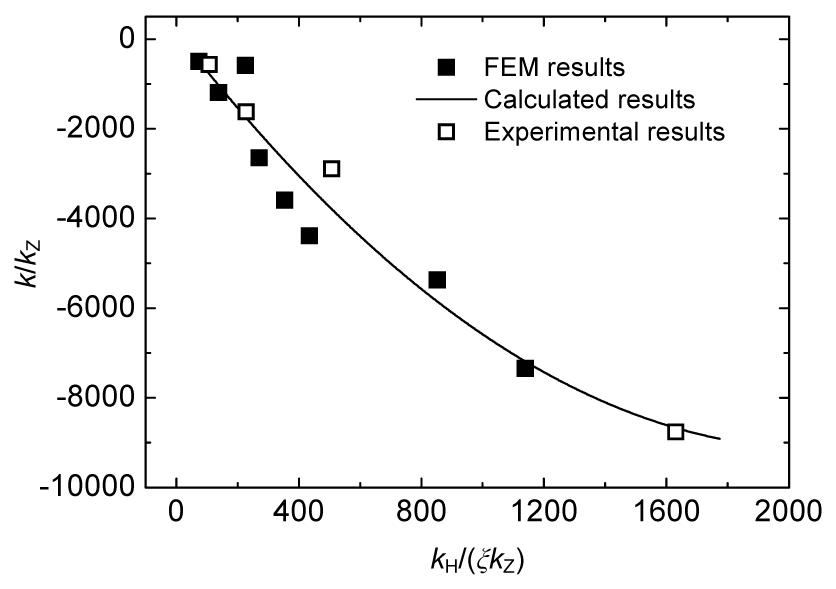
The variable was nondimensionalized, then assuming kH=EIH/rH3 and kZ=EIZ/rZ3, the experimental result was fitted with the calculated result (Fig. 8), and the empirical formula of k was obtained as
,
where IH, RH, IZ, and RZ can be calculated according to Eq. (15), while the section width adopted in IZ was , namely,
.
Fig.8 Fitting curve for the elastic stiffness k of AN-type joint
The load distribution coefficient η is determined by
.
In the intersecting-beam, as PH and PL were not determined, the load proportion distribution coefficient ξ could be calculated according to the stiffness (or flexibility) of the intersecting beam, namely,
,
where δH is the flexibility of the T-type annular plate in the intersecting-beam at the cross point under the unit load, which is expressed as
.
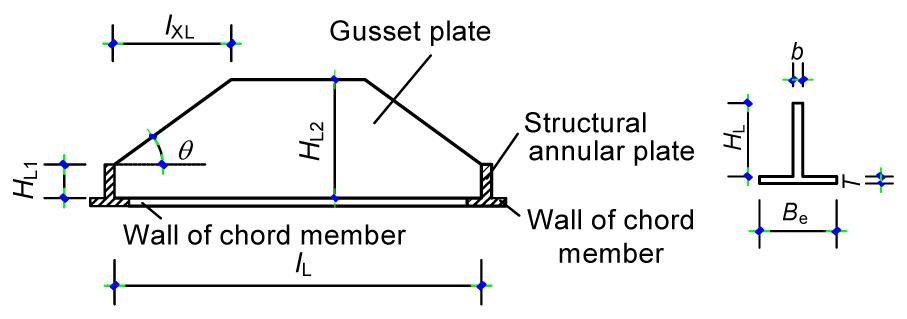
δL is the flexibility of the gusset plate in the intersecting-beam at the cross point under the unit load, the gusset plate was also considered as the T-beam, which was shown in Fig. 9. In Eq. (19), lL is the beam length, lH=2H, where H is the distance between the joint annular plate and the structural annular plate. The gusset plate inertia moment IL was calculated according to the T-type section with a uniform section and the flange. The result of the Thurlimann model was then taken as the flange width of the T-type beam section, namely the Be determined in Eq. (6). The web plate width of the T-beam was the web plate thickness b, the equivalent height was adopted to calculate the beam height HL, which is shown in Eq. (20):
,
,
where HL1 is the gusset plate width at the intersection of the gusset plate and the structural annular plate, HL2 is the gusset plate width at the intersection of the gusset plate and the annular plate, and ρ and μ are the reduction coefficients with consideration of the cutting angle θ (Fig. 9). As θ≤π/9, ρ=1.0, and μ=1.0; as θ=π/4, ρ=0.85; as π/9<θ<π/4, ρ could be obtained by interpolation. μ=1.75−3lXL/lL, and μ was 1 if μ was larger than 1. lXL is the length of the cutting angle (0<lXL<0.5lL). The proportionality coefficient of each X-joint was listed in Table 3.
Table 3
Load proportion distribution coefficient ξ and the annular plate load sharing coefficient η
of each X-joint
Specimen
ξ
η
Average experi-mental value
Calcula-tion value
Experimental value
Calculation value
X-1
1.27
1.60
1.79
1.63
X-2
1.30
1.72
1.77
1.58
X-3
0.91
1.23
2.10
1.81
X-4
1.62
1.80
1.62
1.56
Fig.9 Calculation model of T-type ribbed plate beam
3.3. Comparison of the simplified result and the code result
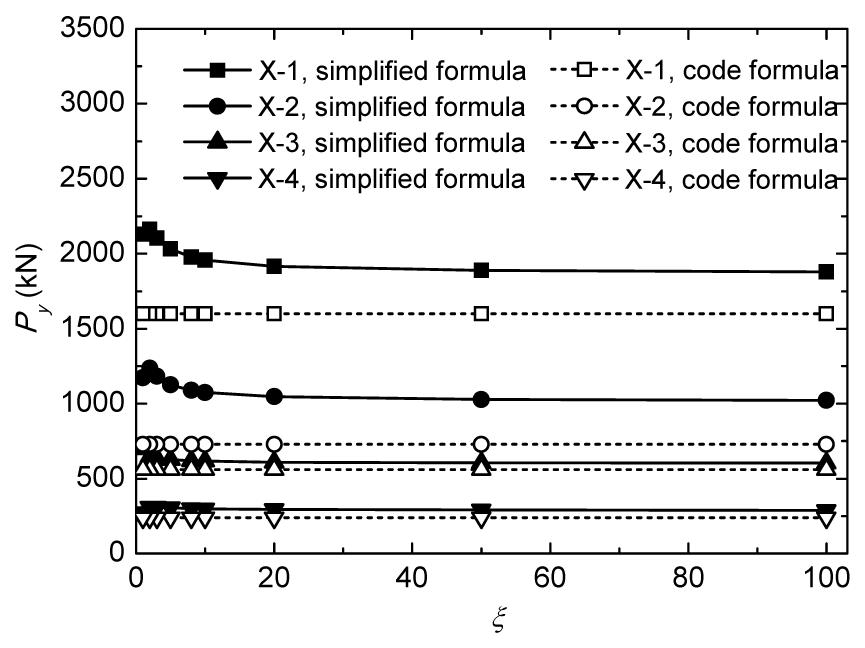
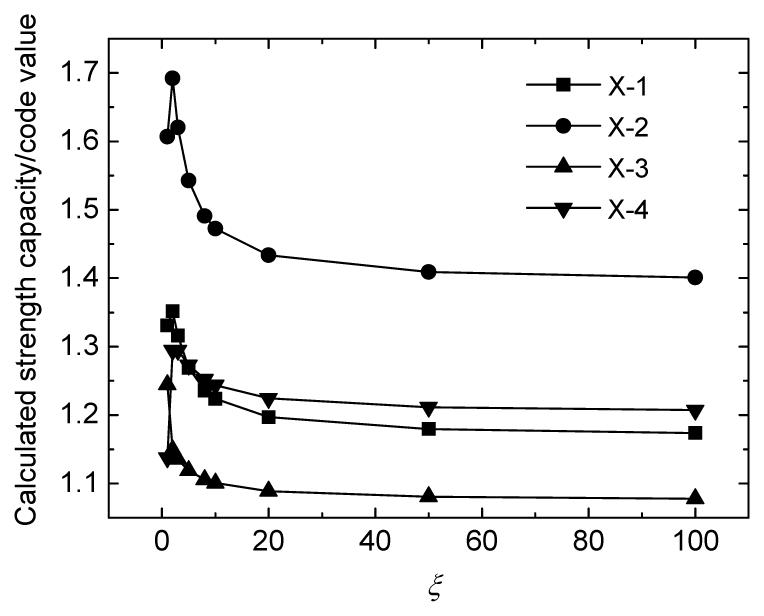
Eq. (6) was applied to calculate four specimens X-1, X-2, X-3, and X-4, and by changing the load proportion distribution coefficient ξ, the calculated strength capacities Py of four specimens could be obtained (Fig. 10), where the result of code was also given (Q/GDW391-2009). The ratio curve for the two above is as shown in Fig. 11. It can be observed that the strength capacity obtained by the simplified calculation formula was higher than the code calculation result. As the gusset plate load sharing effect was smaller (ξ>5), and the annular plate width with the same chord member diameter was larger, the simplified calculation result was closer to the code result.
Fig.10 Relation of strength capacity using simplified formula and code formula with ξ
Fig.11 Relation of ratio of the calculated strength capacity to the code value with ξ
3.4. Yield strength capacity
The total strength capacity of the joint could be divided into two parts, one was undertaken by the annular plate, the other was undertaken by the gusset plate and the bilateral structured annular plate. Therefore, the total strength capacity was relevant with the load distribution ratio. For the convenience of comparison, the calculation result in Fig. 4 was based on the stress of the test point reaching the yield. It could be observed in Table 4 that the results of X-3 and X-4 were quite close to that obtained from the simplified approximation formula, and the deviation for X-1 or X-2 was around 20%.
Table 4
Comparison between experimental and analytical results
Specimen
Experimental results
Analytical results
Py
Yield location
Py
Yield location
Experimental value/calculation value
X-1
1785.1
Inside test point
2278.5
Inside test point
0.78
X-2
893.7
Outside test point
1085.9
Outside test point
0.82
X-3
898.5
Outside test point
853.1
Outside test point
1.05
X-4
367.0
Outside test point
349.7
Outside test point
1.05
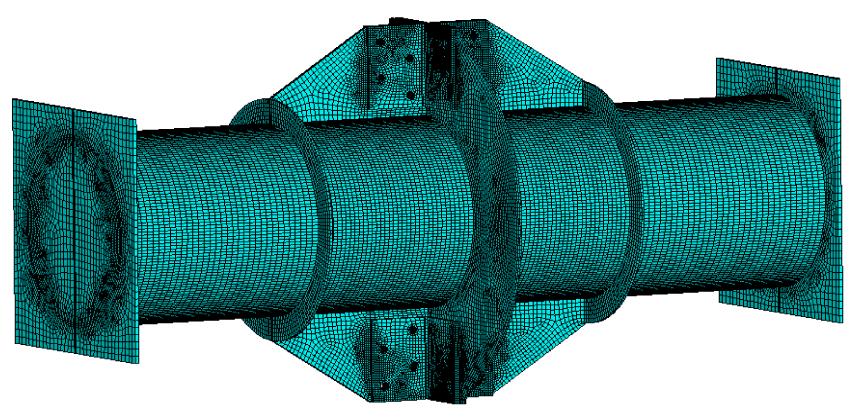
3.5. Finite element analysis
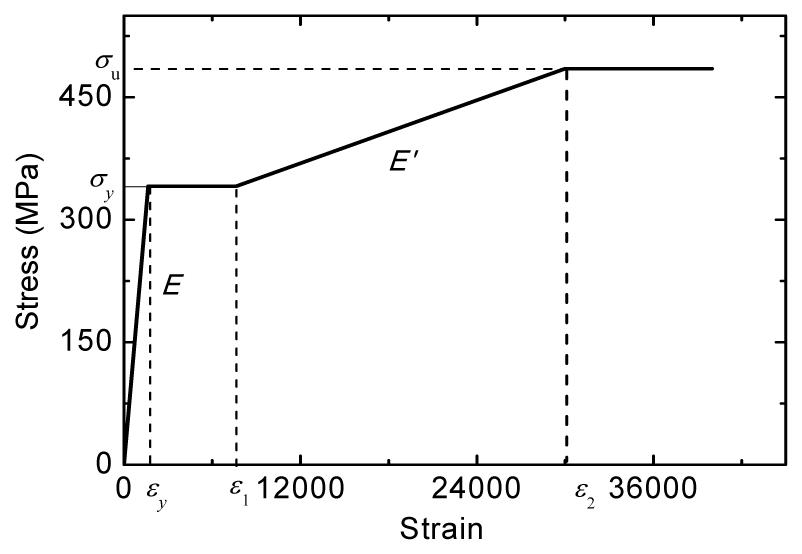
FEM models for all specimens were established using ANSYS software. The solid45 unit was selected to build the model to ensure calculation accuracy and meanwhile reduce the number of units. Fig. 12 shows the simplified meshed FEM mode of the X-2 joint without a branch member. By the material characteristics test, the four-linear model shown in Eq. (21) was used as the constitutive model of steel in the FEM analysis.
where the elastic modulus is E=2.07×10⁵ MPa; the yield strain is εy=0.00165; the initial strain during the strengthening stage is ε1=0.00764 and ε2=0.03; the elastic modulus during the strengthening stage is E′=6463 MPa; and the yield stain is σy=341 MPa. Fig. 13 shows the four-linear constitutive model of steel.
Fig.12 FEM model
Fig.13 Constitutive relation of steel
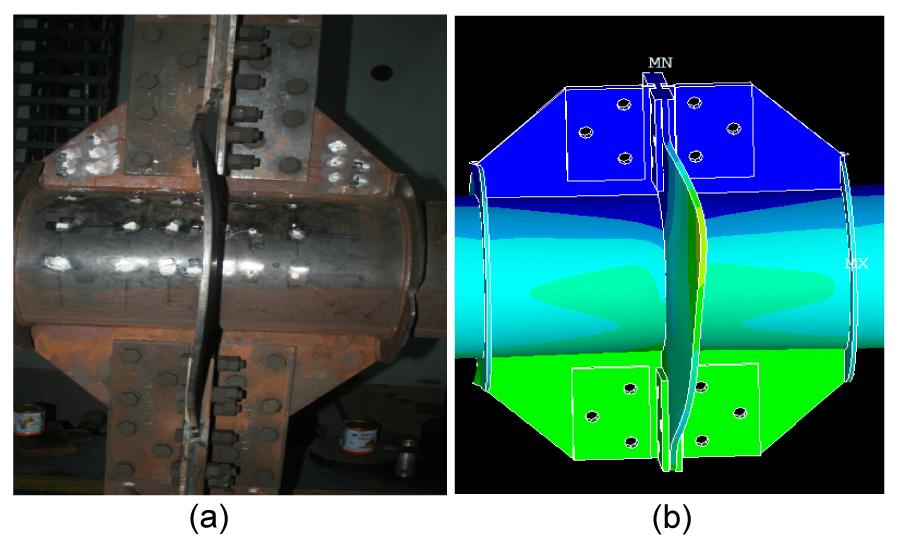
The loading method was the same as the test. The load was distributed to the unit node at the top of branch member by the way of uniformly-distributed node force. The direction of the node force was parallel to the branch member axis. Fig. 14 shows the final failure mode of X-2 joint. At the end stage of loading, the buckling of the annular plate was observed. Moreover, the FEM analytical results show good agreement with the experimental results.
Fig.14 Final failure mode of X-2 joint (a) Experimental result; (b) FEM result
3.6. Validation of the proposed model
To discuss the applicability of the simplified formula, namely on the other types of steel tubular X-joints, some imagined X-joints were calculated using the FEM analysis. The dimensions and the relevant experimental, calculation values of the imagined and experimental X-joints (XG and X) are given in Table 5. For the calculation analysis mainly discussed, the annular plate yield strength and the ideal elasto-plastic model were applied in the material constitutive law in the FEM models of these joints. Moreover, the initial imperfection was not considered, and the gusset plate was changed to the uniform section type.
Table 5
Main dimension and yield strength capacity of AN and AG joints
Joint
Chord member
Branch member
Junction plate
Yield strength
Annular plate
Rib plate
Length, L
Diameter/Thickness, D/T
Diameter/Thickness, d/t
Plate width/Thickness, R/h
Height×Width/Thickness, H×B/b
Experimental
FEM
X-1
2650
630/14
377/14
400/12
530×400/12
1785.1
X-2
2650
630/14
377/14
200/12
530×200/12
893.7
X-3
1680
325/6
219/10
200/10
280×200/10
898.5
X-4
1680
325/6
219/10
100/10
280×100/10
367.0
XG-1
2650
630/14
377/14
250/12
530×250/12
1654.4
XG-2
2650
500/12
377/14
300/12
530×300/12
1608.2
XG-3
2650
500/10
377/10
290/12
530×290/12
1363.0
XG-4
1680
300/6
206/10
170/10
280×170/10
650.6
The comparison of the finite element analysis, experimental result, simplified formula result, and code result for the eight specimens are shown in Table 6, where the reduction coefficient was not considered in the code value. It was observed that the result obtained by the simplified formula can better reflect the actual yield capacity of the specimen.
Table 6
Comparison of the results from the FEM analysis, experiment, simplified formula, and code
Joint
Simplified formula
Code
FEM
Experimental
Considering section development coefficient
Not considering section development coefficient
X-1
2201.4
2127.8
1594.2
2012.6
1785.1
X-2
1354.1
1222.0
727.0
1545.6
893.7
X-3
671.5
646.6
555.8
762.7
898.5
X-4
311.9
300.1
235.6
596.2
367.0
XG-1
1534.0
1481.3
939.0
1654.4
XG-2
1578.0
1525.8
1157.0
1608.2
XG-3
1321.7
1276.4
1035.0
1363.0
XG-4
599.4
538.8
470.1
650.6
4. Conclusions
The yield strength capacity is important in the steel structural design. By comparing the experimental and the FEM analysis, it could be found that the strength capacity calculation formula given by the current code was conservative, and the effect of the joint plate was not considered. However, the joint plate had a great effect on the improvement of the joint strength capacity, neglecting this effect would make the joint yield strength capacity too conservative. Based on the experimental and the FEM analysis, the strength capacity improvement coefficient of the gusset plate was considered in this study, then a simplified calculation model fitting the mechanical performance was proposed, according to which, an empirical formula was deduced. The restraint effect of the part outside the chord member equivalent flange width was considered, and the results obtained from the simplified formula calculation, the FEM analysis, and the experiments all agreed well.
Acknowledgements
The authors appreciate the great assistances of graduate students Zhen CHEN, Shi-jie GUAN, and Wei-qing LI, Zhejiang University in the execution of the experimental tests.
[1] Bao, K.Y., Shen, G.H., Sun, B.N., Ye, Y., Yang, L.X., 2008. Experimental study and theoretical analysis of ultimate strength of steel tubular K-joints of tall towers. Engineering Mechanics, (in Chinese),25(12):114-122.
[2] Choo, Y.S., Liang, J.X., van der Vegte, G.J., Liew, J.Y.R., 2004. Static strength of doubler plate reinforced CHS X-joints loaded by in-plane bending. Journal of Constructional Steel Research, 60(12):1725-1744.
[3] Dexter, E.M., Lee, M.M.K., 1999. Static strength of axially loaded tubular K-joints. I: behavior. Journal of Structural Engineering, 125(2):194-201.
[5] GB50017-2003, . Code for Design of Steel Structures, Ministry of Housing and Urban-rural Development of the Peoples Republic of China,:
[6] Gho, W.M., Yang, Y., 2008. Parametric equation for static strength of tubular circular hollow section joints with complete overlap of braces. Journal of Structural Engineering, 134(3):393-401.
[7] Kim, W.B., 2001. Ultimate strength of tube-gusset plate connections considering eccentricity. Engineering Structures, 23(11):1418-1426.
[8] Lee, M.M.K., Gazzola, F., 2006. Design equation for offshore overlap tubular K-joints under in-plane bending. Journal of Structural Engineering, 132(7):1087-1095.
[9] Liu, J.P., Guo, Y.L., 2001. Analysis of inelastic, large deflection finite element for the tubular joints. Journal of Qinghai University, (in Chinese),19(1):38-42.
[10] Paul, J.C., Makino, Y., Kurobane, Y., 1994. Ultimate resistance of unstiffened multiplanar tubular TT- and KK-joints. Journal of Structural Engineering, 120(10):2853-2870.
[11] Q/GDW391-2009, . Technical Regulation for Conformation Design of Steel Tubular Towers of Transmission Lines, State Grid Corporation of China,:
[12] Soh, C.K., Chan, T.K., Yu, S.K., 2000. Limit analysis of ultimate strength of tubular X-joints. Journal of Structural Engineering, 126(7):790-797.
[13] van der Vegte, G.J., Wardenier, J., Puthli, R.S., 2010. FE analysis for welded hollow-section joints and bolted joints. Proceedings of the ICE-Structures and Buildings, 163(6):427-437.
[14] Yam, M.C.H., Cheng, J.J.R., 2002. Behavior and design of gusset plate connections in compression. Journal of Constructional Steel Research, 58(5-8):1143-1159.
[15] You, J., Li, Z.L., Bai, Q., Zhang, C., 2010. A study of influence of tubular axial force on ultimate strength of steel tubular K-joints. Journal of Chongqing Technology and Business University (Natural Science Edition), (in Chinese),27(3):292-297.
Open peer comments: Debate/Discuss/Question/Opinion


Open peer comments: Debate/Discuss/Question/Opinion
<1>
mahdi@fathi<mah_13772000@yahoo.com>
2014-04-05 13:03:46
gusset plate