Affiliation(s):
1.
School of Civil Engineering, Beijing Jiao Tong University, Beijing 100044, China; moreAffiliation(s): 1.
School of Civil Engineering, Beijing Jiao Tong University, Beijing 100044, China; 2.
Tunnel and Underground Engineering Research Center of Ministry of Education, Beijing Jiao Tong University, Beijing 100044, China; less
Xue-yan Liu, Da-jun Yuan. An in-situ slurry fracturing test for slurry shield tunneling[J]. Journal of Zhejiang University Science A, 2014, 15(7): 465-481.
@article{title="An in-situ slurry fracturing test for slurry shield tunneling", author="Xue-yan Liu, Da-jun Yuan", journal="Journal of Zhejiang University Science A", volume="15", number="7", pages="465-481", year="2014", publisher="Zhejiang University Press & Springer", doi="10.1631/jzus.A1400028" }
%0 Journal Article %T An in-situ slurry fracturing test for slurry shield tunneling %A Xue-yan Liu %A Da-jun Yuan %J Journal of Zhejiang University SCIENCE A %V 15 %N 7 %P 465-481 %@ 1673-565X %D 2014 %I Zhejiang University Press & Springer %DOI 10.1631/jzus.A1400028
TY - JOUR T1 - An in-situ slurry fracturing test for slurry shield tunneling A1 - Xue-yan Liu A1 - Da-jun Yuan J0 - Journal of Zhejiang University Science A VL - 15 IS - 7 SP - 465 EP - 481 %@ 1673-565X Y1 - 2014 PB - Zhejiang University Press & Springer ER - DOI - 10.1631/jzus.A1400028
Abstract: When performing a slurry shield excavation in the shallow earth cover under a waterway, the support pressure is difficult to calibrate. If not carefully monitored, slurry fracturing or even slurry breakout can occur; water from the river can rush into the slurry circulating system, threatening the security of the project. In this study, an in-situ slurry fracturing apparatus was created to analyze the phenomena of slurry fracturing and fracture propagation. First, the fracturing test procedures and the method of identifying slurry fracturing are introduced. Then, mechanical models of the slurry fracturing and fracture propagation are described and validated with in-situ tests. The models provide fairly good predictions: the driving pressure is related to the properties of both the soil and slurry. Slurry with large parameters for bulk density and viscosity is beneficial for preventing slurry fracturing propagation. However, such parameters have little influence and can be neglected when determining the initial fracturing pressure. Preventing slurry fracturing and breakout is important for not only shield tunnel preparation, but also shield tunneling under dangerous conditions. A crucial factor is setting and limiting the maximum support pressure values. These pressures can be obtained through the in-situ tests and mechanical models described here. These results provide useful references for the Weisan Road Tunnel to be built under the Yangtze River in Nanjing, China.
Darkslateblue:Affiliate; Royal Blue:Author; Turquoise:Article
Article Content
1. Introduction
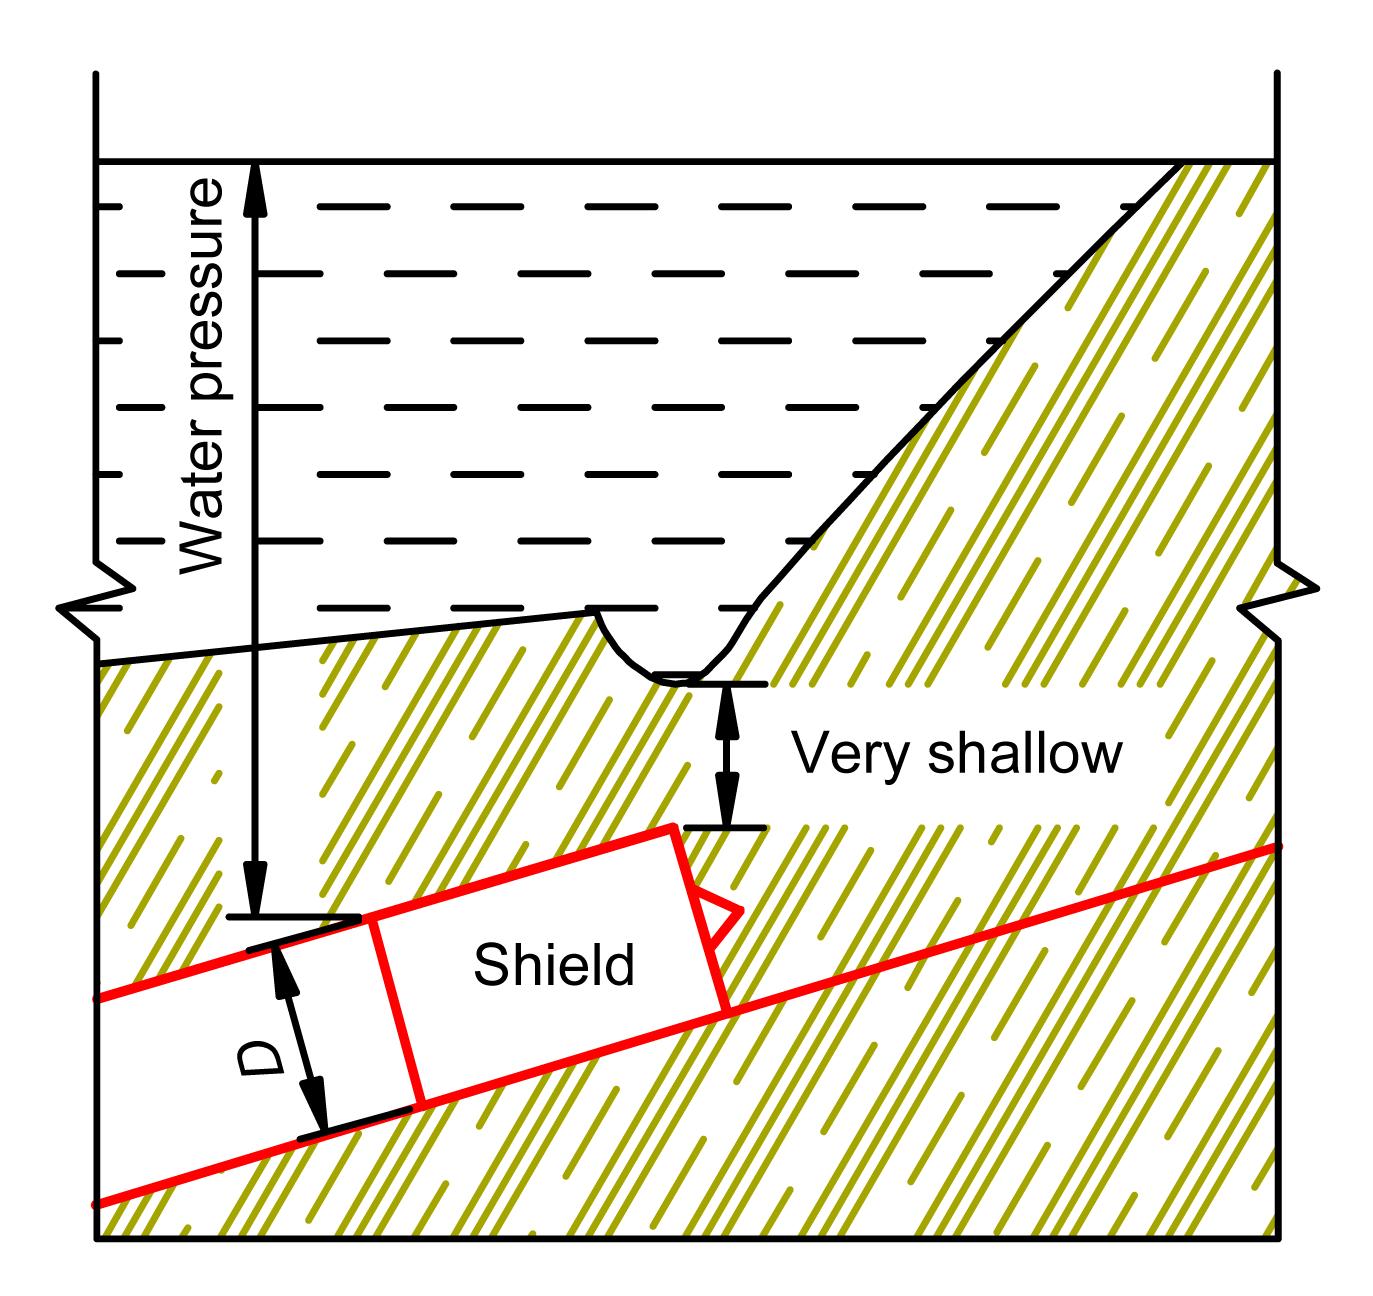
With the growth of urban traffic in China, increasingly tunnels are being constructed under rivers and seas. A shield construction process offers a technically and economically feasible method of tunneling in unfavorable geological conditions, such as in soft soils or aquifers (Maidl et al., 2012), and slurry shields are the preferred choice for constructing tunnels under waterways. The longitudinal profiles of tunnels passing under seas or rivers are mostly V- or U-shaped. For the condition shown in Fig. 1, a higher support pressure will be necessary to maintain the stability of the face on the steep bank of the river. However, the very shallow strata can easily be fractured by the slurry, which may erupt out of the riverbed. After a breakout, the slurry can run off and lead to a sharp decrease in support pressure and the collapse of the face (Bezuijen and Brassinga, 2006). River water would then rush into the slurry circulating system, threatening the security of the project.
Fig.1 A dangerous condition for shield tunneling of the Nanjing Yangtze River Tunnel, China
Slurry fracturing can be divided into three stages of development: occurrence, propagation, and breakout. A simple method for preventing slurry fracturing is through reinforcing strata, a method used in the Fourth Elbe Tunnel Tube (Falk, 1998). However, the reinforcing strata method is expensive and cannot be applied at the moment of slurry fracturing. When slurry breakout occurs, coarser material and swelling clay, such as fine sand and bentonite, can be added to the chamber to clog the fracture. However, this task is time-consuming and impractical for preventing slurry breakout. The best method for minimizing the loss is faster tunneling, which also induces construction risks because the support pressure cannot be maintained nor the construction quality guaranteed. Therefore, slurry fracturing and breakout have been unresolved construction concerns for a long time and endanger the proposed Weisan Road Tunnel currently being built under the Yangtze River in Nanjing, China. Thus, analyzing slurry fracturing and propagation and proposing factors and parameters to prevent their occurrence during tunneling is a practical matter.
Carter et al. (1986) analyzed cavity expansion in an ideal cohesive frictional material with small deformation. The limit pressure PL in a purely cohesive, constant-volume material for the cylindrical cavity equation may be derived as follows:
,
where Pin is the internal pressure, G is the elastic shear modulus, and c is the cohesion.
Bezuijen et al. (2007) and Gafar et al. (2008) studied compensation grouting in sands through a series of laboratory tests and described the first deformation of the compensation grouting opening with the cavity expansion theory. Mori and Tamura (1987) and Mori et al. (1990) investigated the relationship between the hydraulic fracturing pressure (Pf) and the strength of cohesive soils through fracture tests on six types of cohesive soils using water and viscous materials, obtaining the following result in terms of total stress:
,
where σ3 is the minimum principal stress, qu is the unconfined compression strength, α is the coefficient connected with viscosity, and α=2.8−1/(0.1F−0.3). F=8−10 for pure water and is larger for viscous materials.
Yanagisawa and Panah (1994) obtained equations for hydraulic fracturing based on the shear failure mechanism in an unconsolidated undrained condition (UU condition). In the condition of σ2=σ3, if the hole is made in the direction of σ1, the equation for the total stress method can be written as
,
where φu is the friction angle, cu is the cohesion, and cu and φu can be obtained through a triaxial test in a UU condition.
Murdoch (1992; 1993a; 1993b) investigated the hydraulic fracturing of soil from methods, observations, propagations, and theories during laboratory experiments. These results offer good reference points for the analysis of slurry fracturing. However, the samples in laboratory tests are typically destroyed at the time of fracturing because of their small size. The fracture propagation, which is a key factor for slurry breakout analysis, cannot be observed. The mechanical properties of slurry are different from those of water or mortar. Thus, in-situ tests are warranted.
This paper introduces a field slurry fracturing apparatus that obtains the maximum value of support pressures through field slurry fracturing tests. Emphasis is placed on the procedures of slurry fracturing tests and the analysis of test results. Models for initial fracturing pressure and fracture propagation are described, along with a formula for calculating the upper limit of support pressure to prevent slurry fracturing. These results provide very useful references for shield tunneling in the complex geological and hydrological conditions under the Yangtze River in Nanjing.
2. Site conditions and test program
2.1. Site description
The Weisan Road Tunnel, the second tunnel under the Yangtze River in Nanjing, will consist of two tubes. Each tube will have an interior diameter of 13.3 m and be lined with precast concrete segments to a 14.5 m exterior diameter. The tubes will be excavated by a slurry shield with a diameter of 14.93 m. The length of shield excavation will be 3.5 km for the north tube, and 4.1 km for the south tube. The tubes will be located between layers of rock and soft soils, such as clay and silt sand. The depth of earth cover is equivalent to about one diameter of the tube. The maximum water pressure anticipated is 0.77 MPa.
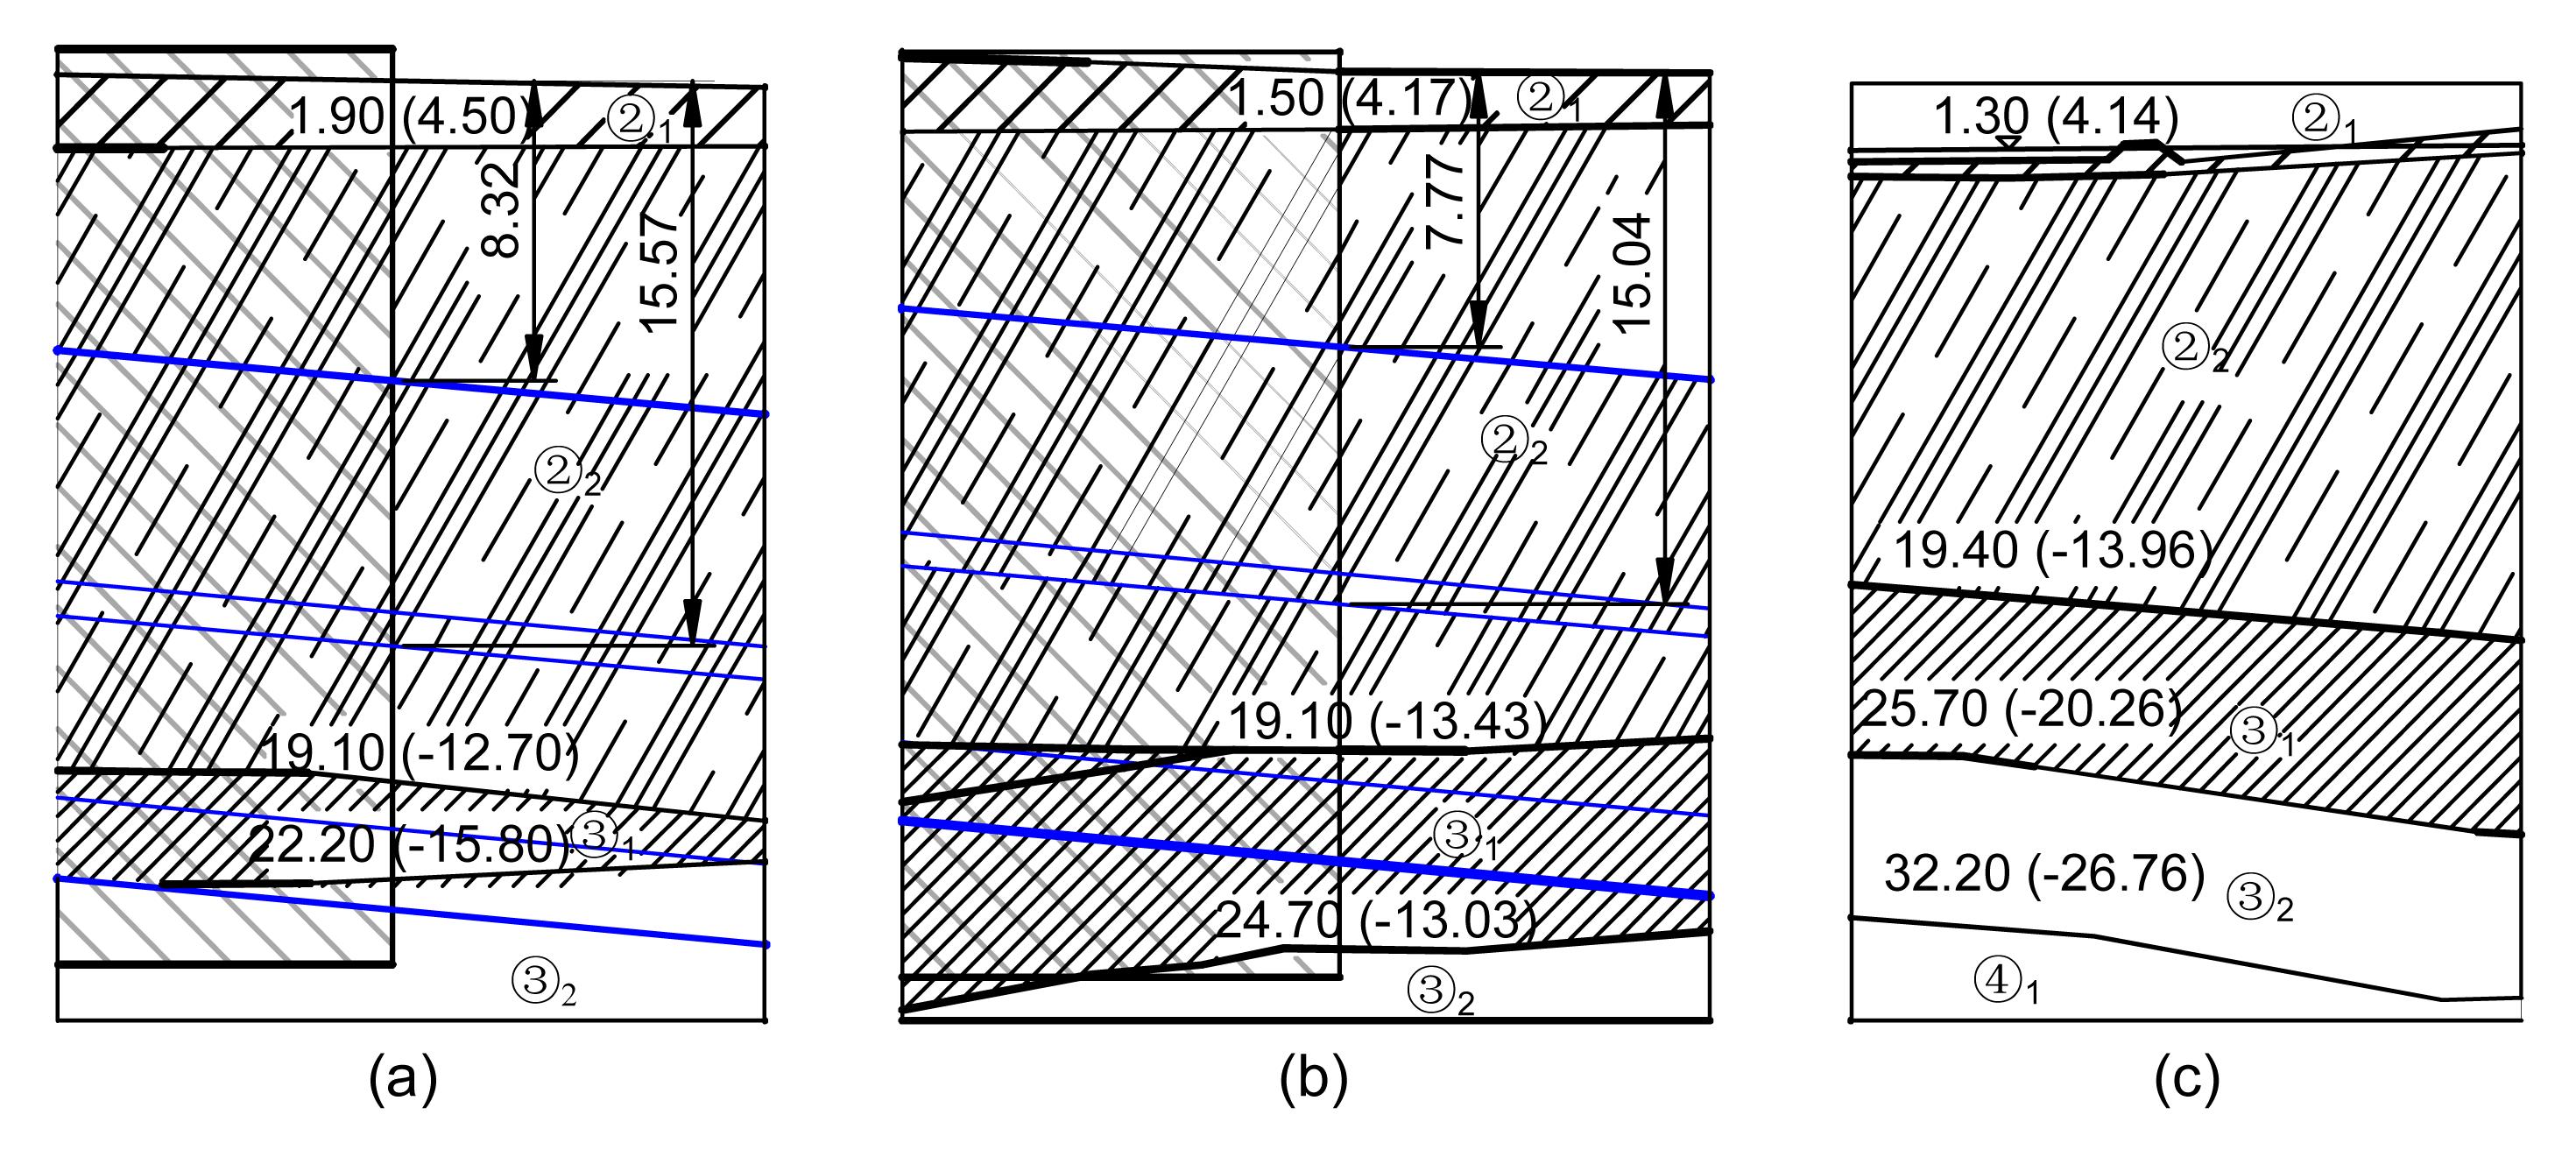
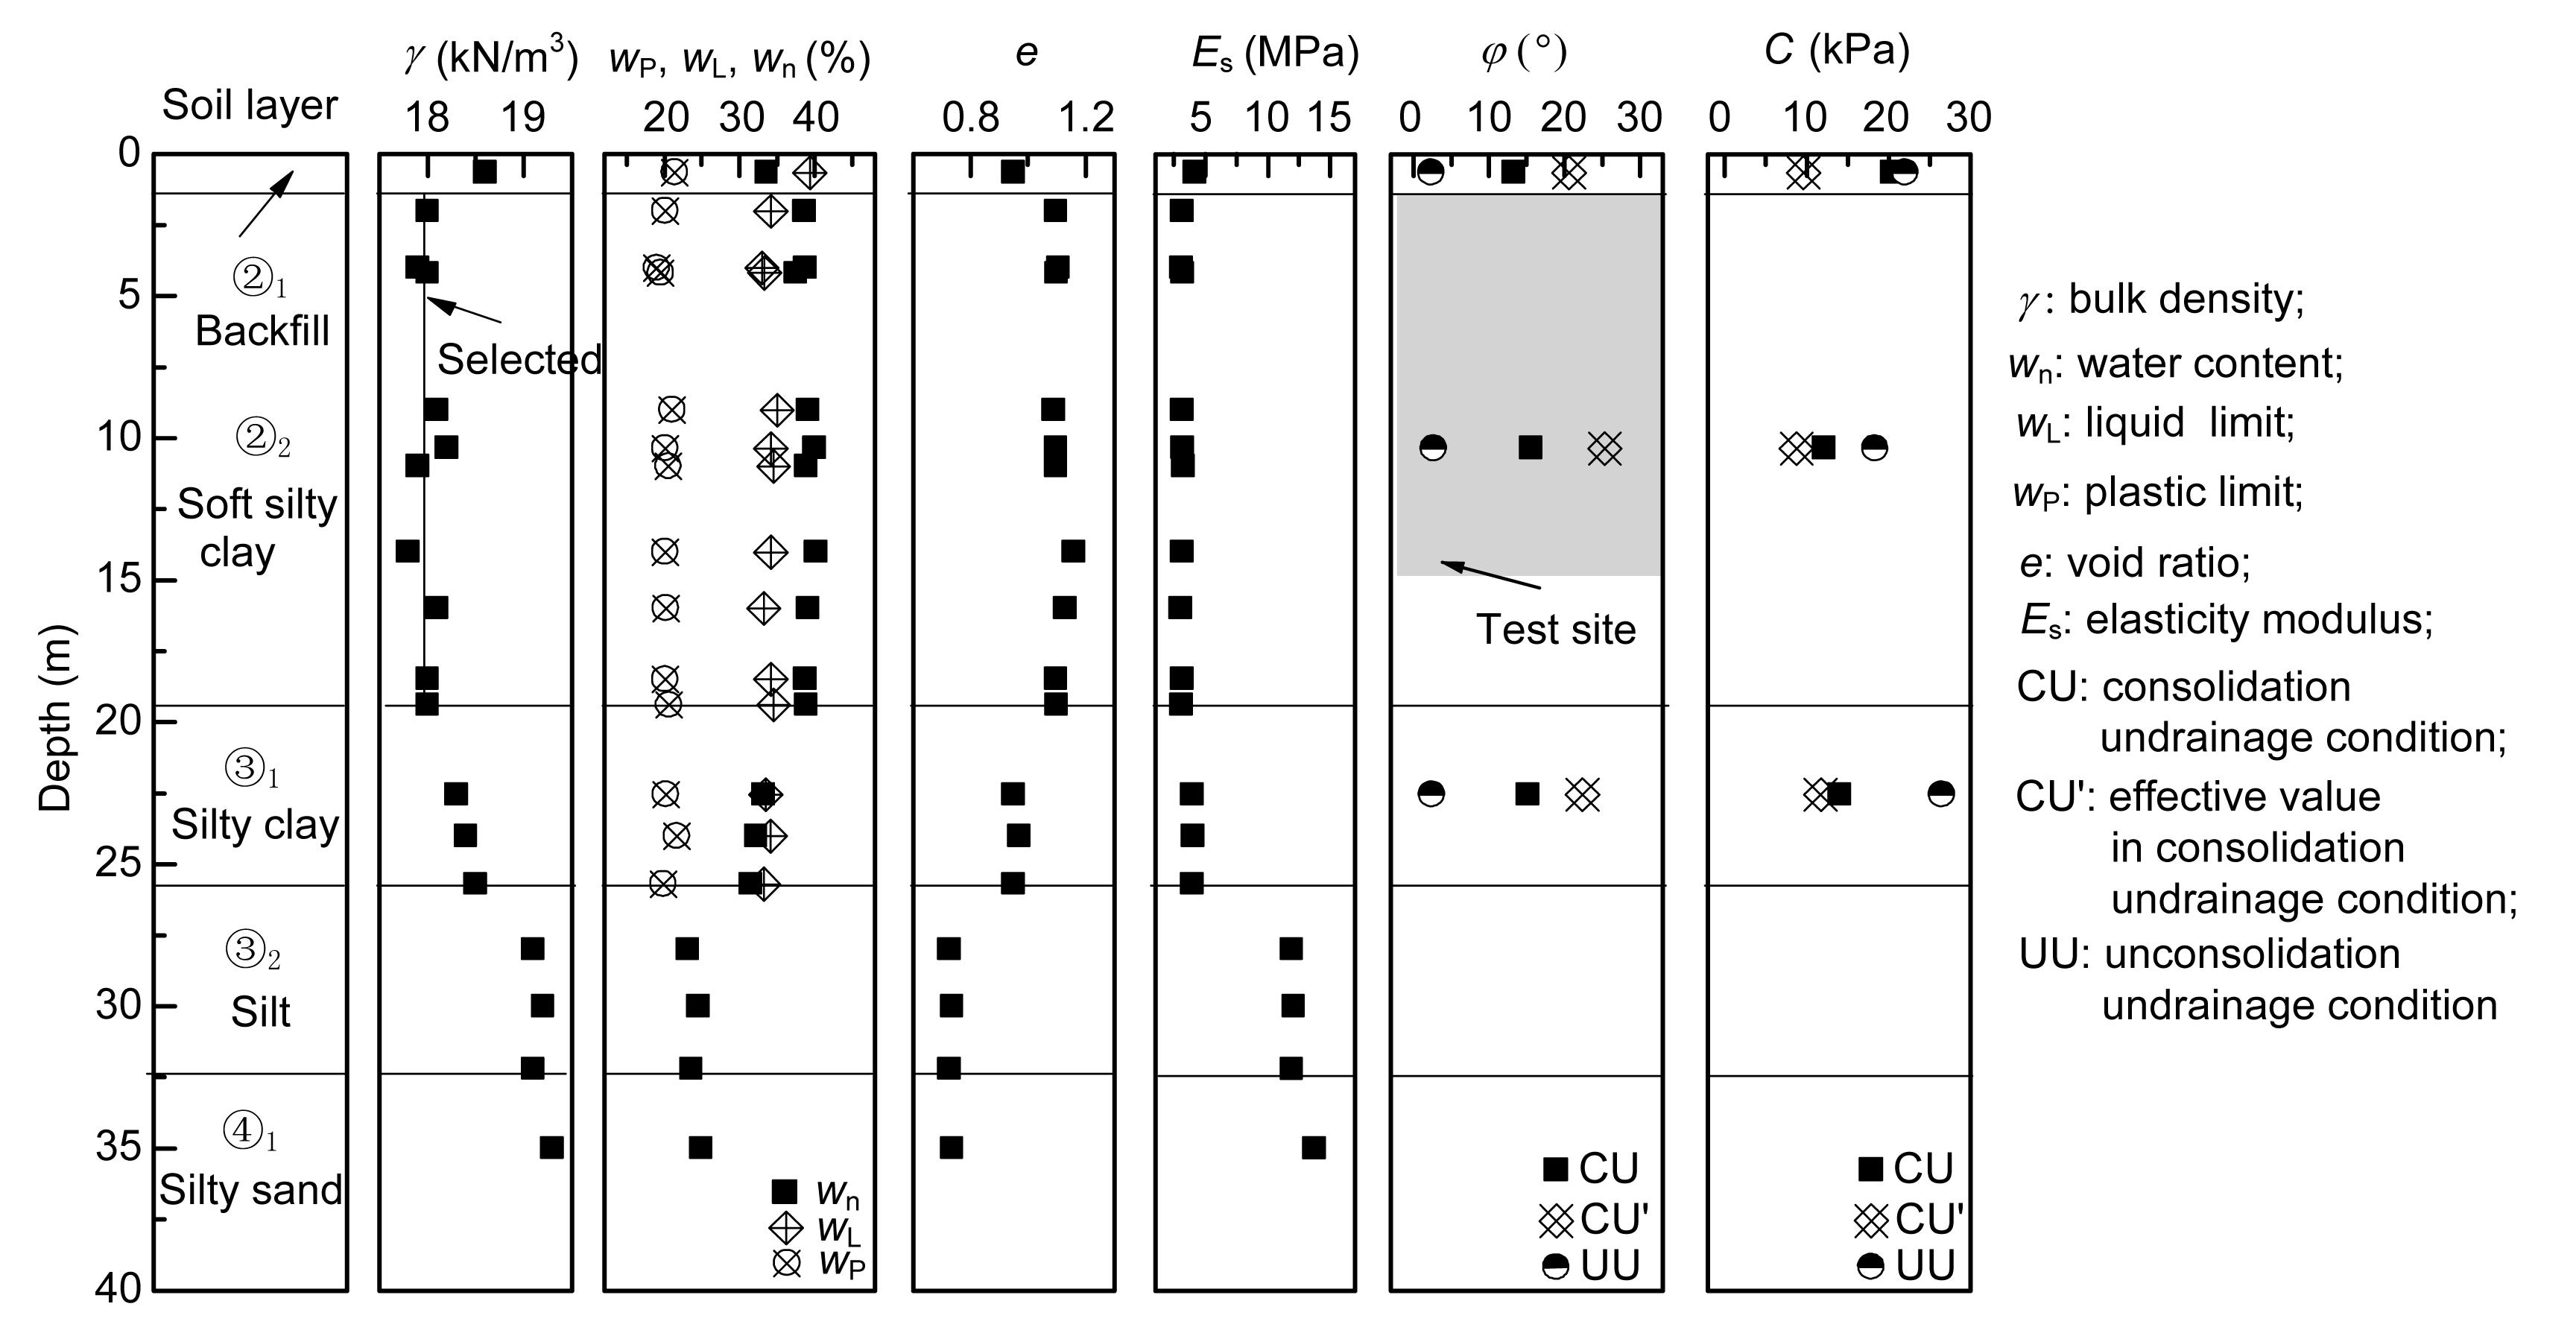
Tests were performed near the tunnel. The fields for both the tunnel and tests are soft Holocene layers composed of sand, clay, and silt clay (Fig. 2). The soils within 19.0 m of the ground surface are ②1 clay and ②2 soft silty clay in the fields for both the tunnel and tests. The physical and mechanical parameters of the layers are shown in Fig. 3. In-situ slurry fracturing tests were performed at different depths with different types of slurry. Six holes were arranged in two rows, marked A and B. Different slurries and depths of 5, 10, and 15 m were set for each row. Table 1 lists the properties of the slurries. Slurry viscosity is typically measured by a Marsh funnel test (Boyce et al., 2011). Water, for example, will empty in about 24 s. However, the volume of the Marsh funnel used in China is slightly smaller, and water will empty in about 15 s.
Fig.2 Soil properties of the strata for the tunnel and the in-situ tests (unit: m) (a) South tube; (b) North tube; (c) In-situ test field
Fig.3 Geotechnical profiles of the test site
Table 1
Properties of slurry chosen for the in-situ tests
Row
Slurry proportion
Slurry properties
Bulk density (kN/m3)
Viscosity (s)
A
Bentonite:CMC:water=8:0.075:91.925
10.2
20
B
Clay:bentonite:CMC:water=20:8:0.075:71.925
11.4
35
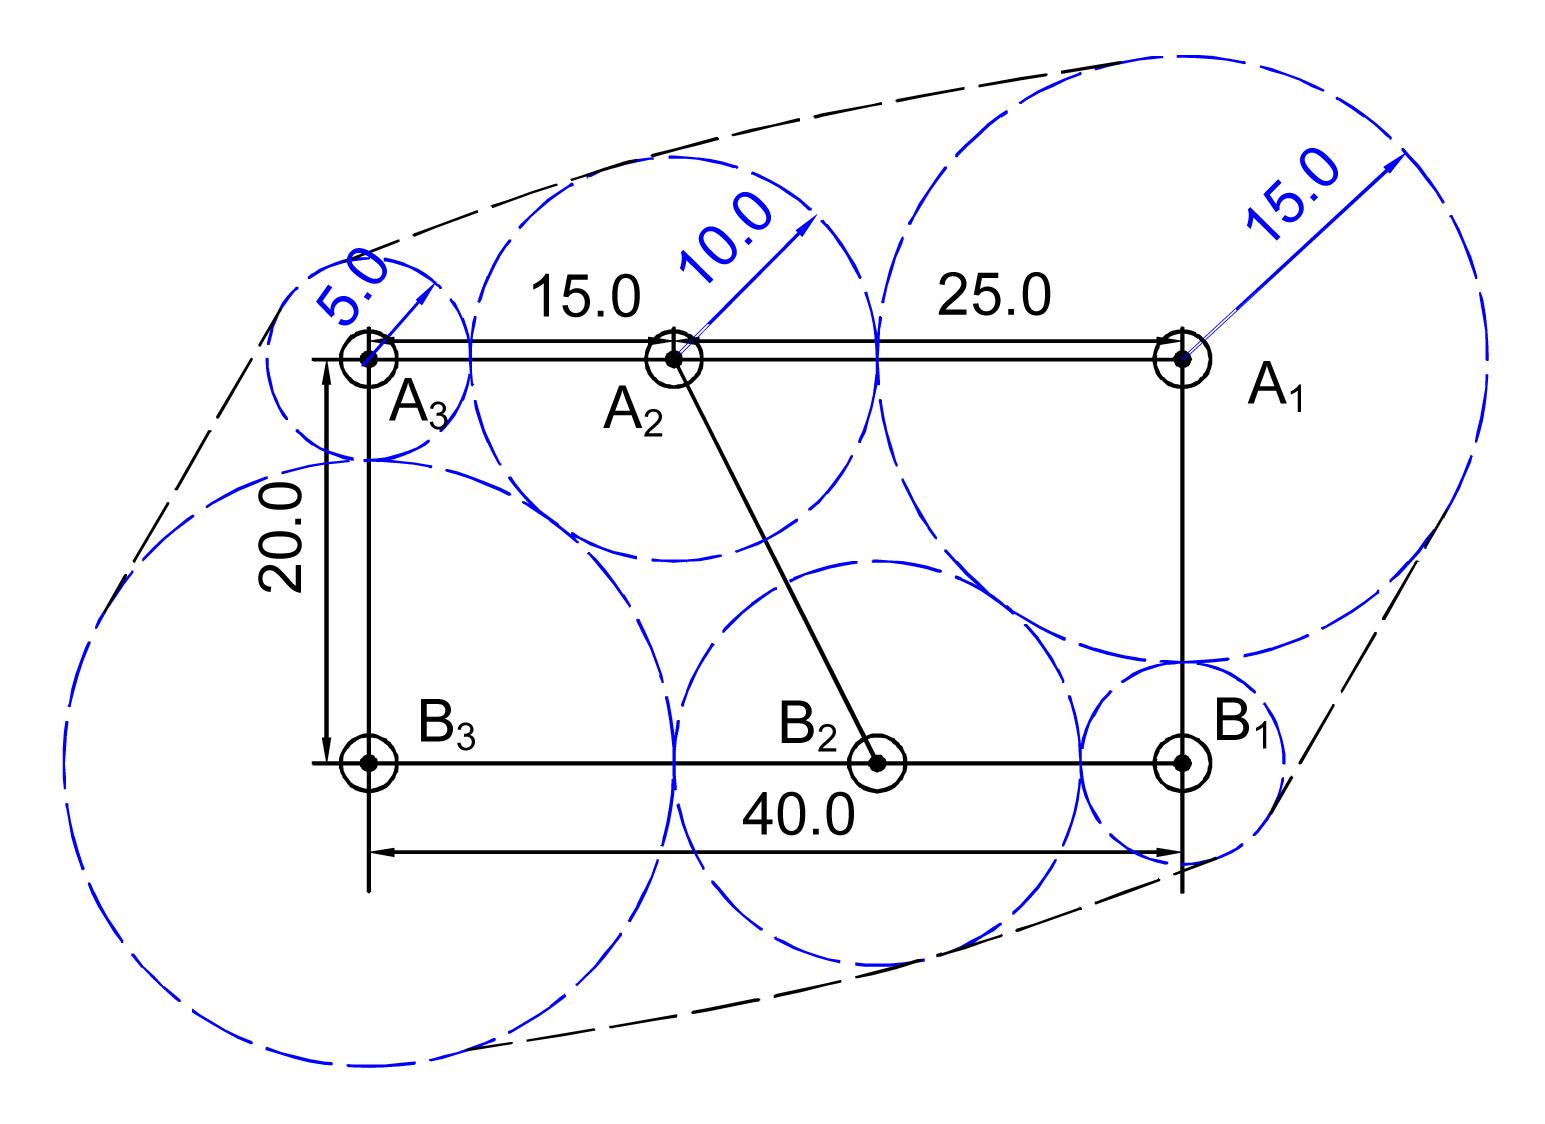
The pre-existent slot has no significant effect on the test results and can be ignored (Panah and Yanagisawa, 1989). Fracture propagation tends to the direction normal to the minimum principal stress, following the path of least resistance (Suthersan, 1996; Alfaro and Wong, 2001). Therefore, the propagation orientation would point to the 45° angle to the vertical direction if the lateral stress of the layers is equal to the vertical stress. However, the test value of the lateral earth pressure coefficient is about 0.6, which is less than 1.0. Thus, the fracture propagates more in the vertical direction. By assuming that the influence radius of each hole is equal to its depth, any possible cross-influence between test holes is avoided (Fig. 4).
Fig.4 Relative positions and influence scopes of the test points (unit: m)
2.2. Slurry fracturing apparatus
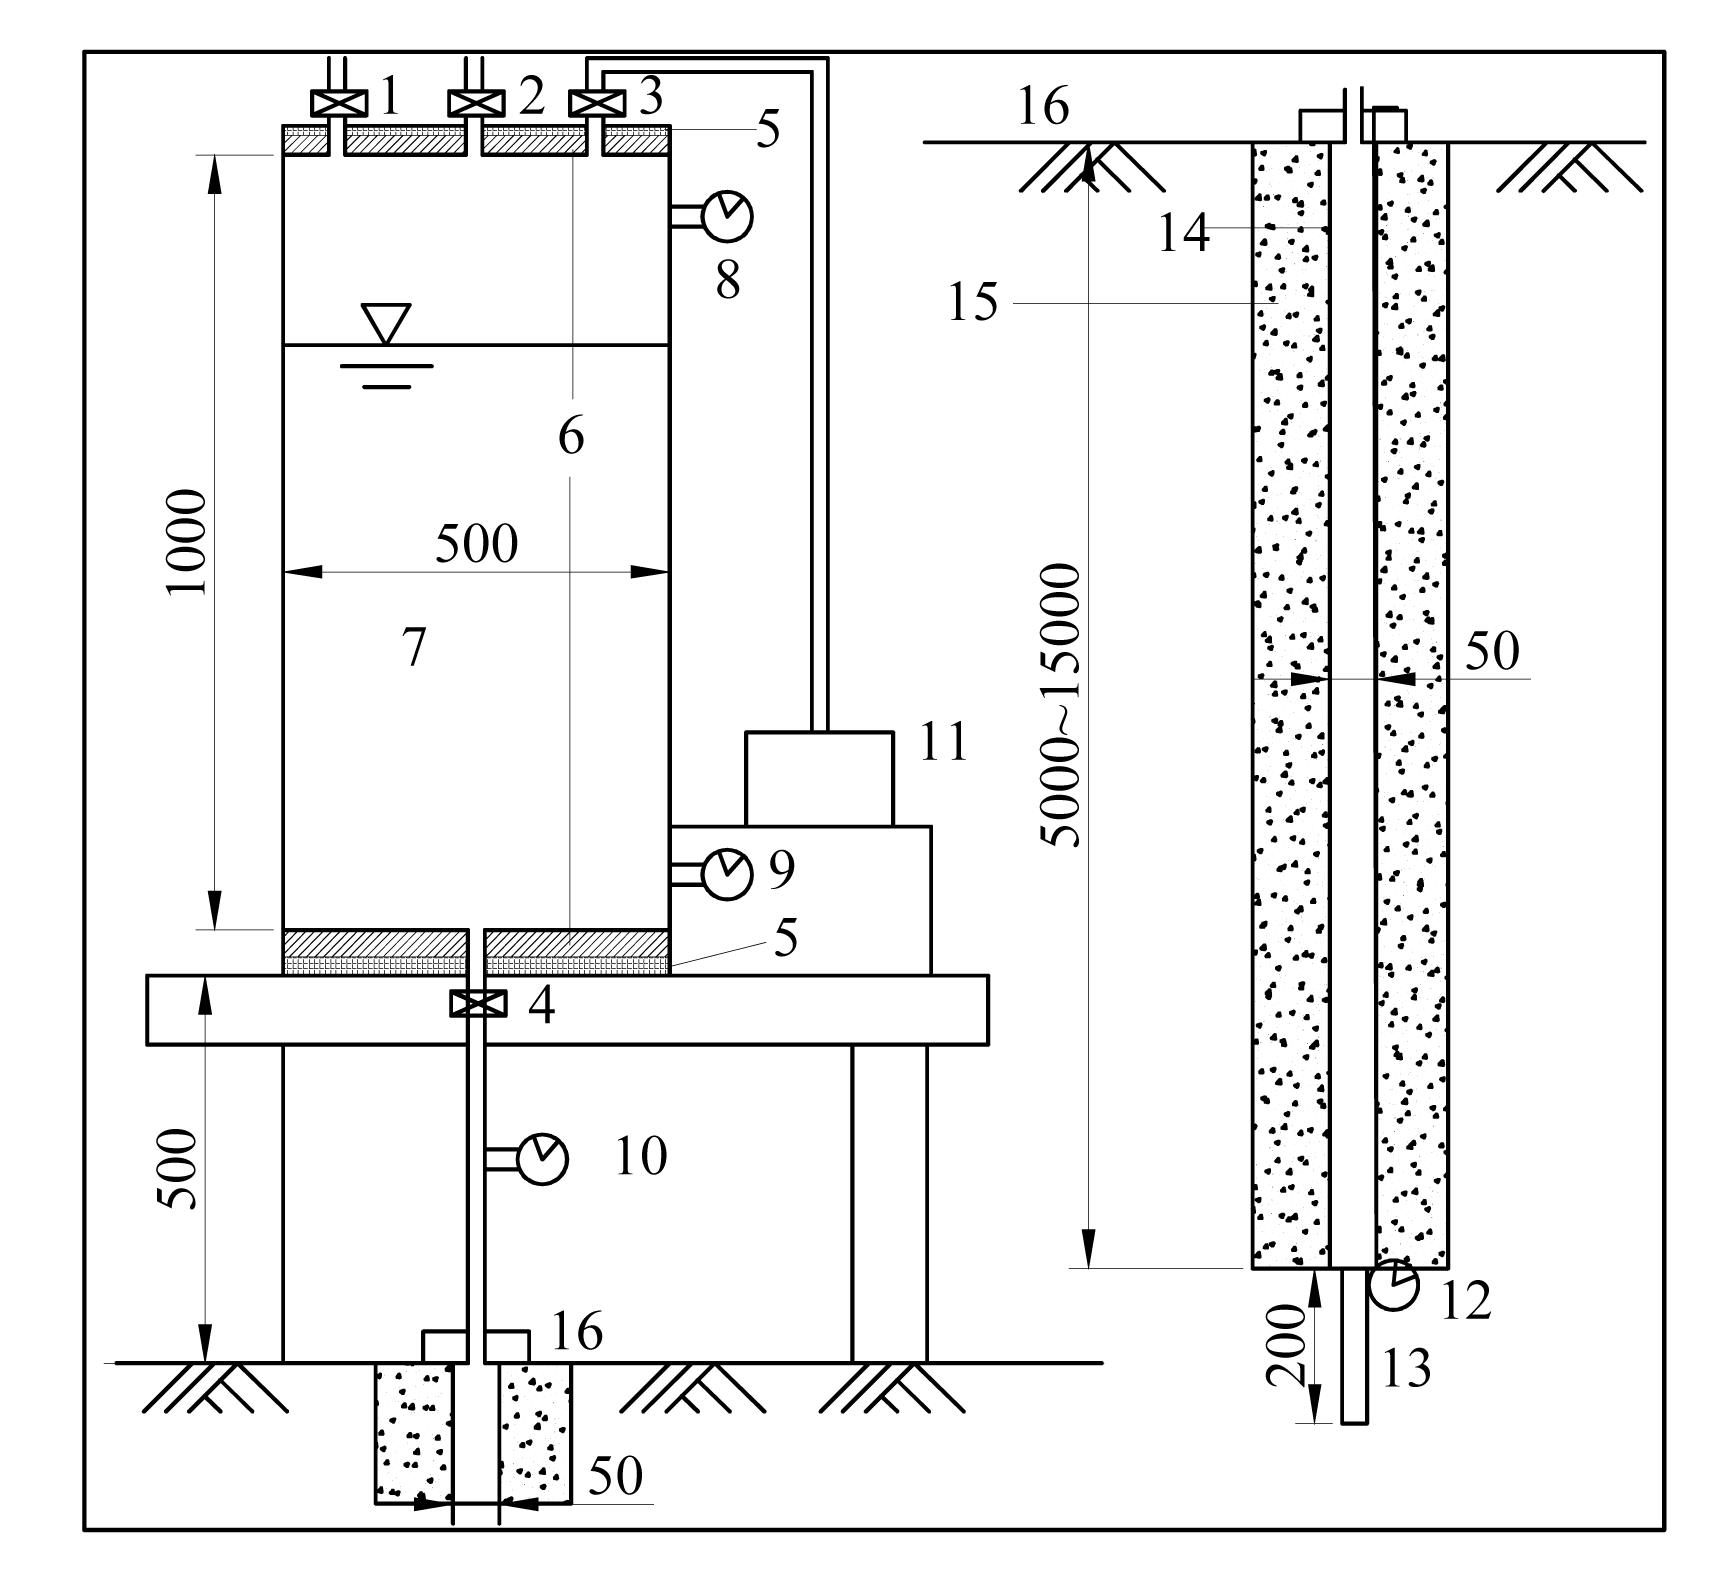
The in-situ slurry fracturing apparatus was composed of a slurry container, an air compressor, measuring equipment, a mobile device, and an underground hole-making device (Fig. 5). The slurry container was employed to hold the slurry. The sidewalls of the slurry container were made of polymethyl methacrylate (PMMA), with scale bars to enable the liquid level to be observed. The accuracy of the scale was 1 mm. The structural and combined panels were used to ensure that the slurry container was effectively sealed. The air compressor was used to apply air pressure. The pressure was transferred to the soil hole through the slurry in the container and a steel pipe. The length of the soil hole was about 200 mm. Cement mortar was placed around the steel pipe to prevent slurry from flowing out along the pipe. Measuring equipment was installed to measure the air pressure, pore water pressure, and flow rate. To measure miniscule flows, a flowmeter was customized to an accuracy of 0.001 m3/h. A mobile device was used to move the apparatus. An underground hole-making device containing a steel pipe and cement mortar was used to create a hole in the stratum to send slurry into the fracturing zone.
Fig.5 General layout of the in-situ slurry fracturing apparatus (unit: mm) 1: exhaust value; 2: slurry addition tube; 3: air addition tube; 4: value; 5: structural panel; 6: combined panel; 7: slurry container; 8: air manometer; 9: pore water; 10: flowmeter; 11: air compressor; 12: pore water; 13: soil hole; 14: steel pipe; 15: cement mortar; 16: ground surface
2.3. Procedures of the in-situ tests
Mori and Tamura (1987) and Mori et al. (1990) suggested that the fracturing pressure is close to the minimum principal stress σ3. Lateral earth pressure is considered the minimum principal stress in shallow strata. Therefore, the lateral earth pressure of the stratum should be carefully investigated as a starting point.
The in-situ slurry fracturing test comprised the lateral earth pressure investigation, hole drilling, steel pipe placement, cement mortar plugging, hole flushing, slurry preparation, a fracturing test, and excavation for verification. The testing procedure was divided into the following stages:
Lateral earth pressure investigation. The lateral earth pressure of the stratum for the in-situ slurry fracturing test was investigated through flat dilatometer tests.
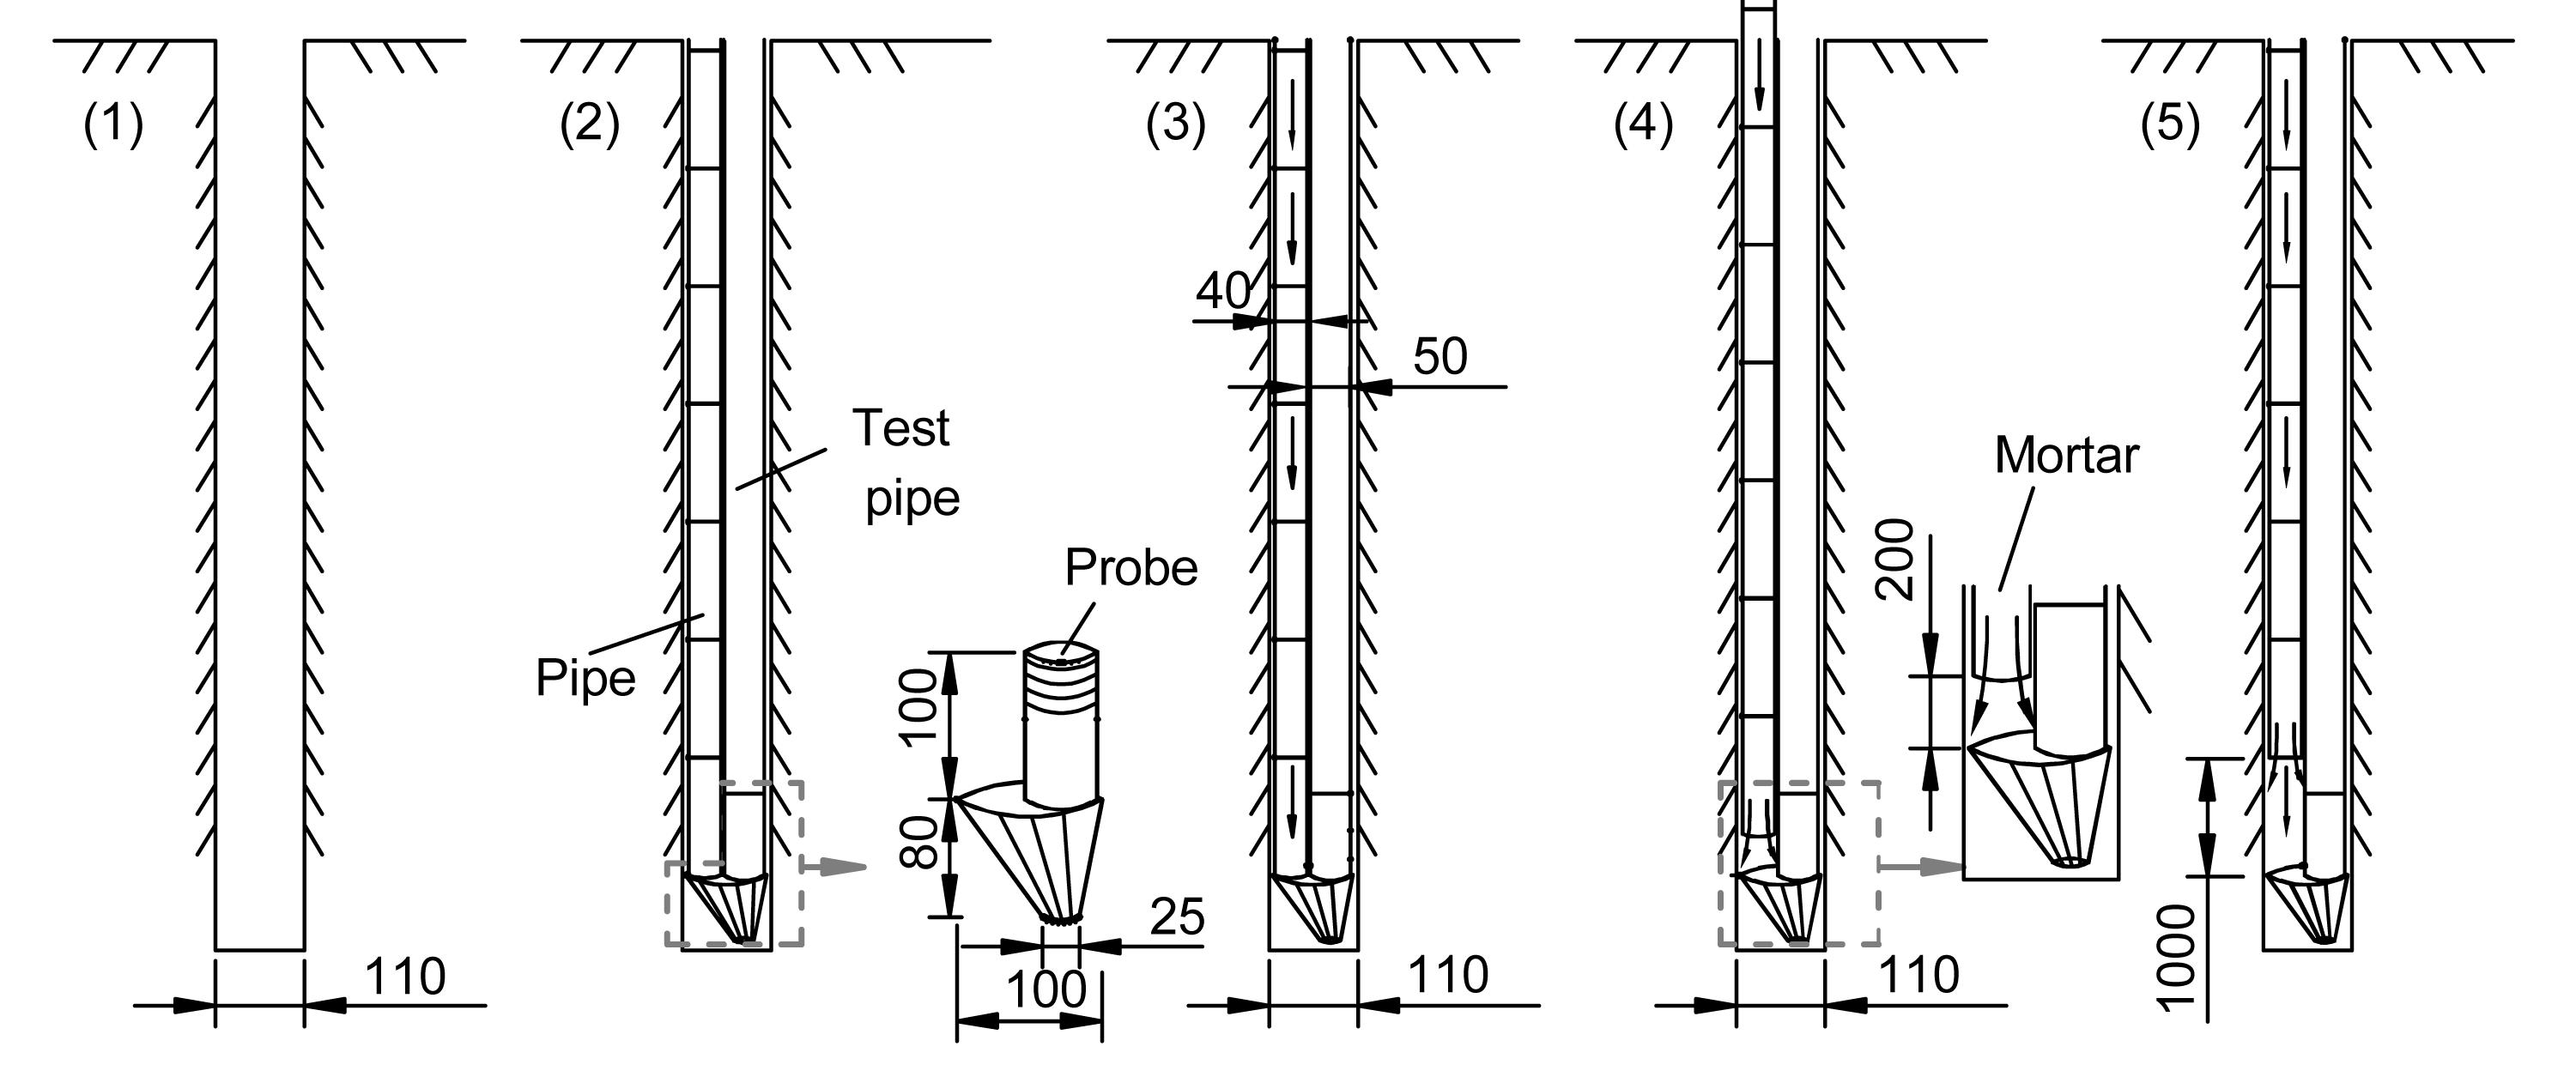
Pipe placement. The test pipe was placed following the steps shown in Fig. 6, as follows: (1) Hole drilling. A test hole with a diameter of 108 mm was drilled by a geological prospecting machine. (2) Pipe placement. A test pipe with a diameter of 50 mm was placed into the hole, along with a pipe with a diameter of 40 mm. A probe was installed on the test pipe to make it move down easily while preventing mortar blocking the test pipe. (3) Mortar pouring. Cement mortar was poured into the 40-mm diameter pipe until it was full. (4) Pipe uplift. The 40 mm pipe was pulled up every 0.2 m along with the cement supplement. (5) Pipe removal. One pipe segment of 1.0 m was removed when the pipe uplift exceeded 1.0 m. (6) Steps (4) and (5) were repeated until the 40 mm pipe was removed entirely and the gap was filled completely with mortar.
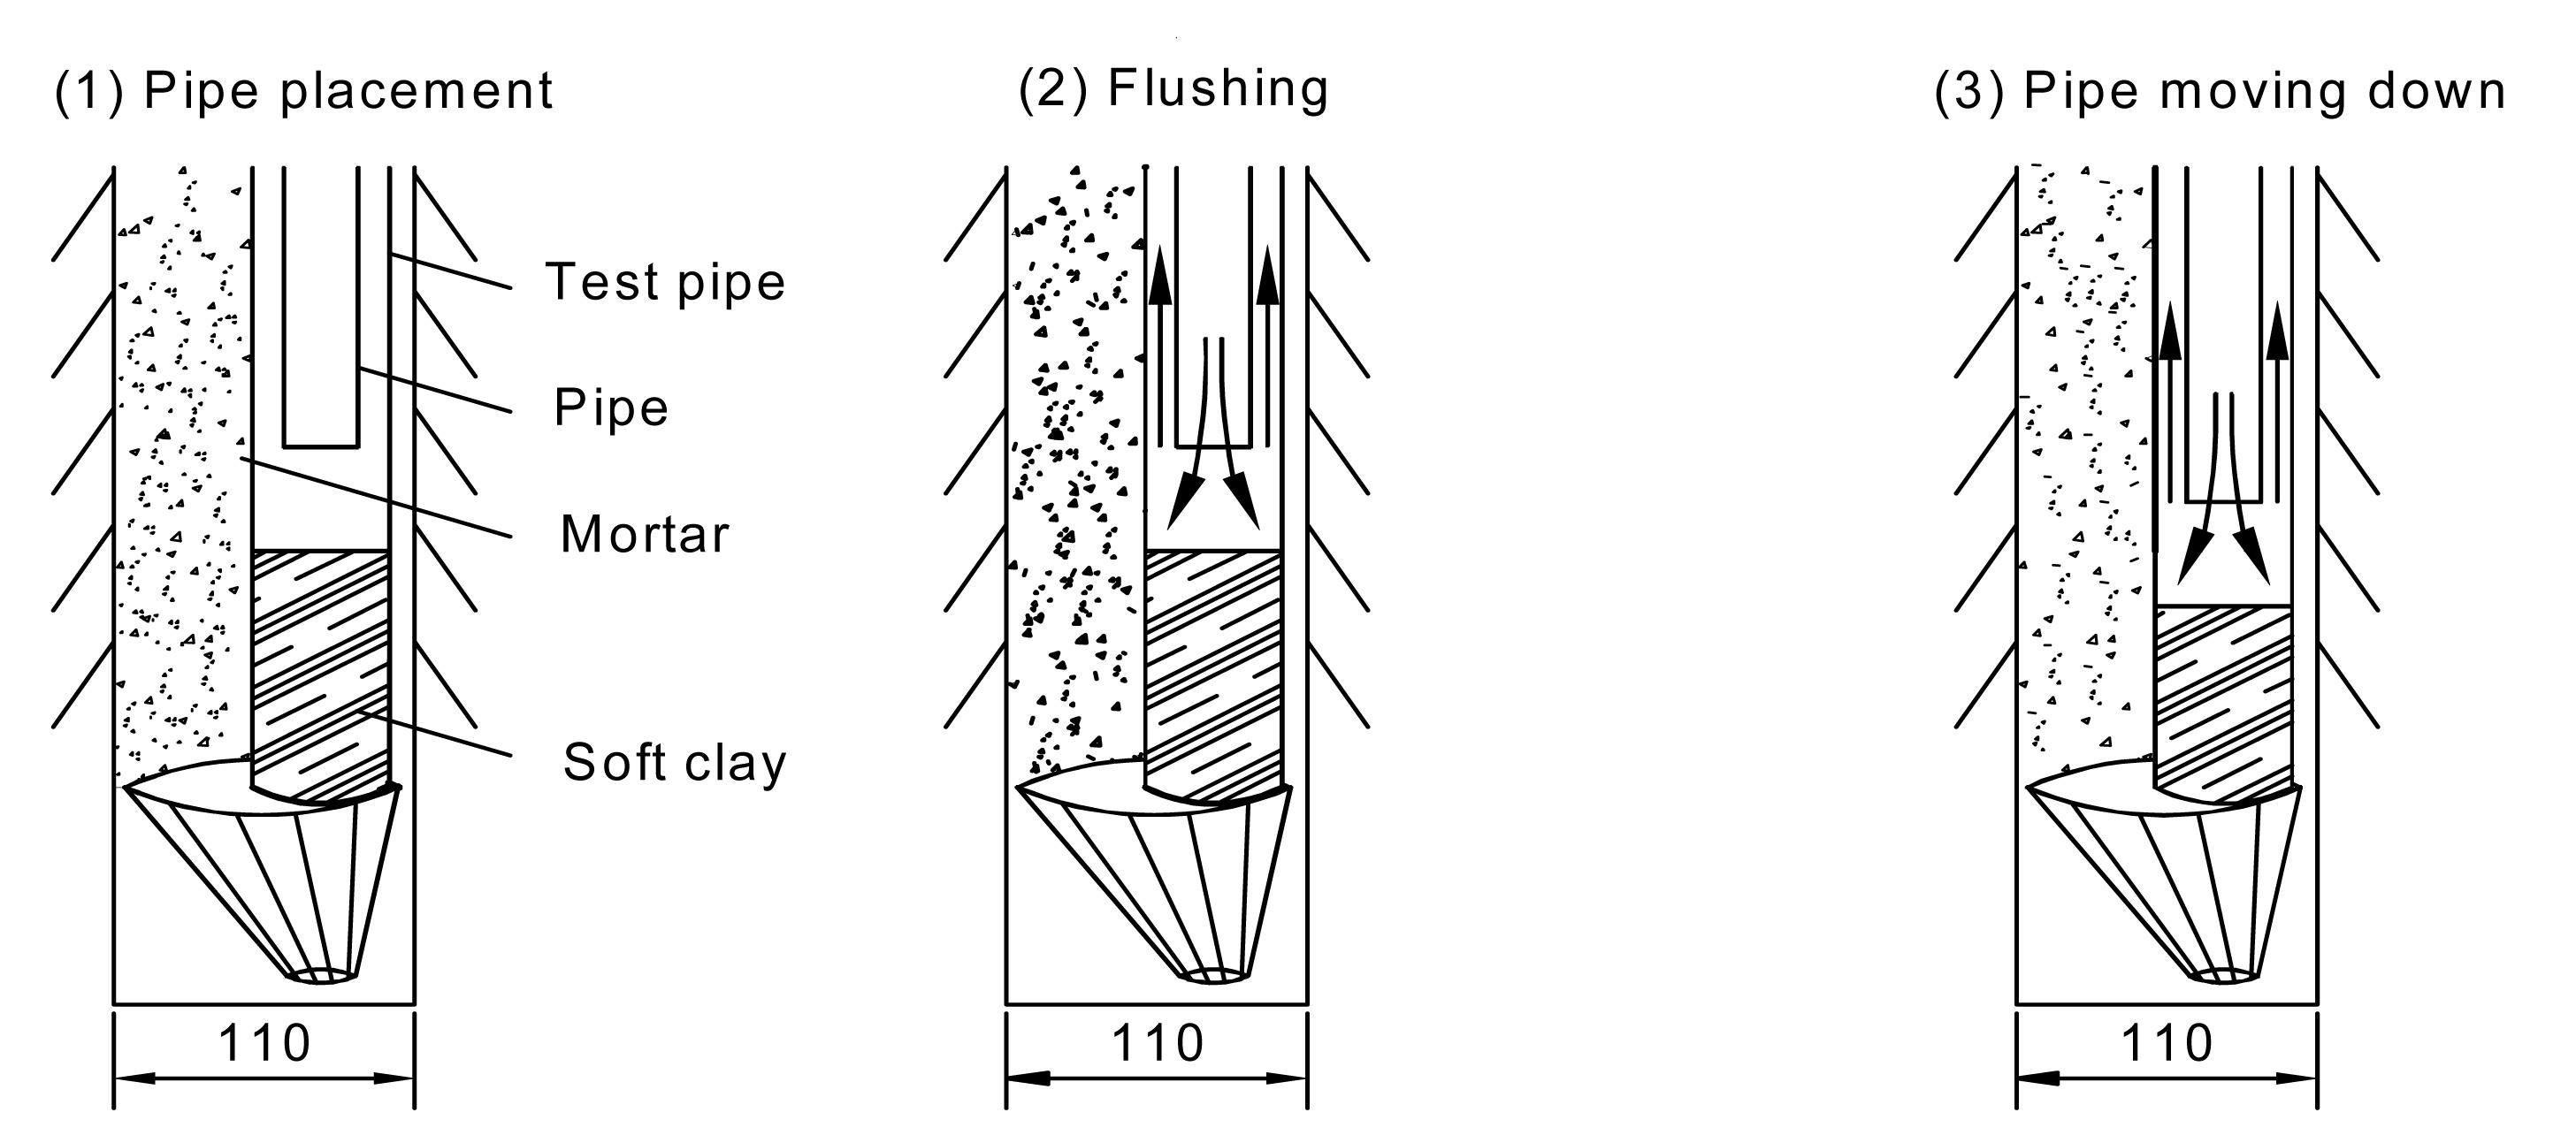
Pipe flushing and slurry preparation. The test pipe was flushed following the steps shown in Fig. 7, as follows: (1) Pipe placement. The pipe with a 40-mm diameter was installed in the interior of the test pipe with a diameter of 50 mm. (2) Flushing. Water was pumped into the 40-mm diameter pipe to flush the soft clay, which blocked the test pipe. Mud and then clear water sprung up from the gap between the pipes. (3) Pipe downward movement. The 40-mm diameter pipe was moved down to flush the deeper clay. (4) Steps (2) and (3) were repeated until the test pipe was reached and clear water emerged. (5) Slurry, prepared at the same time, was pumped into the 40-mm diameter pipe while it was pulled up to exchange the water.
Slurry fracturing. Slurry was pumped into the slurry container, and the air compressor began to increase the air pressure to fracture the stratum. The air pressure was increased by 2 kPa every 2 min (a static process). The hard surface of the stratum was excavated; with the layer of ②1 clay mostly removed, the layer of ②2 soft silty clay was the only layer preventing slurry fracturing. The additional air pressure, the pore water pressure at the bottom of the steel pipe, and the slurry level were measured by a barometer, pore water pressure sensor, and the scale bar, respectively. The flow rate was measured by a flowmeter. Cameras were installed to record the changes in pressure, flow rate, and slurry level and to observe any slurry fracturing breakout phenomena.
Uncovering the path of fracture. The fracturing path was uncovered after the slurry fracturing by manual excavation. The fracture width and horizontal distances between the ends of the fracture and the steel pipe were measured at successive depths of 0.3 m. Apertures of the fracture were measured at the same time.
Fig.6 The steps for test pipe placement (unit: mm)
Fig.7 The steps for test pipe flushing (unit: mm)
3. Results of the in-situ tests
3.1. Breakout and fracturing path
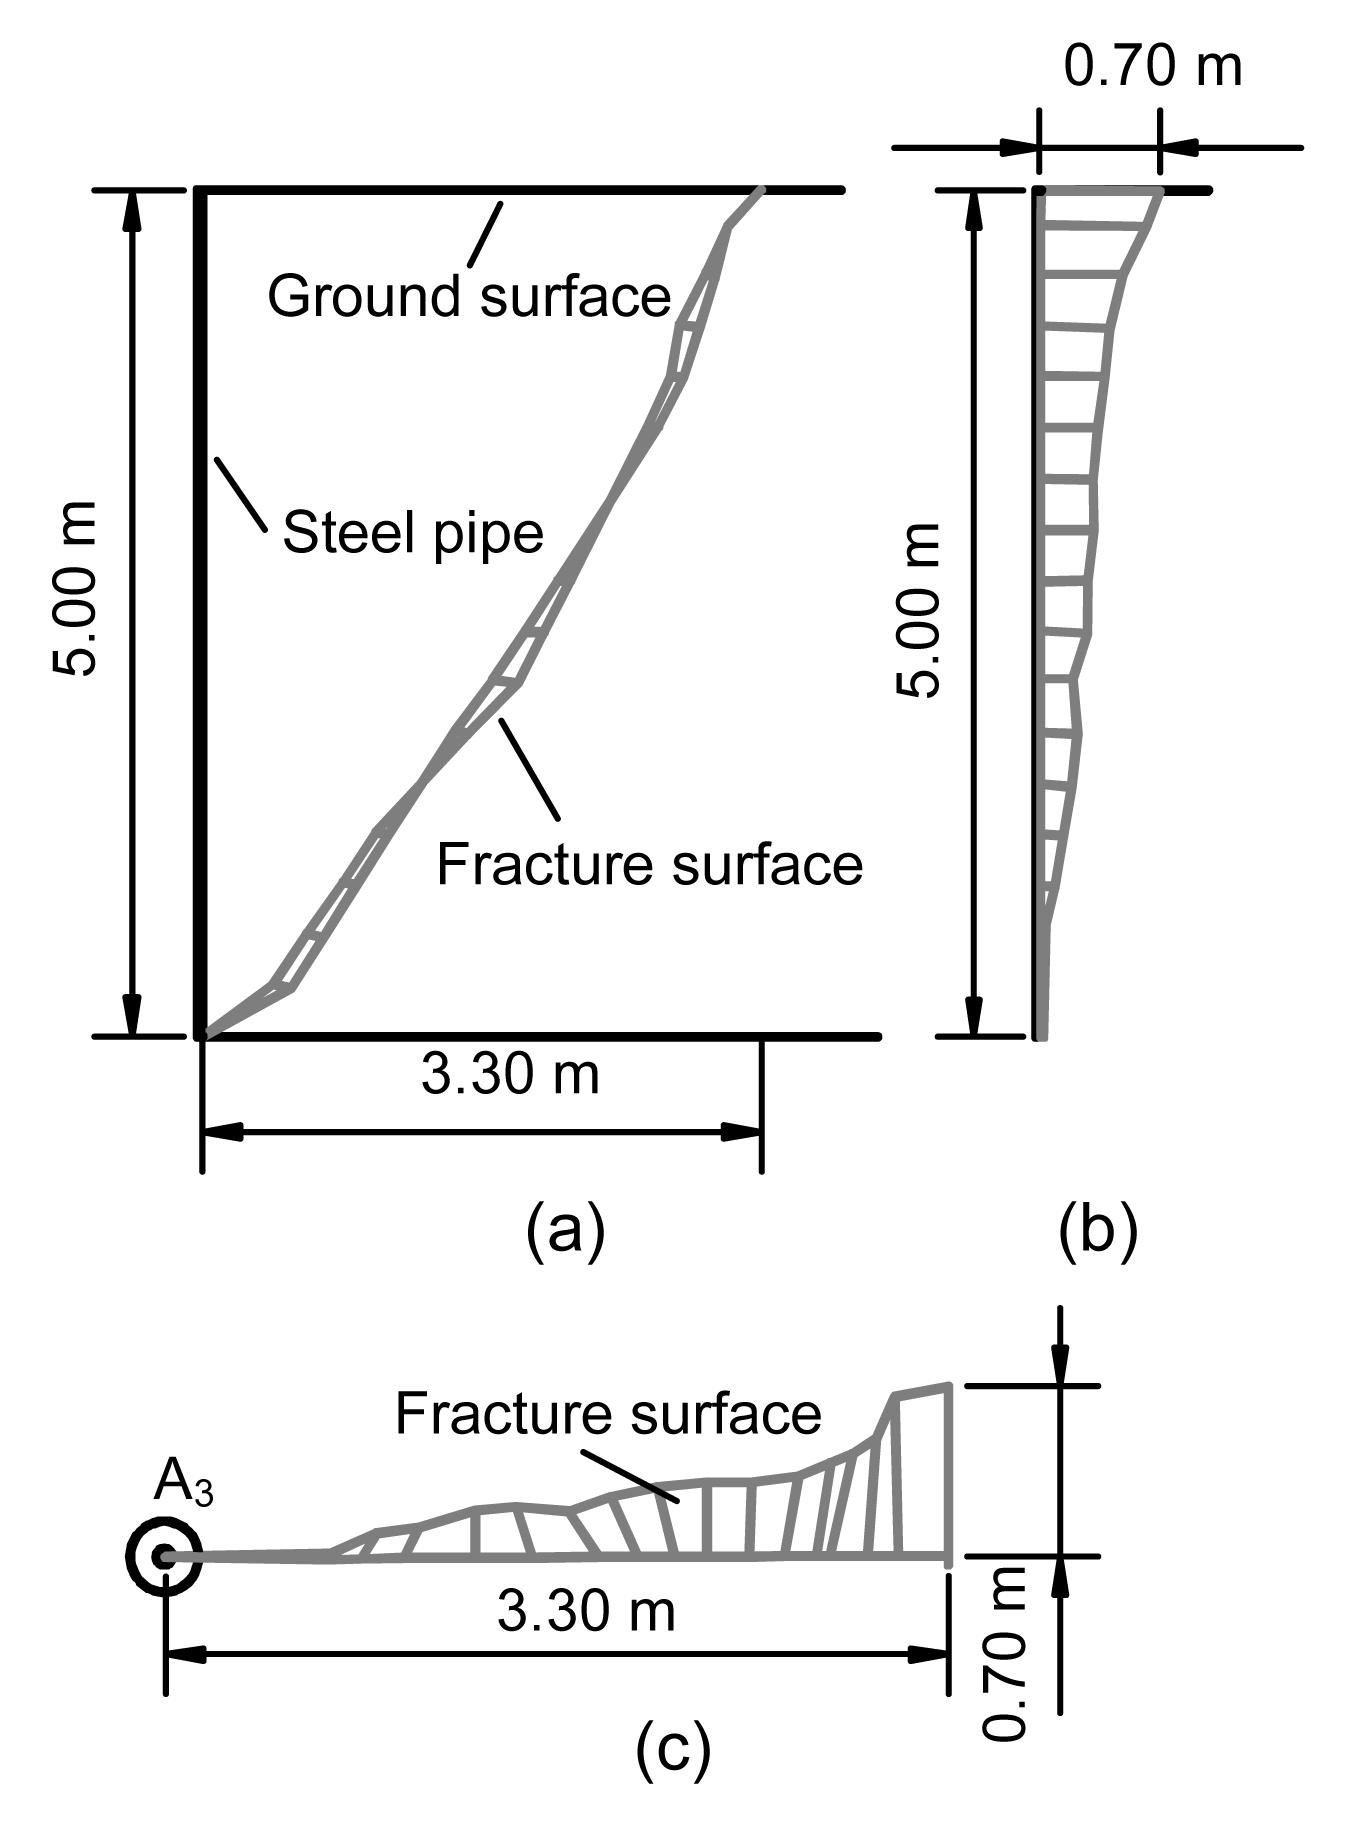
Fig. 8 presents the slurry breakout phenomenon at the end of the slurry fracturing tests. After the fracturing tests were completed, the fracturing path was uncovered by manual excavation. The fracture face for the A3 hole is shown in Fig. 9. The water glass was poured into the apertures before manual excavation to measure the apertures of the fracture. The aperture values varied from 0.9 to 2.1 mm, with the smaller values in the deeper areas of the hole; the average aperture value was 1.1 mm. The slurry mostly seeped away when the fracture was uncovered because of the low speed of manual excavation. Thus, the values of the apertures were residual values—smaller than the values occurring at the time of slurry fracturing. The orientation of the fractures was initially horizontal, then almost vertical, and finally slightly horizontal by the end of the fracture (Fig. 9a). This trend suggests that the orientation of the fractures was controlled by the minimum stress and not necessarily by the orientation of the initial slot. The same phenomenon was observed by Alfaro and Wong (2001) when investigating the fracturing of low-permeability soils.
Fig.8 Slurry breakout phenomenon of the in-situ slurry fracturing tests
Fig.9 Views of the fracture surface of the A3 test hole (a) Front view; (b) Side view; (c) Plan view
3.2. Pressure and flow rate
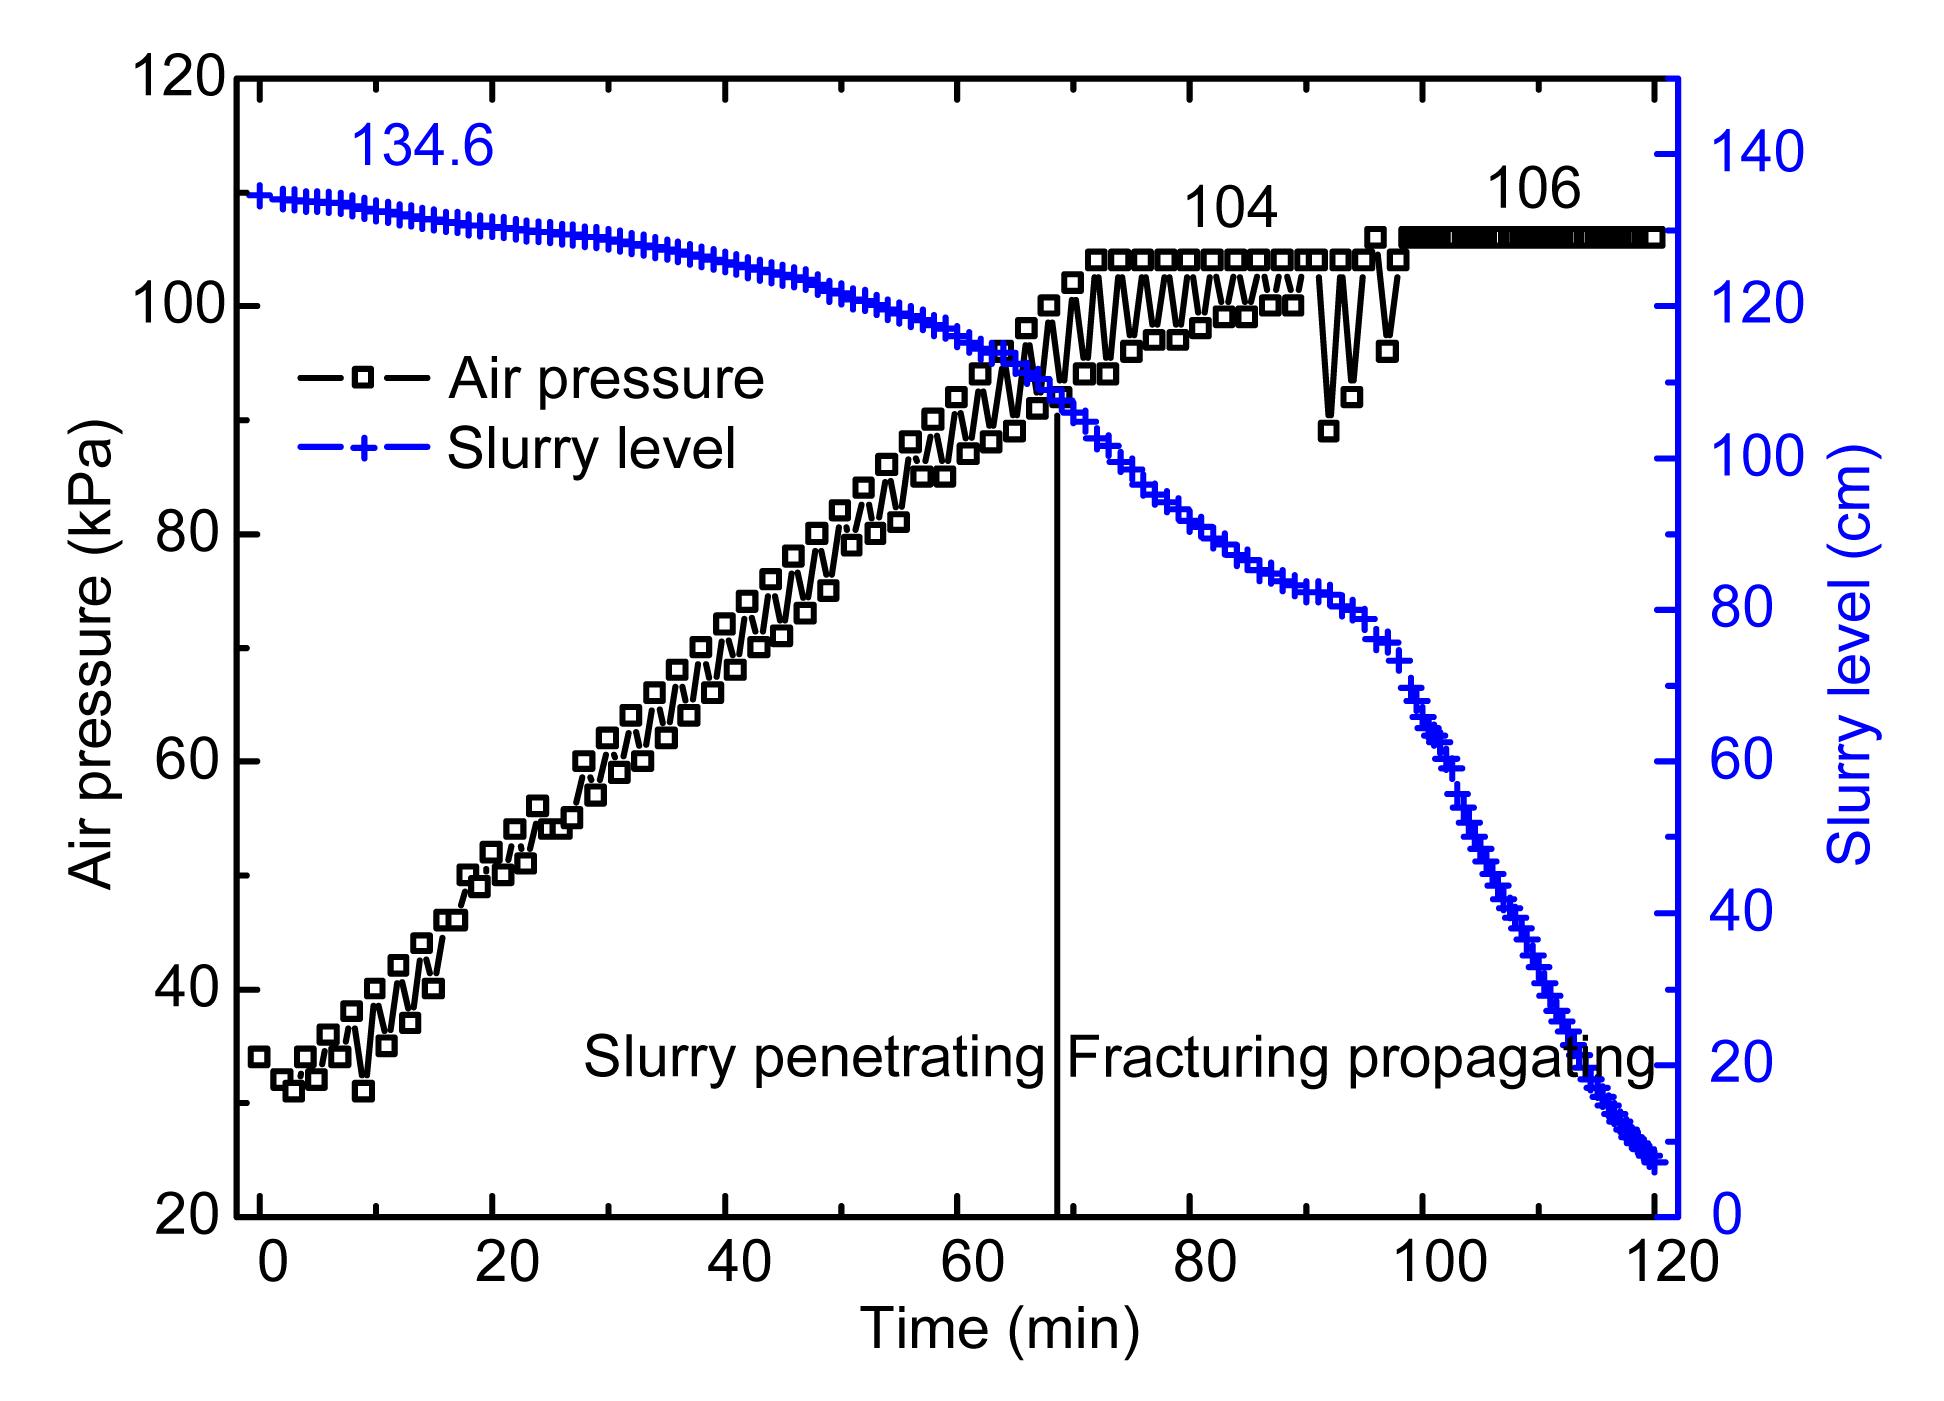
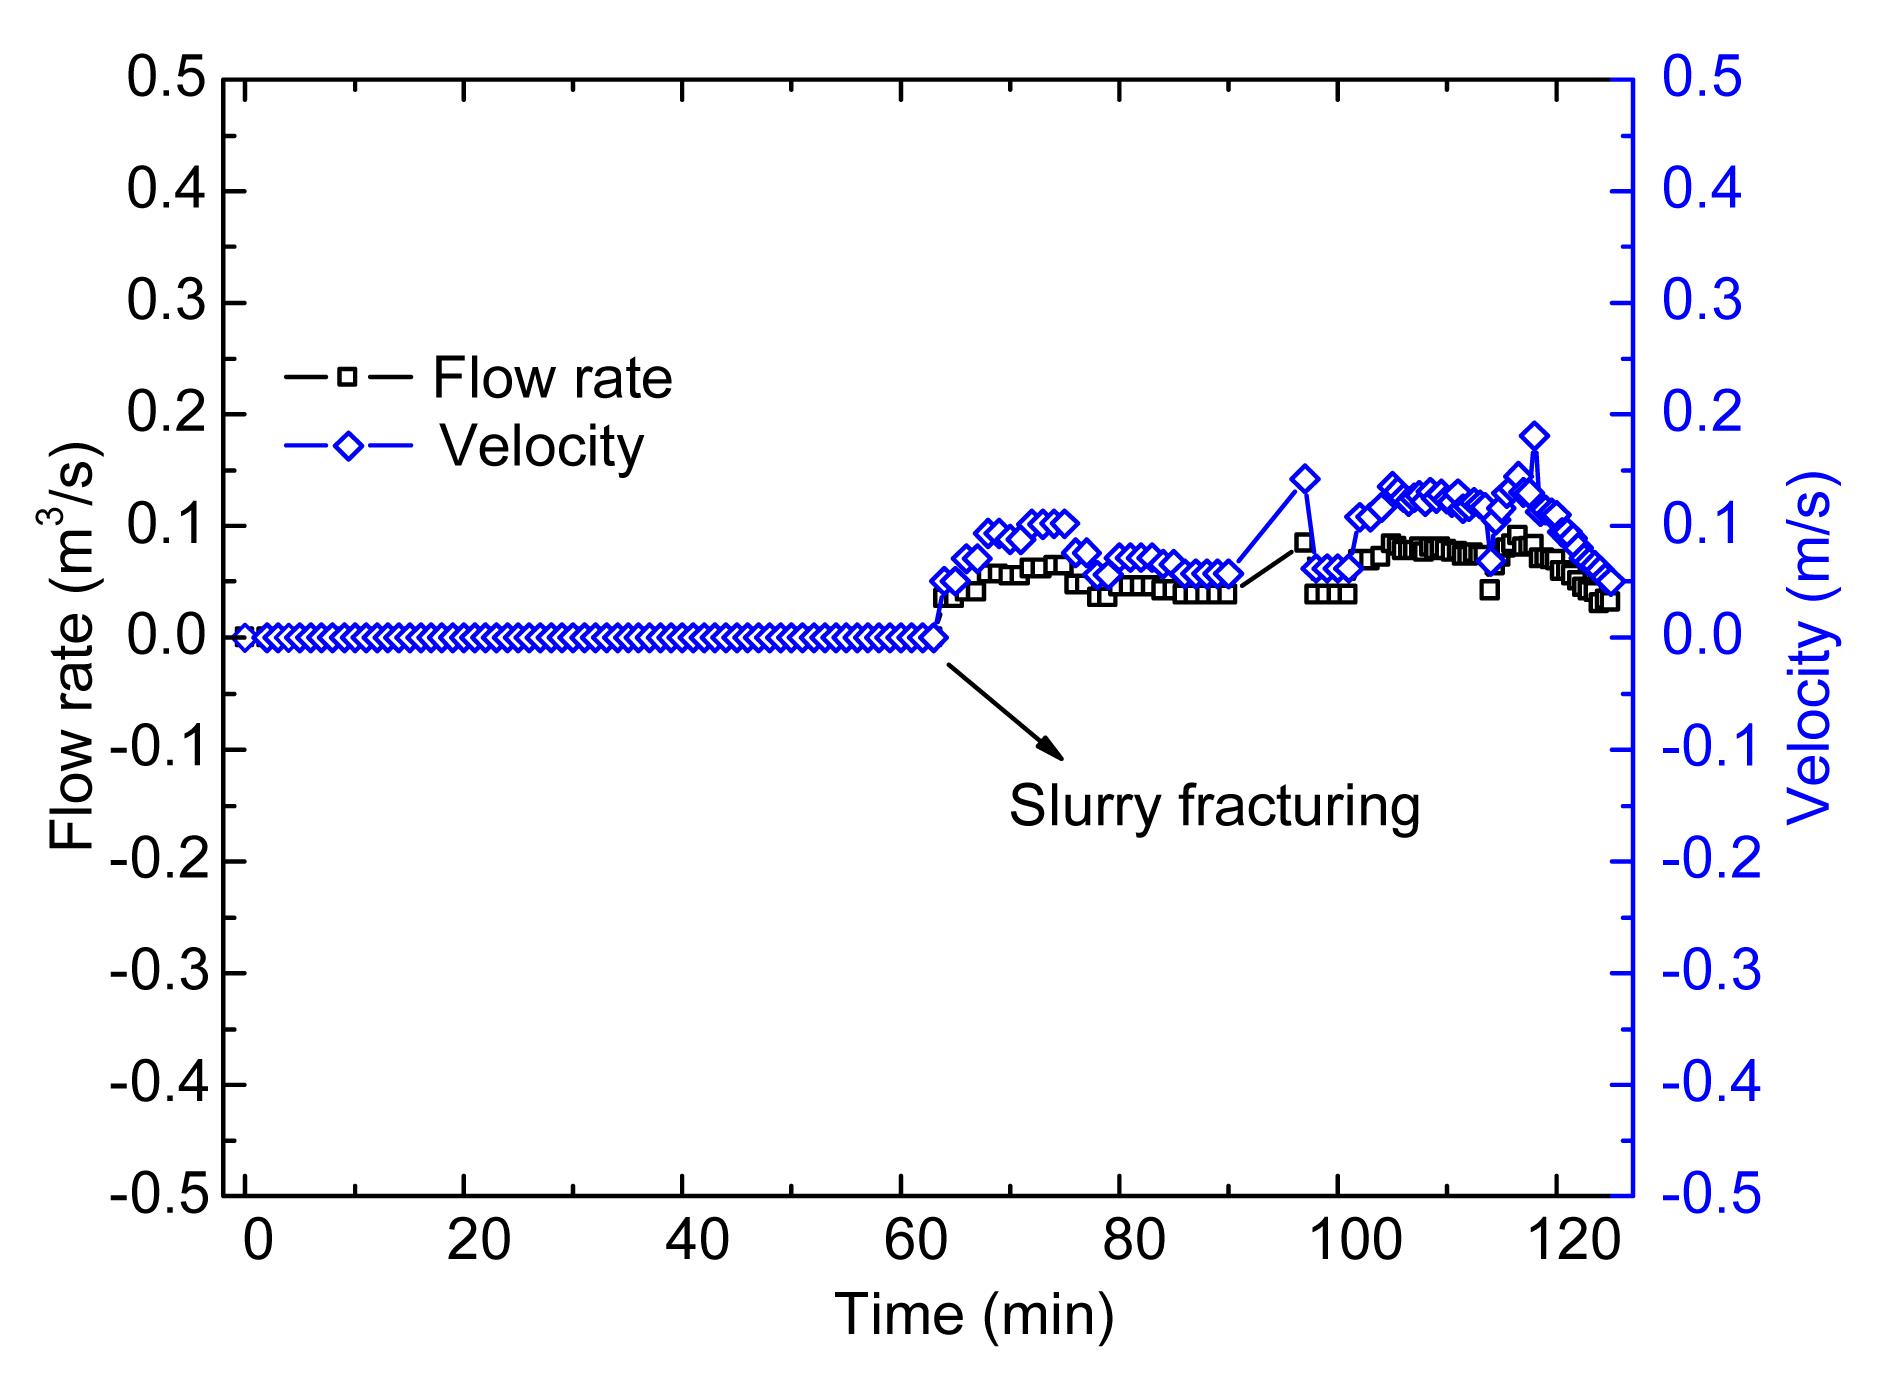
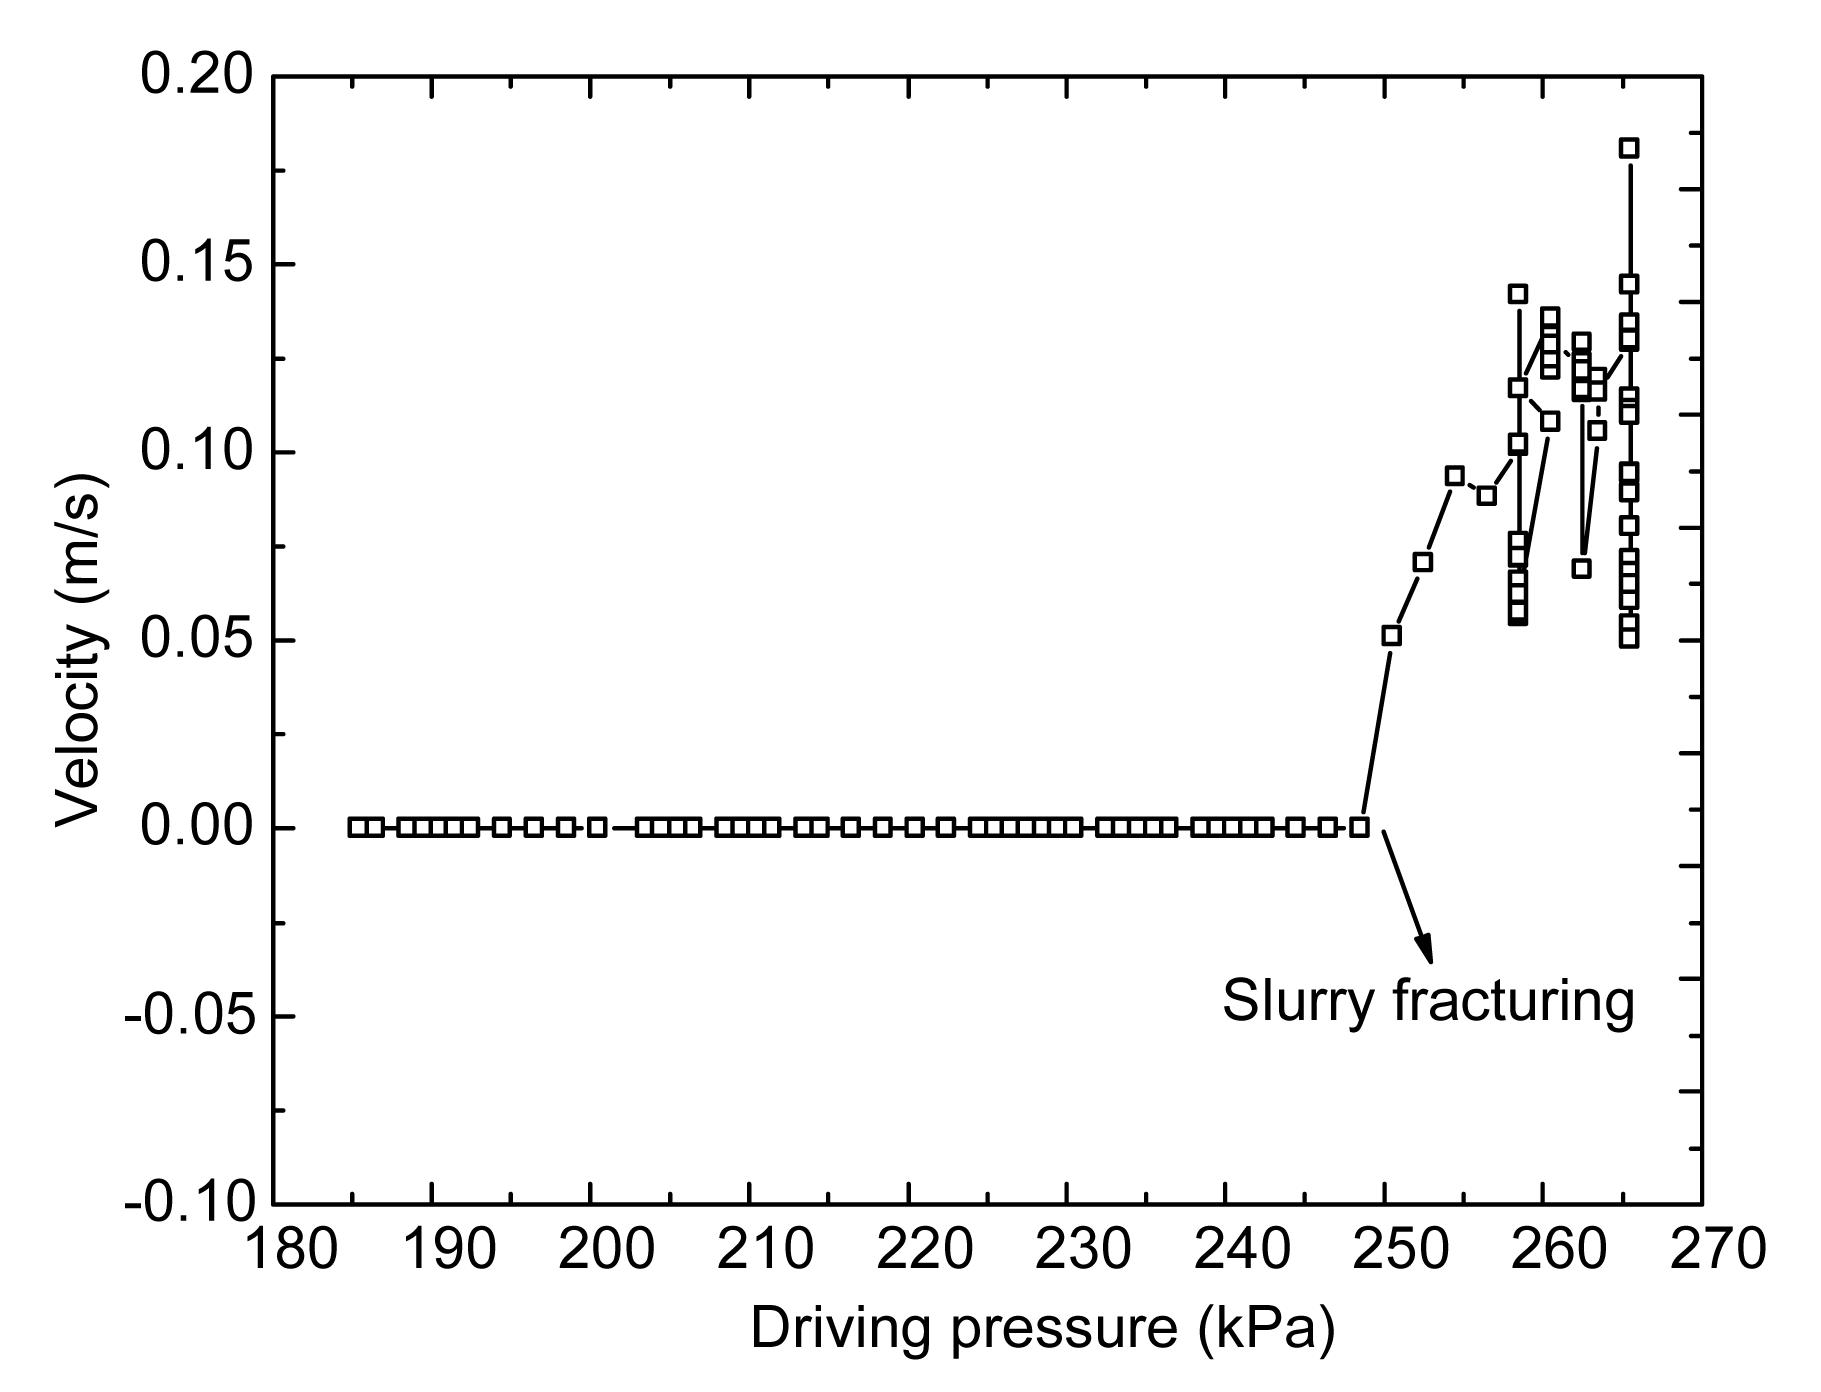
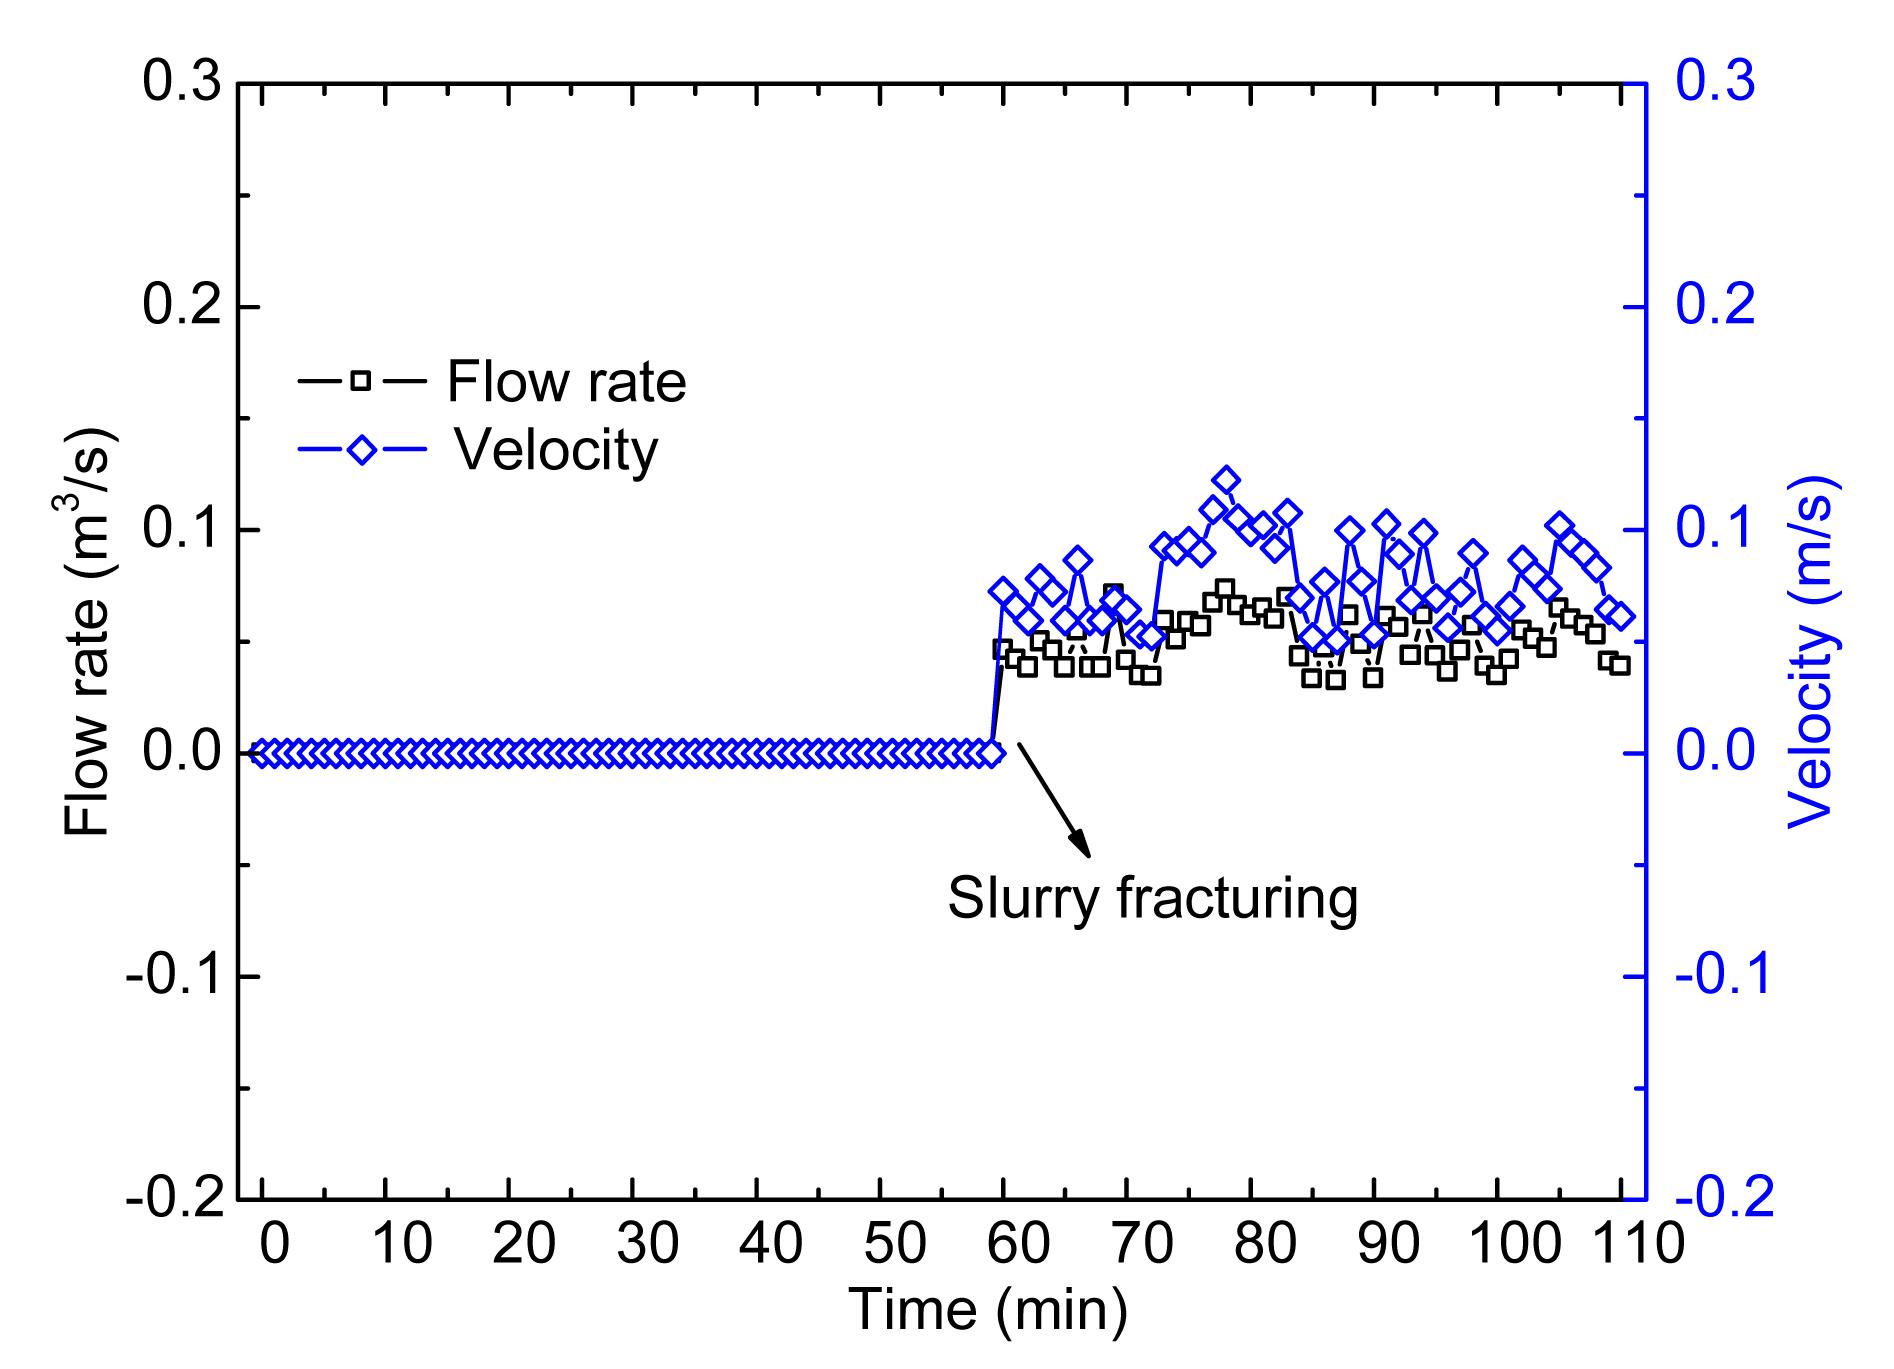
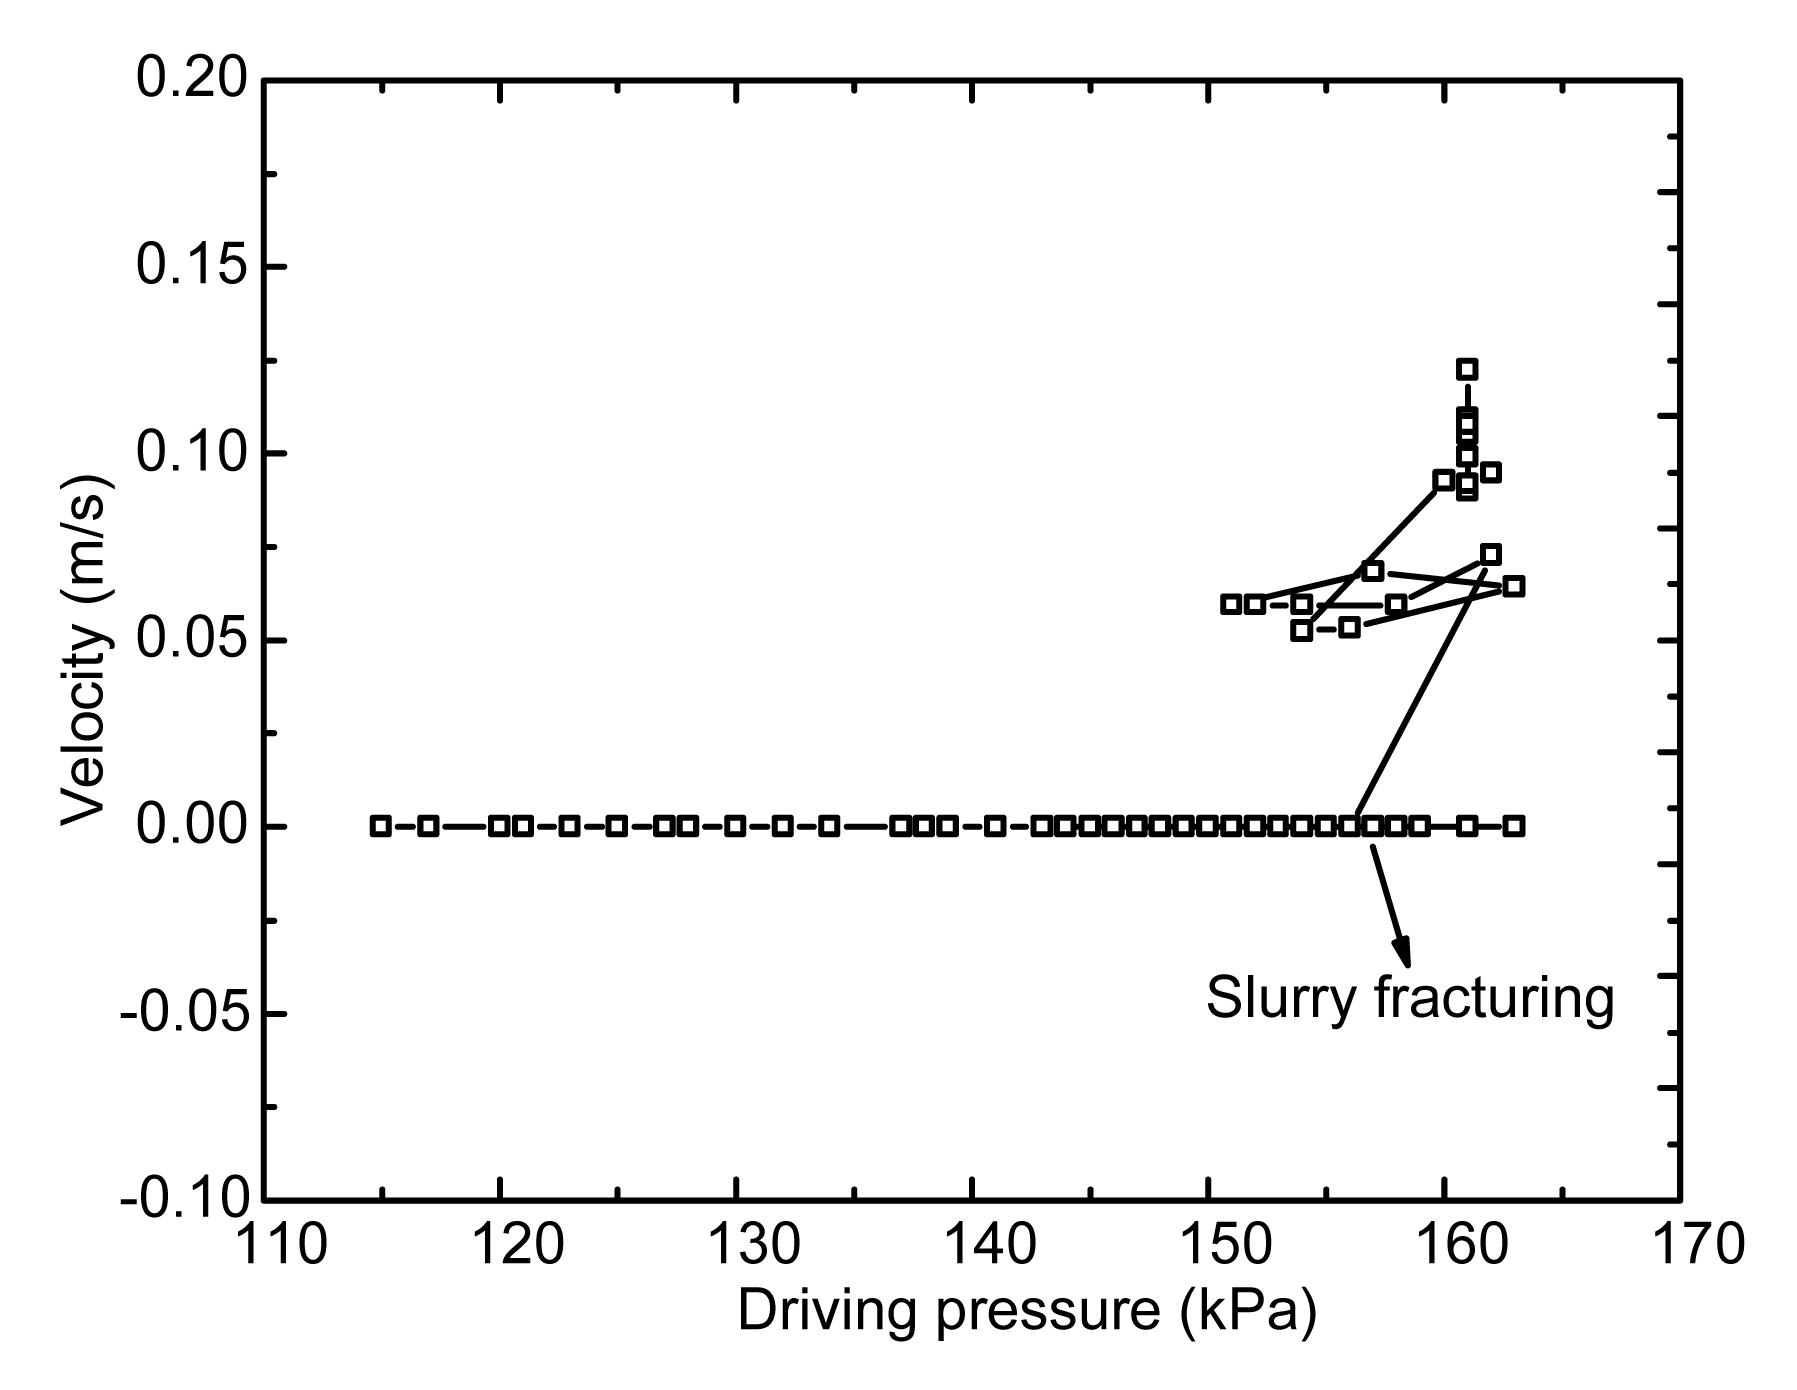
Fig. 10 shows plots of the liquid level and air pressure over time for the A1 hole. The slurry level decreased very slowly with the increasing air pressure at the beginning of the fracturing test. However, the slurry level decreased more quickly when the air pressure reached 104 kPa, where additional air pressure became difficult to add. The value of the flow rate increased sharply at the same time (Fig. 10). Slurry fracturing can be identified as these phenomena appear. Once slurry fracturing appears, the air pressure has a significant influence on the flow speed. The flow rate increased from 0.10 to 0.14 m/s when the air pressure increased only to 106 kPa from 104 kPa (Figs. 10 and 11). Fig. 12 presents the relationship between the flow velocity and the driving pressure of the A1 hole. The driving pressure comes from the pore water pressure at the bottom of the steel pipe. The flow velocity increased sharply when the driving pressure exceeded 250 kPa. Therefore, the initial slurry fracturing pressure of 250 kPa can be obtained.
Fig.10 Liquid level and air pressure over time for the A1 hole
Fig.11 Flow rate and flow velocity over time for the A1 hole
Fig.12 Relationship between the velocity and driving pressure for the A1 hole
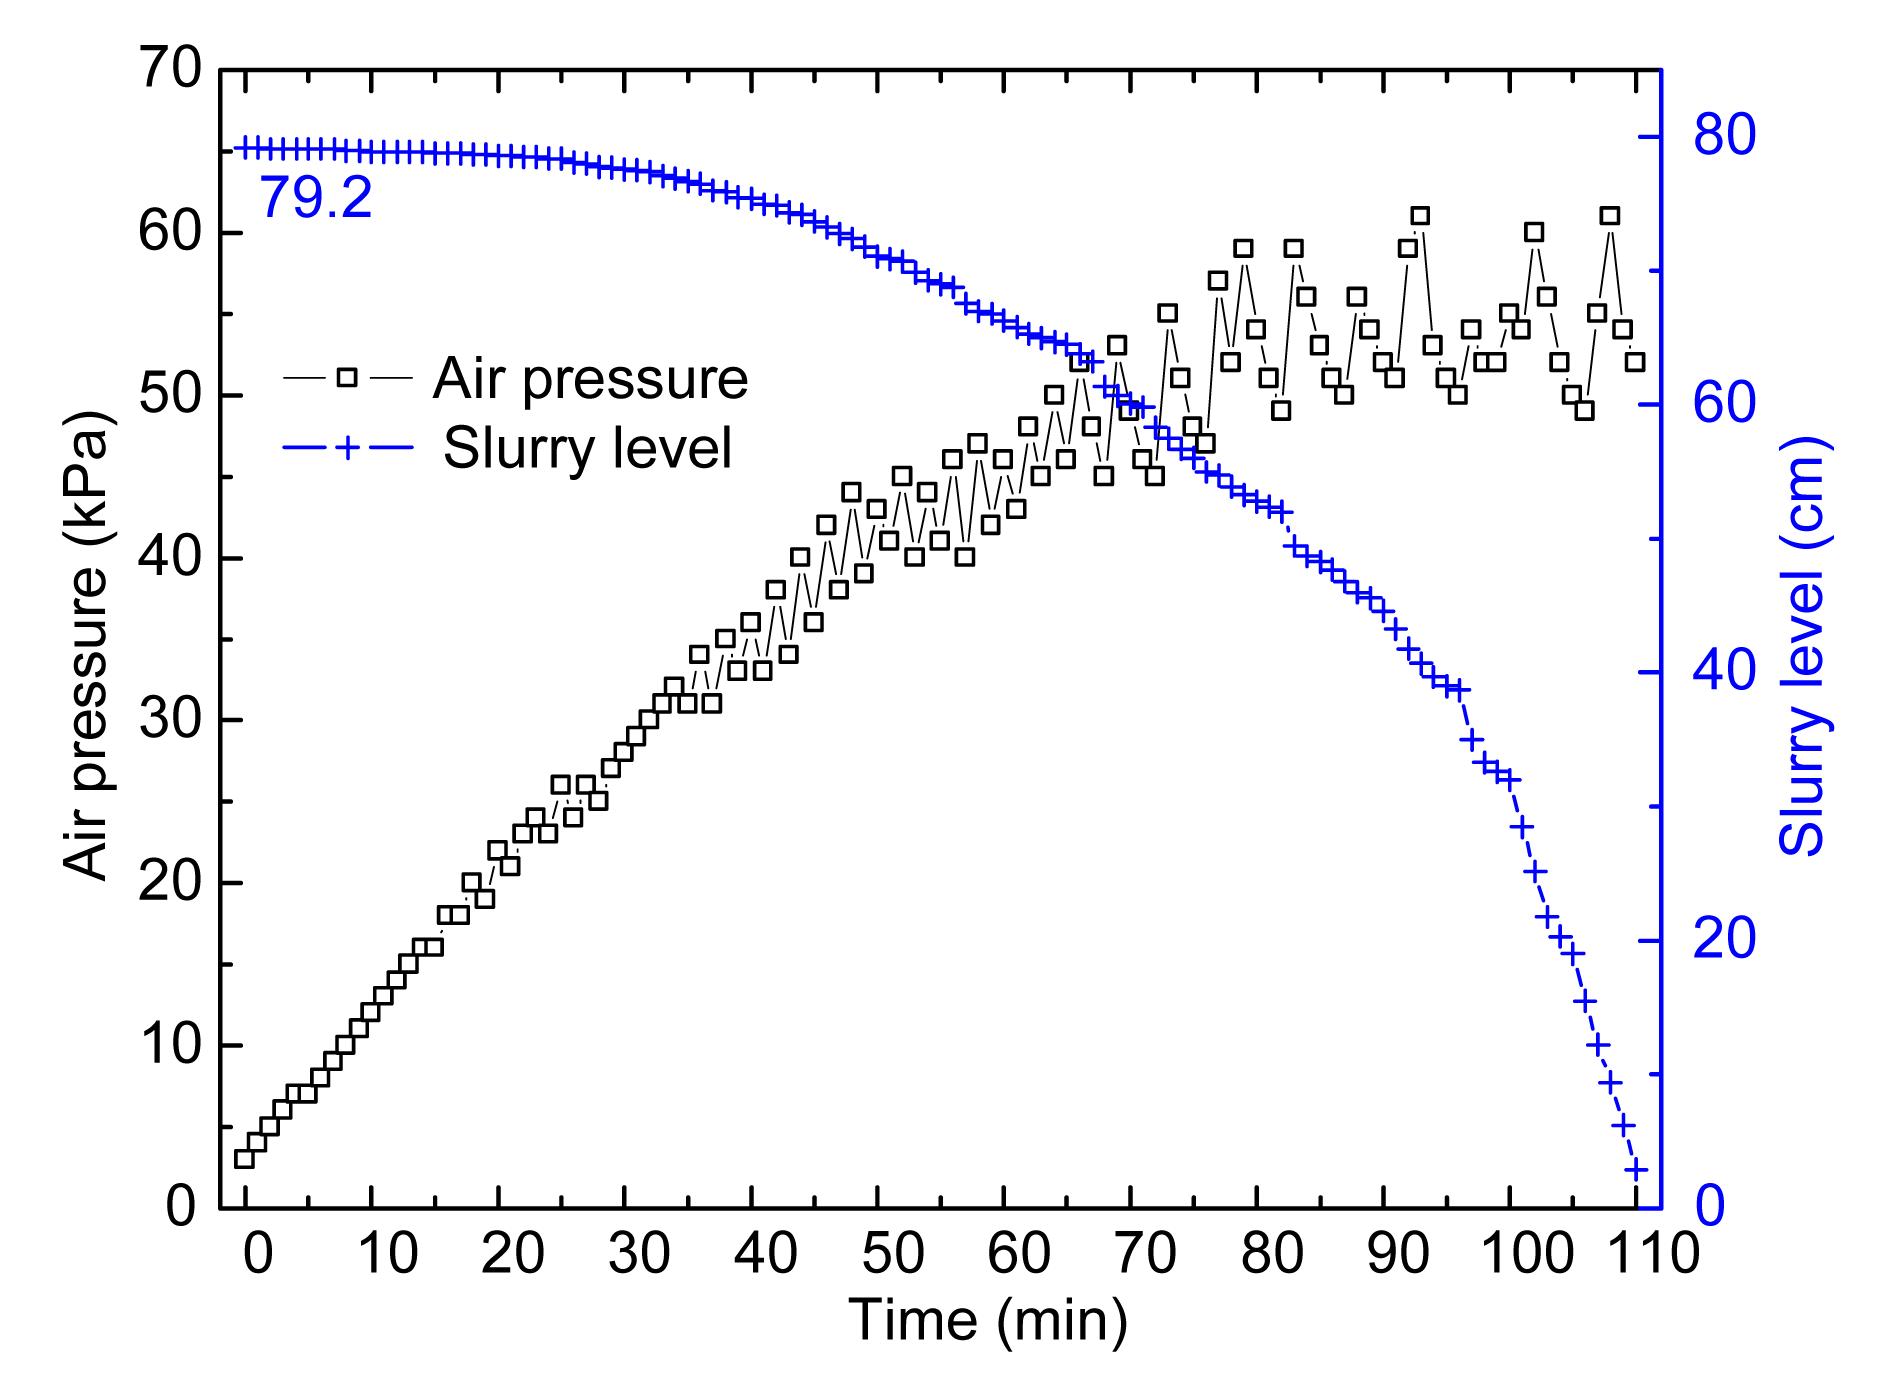
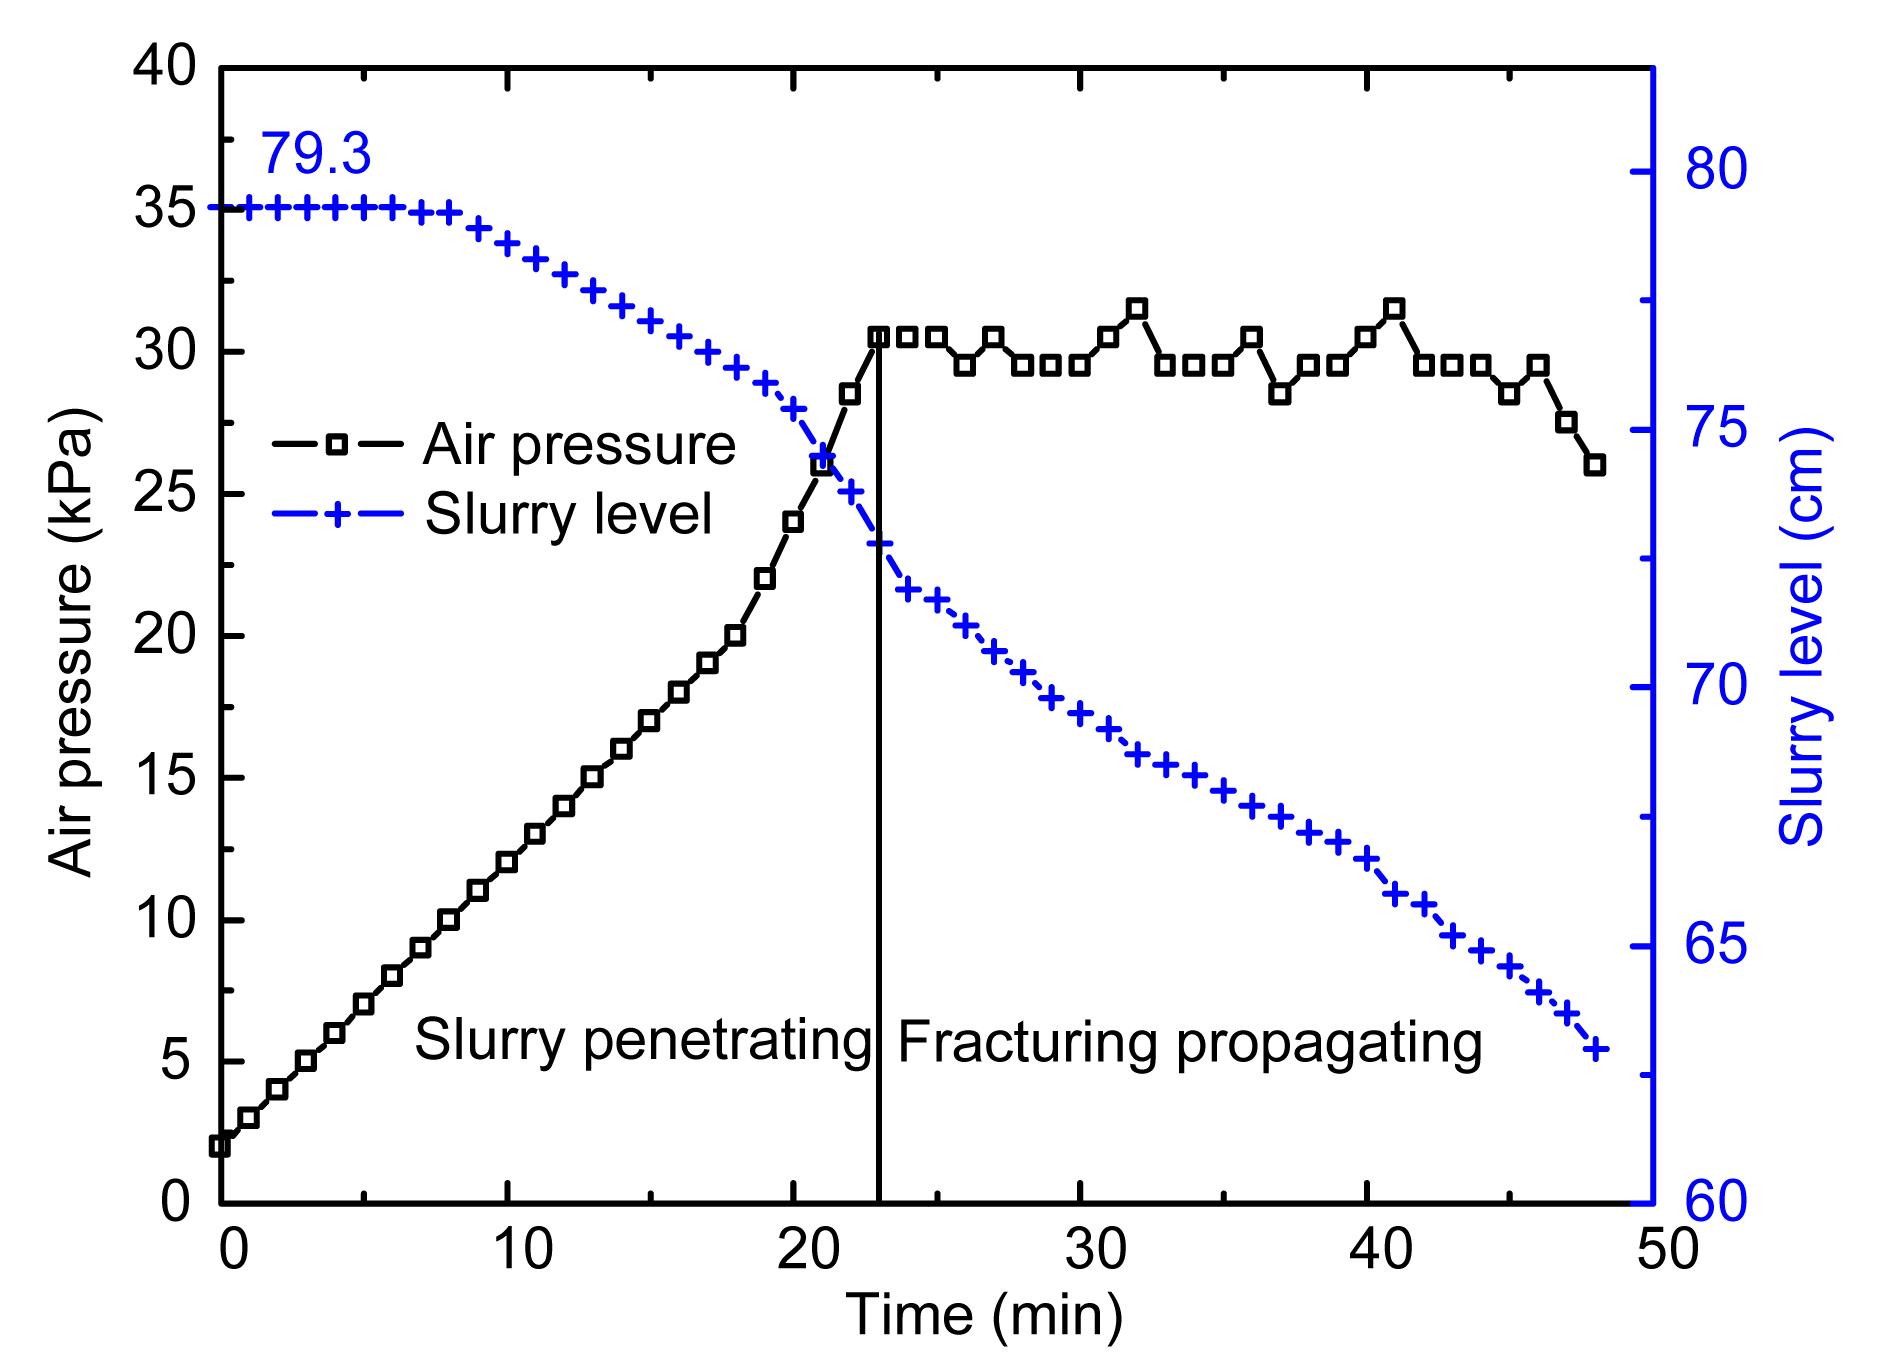
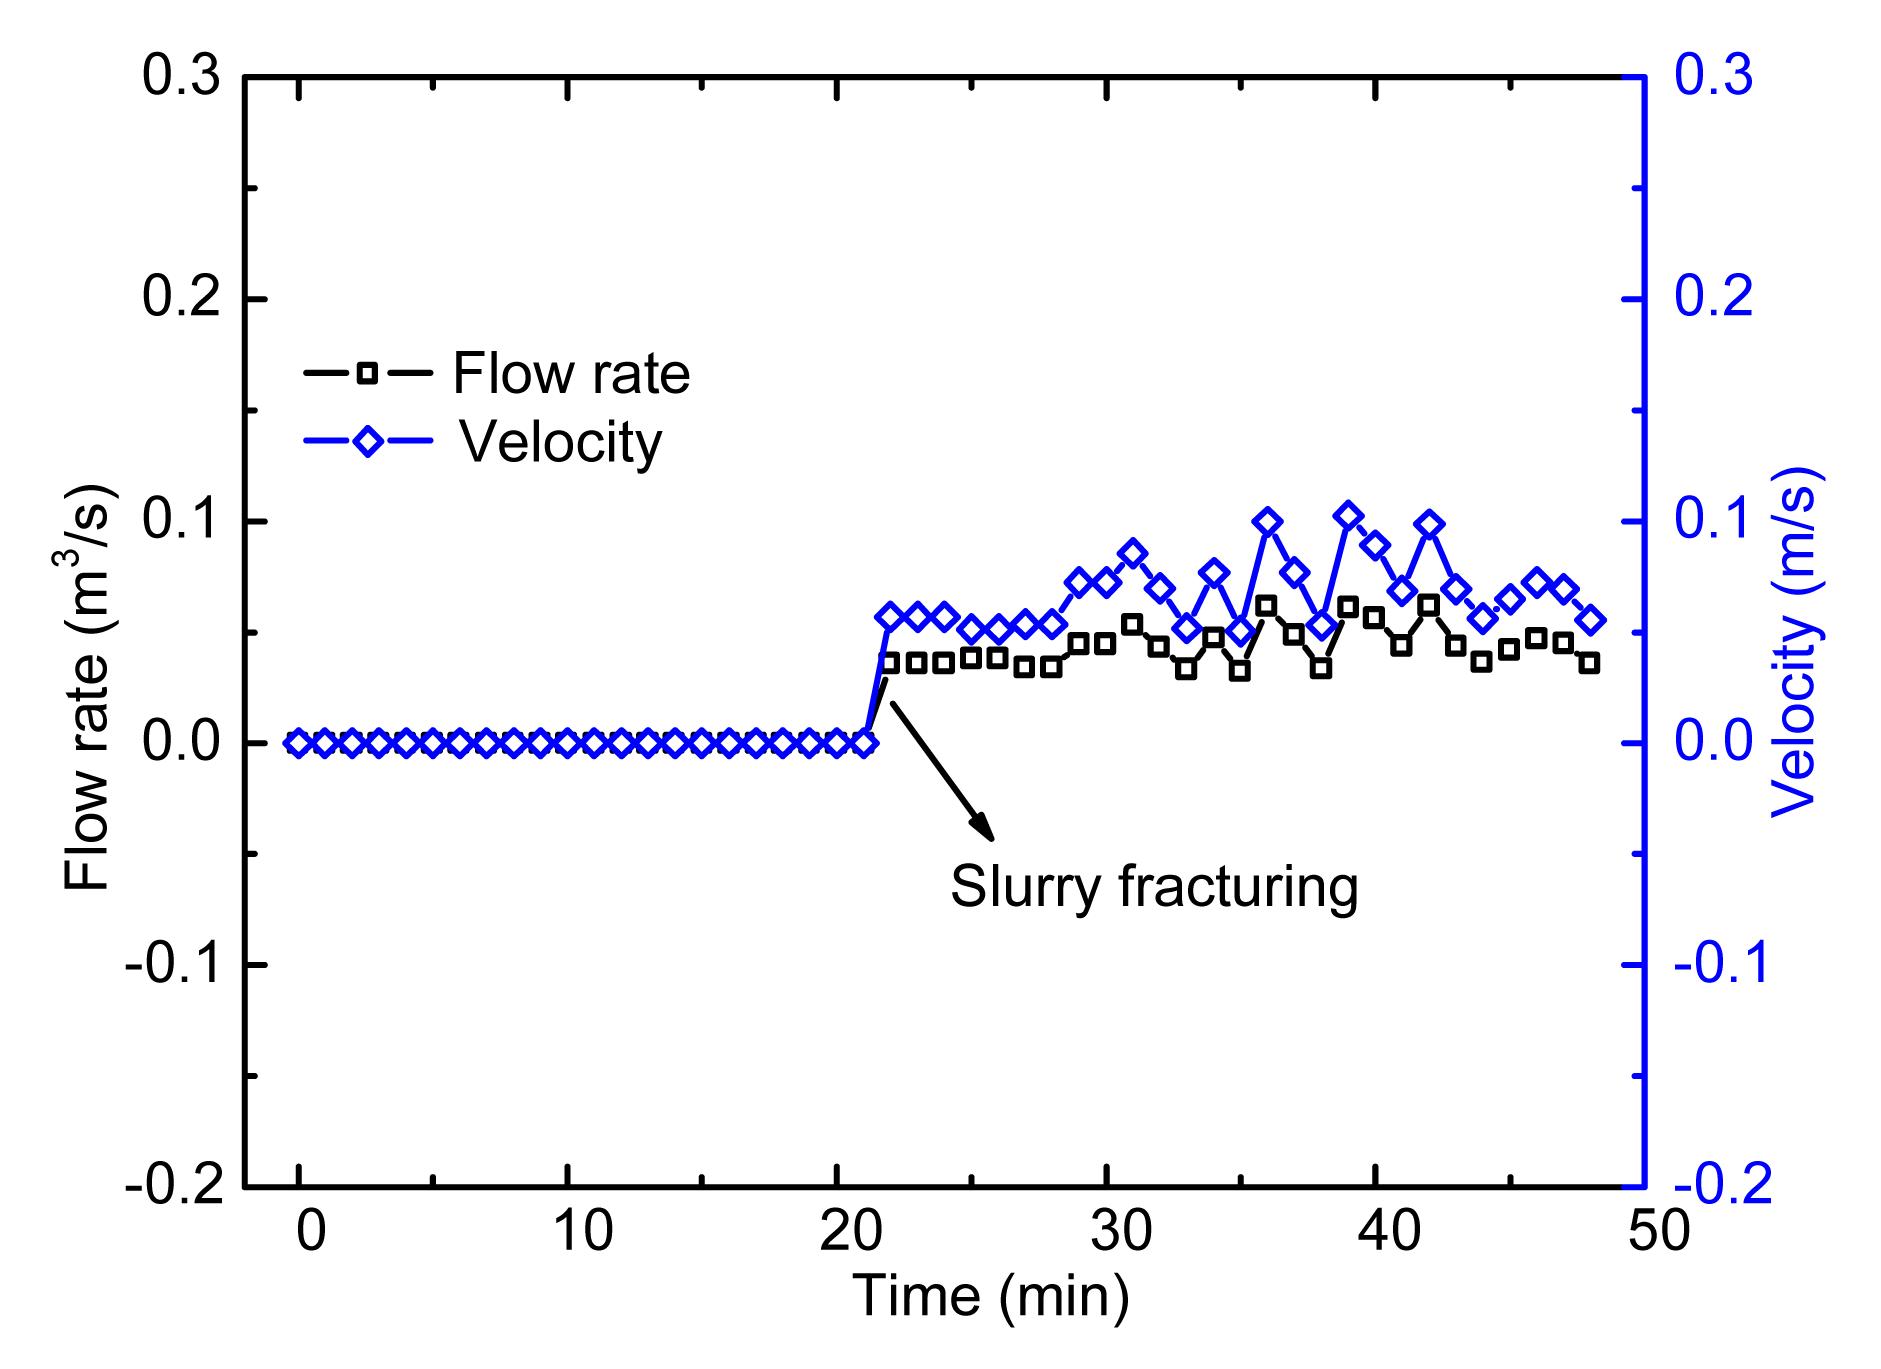
Fig. 13 shows plots of the liquid level and air pressure over time for the A2 hole. The liquid level decreased with increasing air pressure—the same trend that was observed for the A1 hole. However, the slurry fracturing phenomena could not be easily captured because of the varying air pressure and the gentle change of the slurry level curve. Fortunately, the slurry fracturing phenomena were captured by the flowmeter (Figs. 14 and 15). The flow velocity increased sharply when the driving pressure exceeded 155 kPa, thus indicating an initial slurry fracturing pressure of 155 kPa. The slurry fracturing phenomena for the A3 hole were very similar to those for the A1 hole (Figs. 16–18). The initial slurry fracturing pressure of the A3 hole (80 kPa) was easily obtained.
Fig.13 Liquid level and air pressure over time for the A2 hole
Fig.14 Flow rate and flow velocity over time for the A2 hole
Fig.15 Relationship between the velocity and driving pressure for the A2 hole
Fig.16 Liquid level and air pressure over time for the A3 hole
Fig.17 Flow rate and flow velocity over time for the A3 hole
Fig.18 Relationship between the velocity and driving pressure for the A3 hole
The initial fracturing pressures of the other holes were identified in the same manner. The coefficients of the lateral earth pressures measured by the flat dilatometer tests varied from 0.58 to 0.60. The vertical earth pressures can be obtained by γh, where γ is the bulk density of soil, and h is the earth cover depth of the bottom of the test pipe. The groundwater level of the test field was close to the ground surface, therefore their values were considered identical for calculation purposes. Thus, the lateral earth pressure of the holes with depths of 5, 10, and 15 m were 54, 108, and 157 kPa, respectively. The values of the vertical earth pressures, lateral earth pressures, and initial fracturing pressures are shown in Table 2. The values suggest that the initial fracturing pressures of the soft silty clay lay between the lateral and vertical earth pressures. The initial fracturing pressure could be increased by increasing the viscosity of the slurry, but only to a limited extent (Table 2). The slurry with bentonite and clay could not interact with the clay strata because the particle size of the bentonite was close to or even larger than the particle size of the clay.
Table 2
Results of the in-situ slurry fracturing tests
Series of rows
Thickness of earth cover (m)
Thickness of water cover (m)
Vertical earth pressure (kPa)
Lateral pressure (kPa)
Initial fracturing pressure (kPa)
Slurry proportion
A
A1
15
15
270
162
250
Bentonite:CMC:water=8:0.075:91.925
A2
10
10
180
108
155
A3
5
5
90
54
80
B
B1
5
5
90
54
82
Clay:bentonite:CMC:water=20:8:0.075:71.925
B2
10
10
180
108
162
B3
15
15
270
162
255
4. Discussion
4.1. Initial slurry fracturing
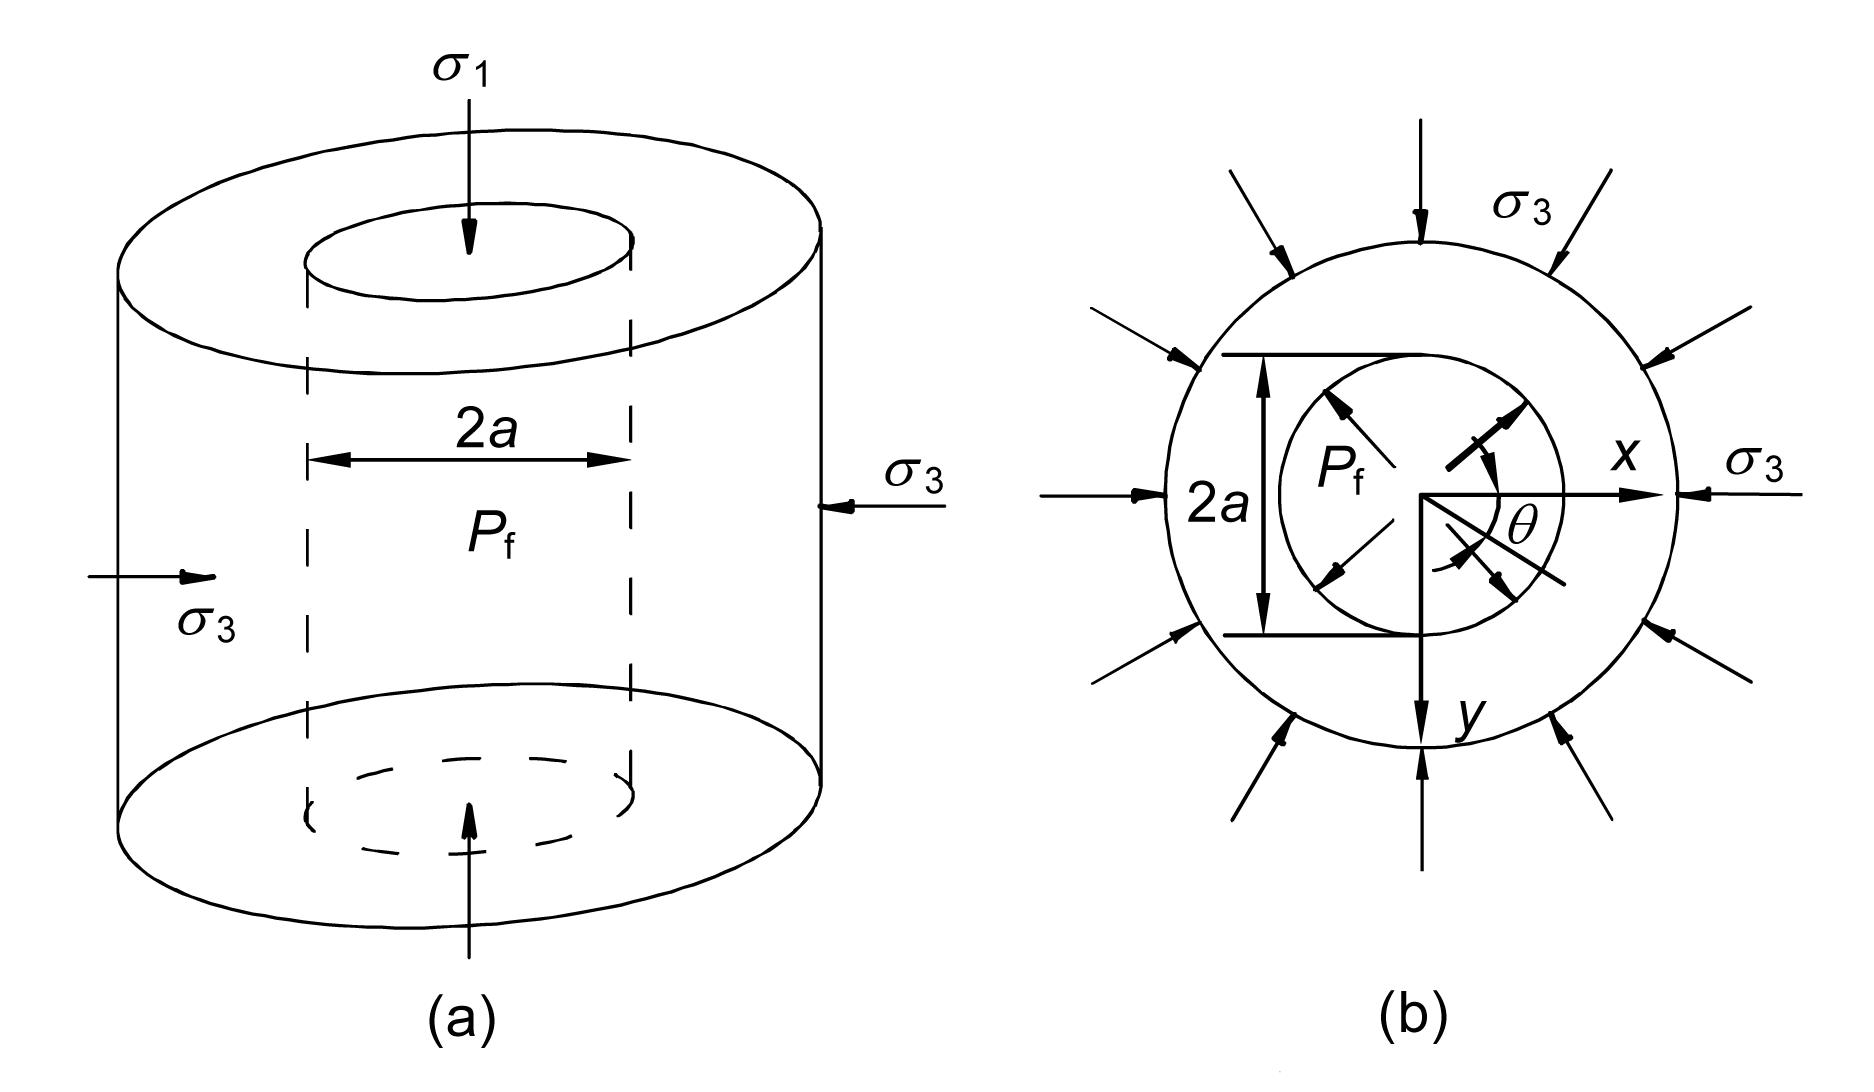
The strata of shallow soft soils distribute in layers, and the isotropy of the strata is weak in the horizontal direction. If the lateral earth pressure is assumed to be uniform in the horizontal direction, an axisymmetric model can be set up, as shown in Fig. 19a. The horizontal size of the model is actually infinite, and the vertical size is so small that it can be neglected. Because the vertical strain can be ignored, the model can be considered a two-dimensional model (Fig. 19b).
Fig.19 Slurry fracturing model (a) Three-dimensional model; (b) Two-dimensional model
Assuming that compressive stress is positive, the solution of the model in Fig. 19b can be obtained by the superposition principle (Atkin and Fox, 2011) as follows:
,
,
,
where r is the horizontal distance between the point to be analyzed and the center of the initial slot, and Pf is the initial slurry fracturing. σ3 is the minimum principal stress that can be considered as the lateral pressure, σ3=K0γh, where K0 is the lateral earth pressure coefficient. The stresses of the point at the edge of the slot, r=a, are as follows:
,
,
.
The Mohr-Coulomb criterion is employed, and the initial slurry fracturing of a point at the edge of the slot can be obtained as follows:
,
where φ is the friction angle, c is the cohesion, and c, φ are the strength indices of the total stress, which can be obtained through a triaxial test in CU condition. The method using these indices to analyze the stability of the soil is called the total stress method.
Eq. (10) can also be described as an effective stress form:
,
where φ′ is the effective friction angle, c′ is the effective cohesion, c′ and φ′ are the strength indices of the effective stress, and u0 is the pore water pressure. The method using these indices to analyze the stability of the soil is called the effective stress method.
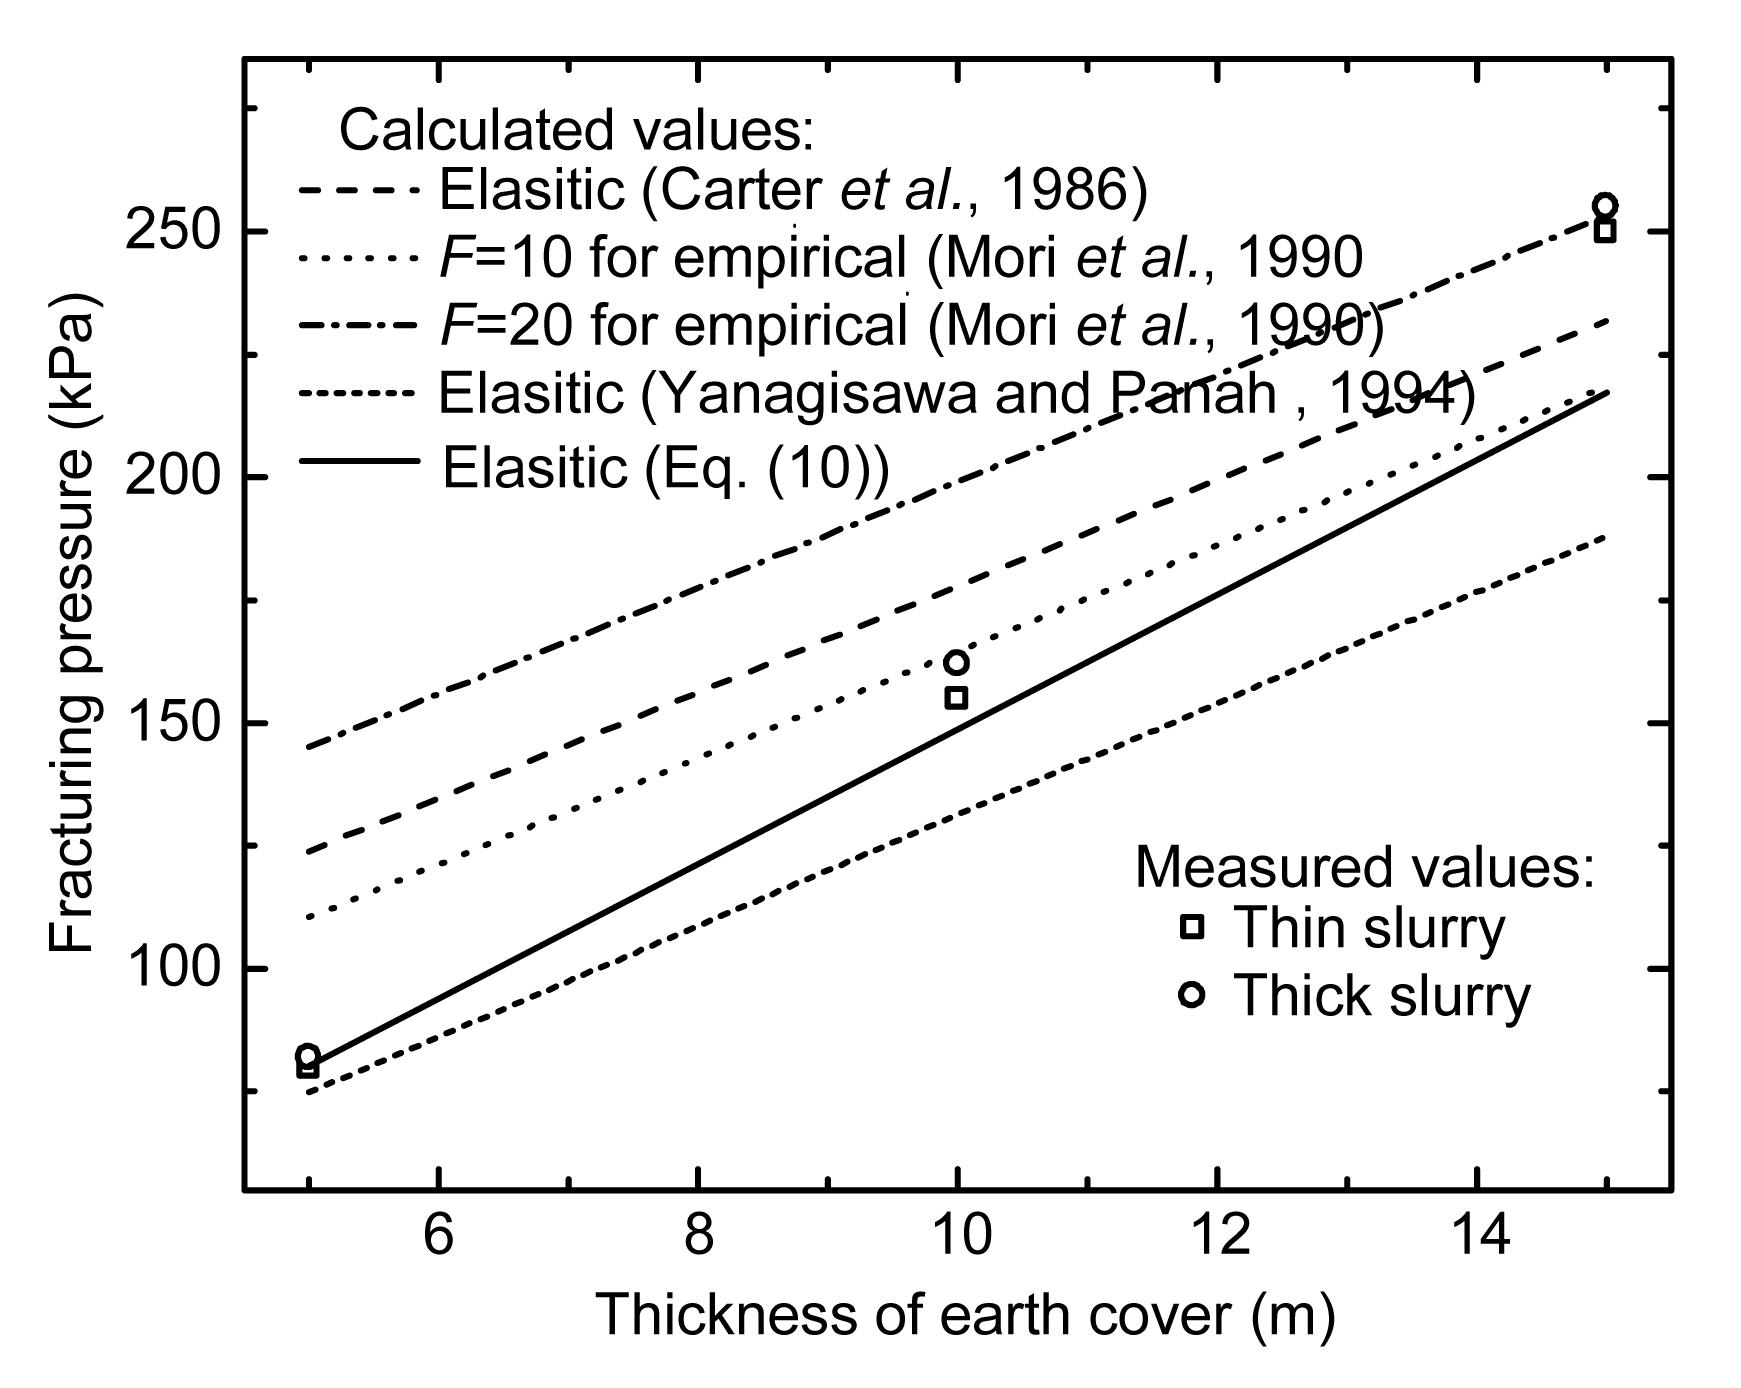
Fig. 20 compares the calculated values of the initial fracturing pressure with the measured values. The calculated values were obtained using Eq. (10) and the formulas proposed by Carter et al. (1986), Mori et al. (1990), and Yanagisawa and Panah (1994), using the parameters of soft silty clay (Table 1). The effective stress strength parameters, such as cohesion and the shear modulus, were employed to calculate the fracturing pressure using the formula proposed by Carter et al. (1986) and based on the elastic theory of cavity expansion. The shear modulus was empirically obtained at about three times the modulus of compressibility. The predictions of the formula proposed by Carter et al. (1986) are higher for shallow covers and lower for deep covers, as are those of the empirical formula obtained by Mori et al. (1990) using a viscosity of 10 s for Row A. The predictions of the empirical formula are higher for shallow covers, with a viscosity of 20 s for Row B. However, the formula obtained by Yanagisawa and Panah (1994) more accurately predicts the initial fracturing pressures for shallow covers. Eq. (10) provides better predictions overall, although gaps exist for deep soil covers. The discrepancies are about 13% (32.8/250)–15% (37.8/255), which may be due to the higher bulk density, as it close to the layer of silty clay.
Fig.20 Measured versus predicted values of the initial fracturing pressures for the in-situ test
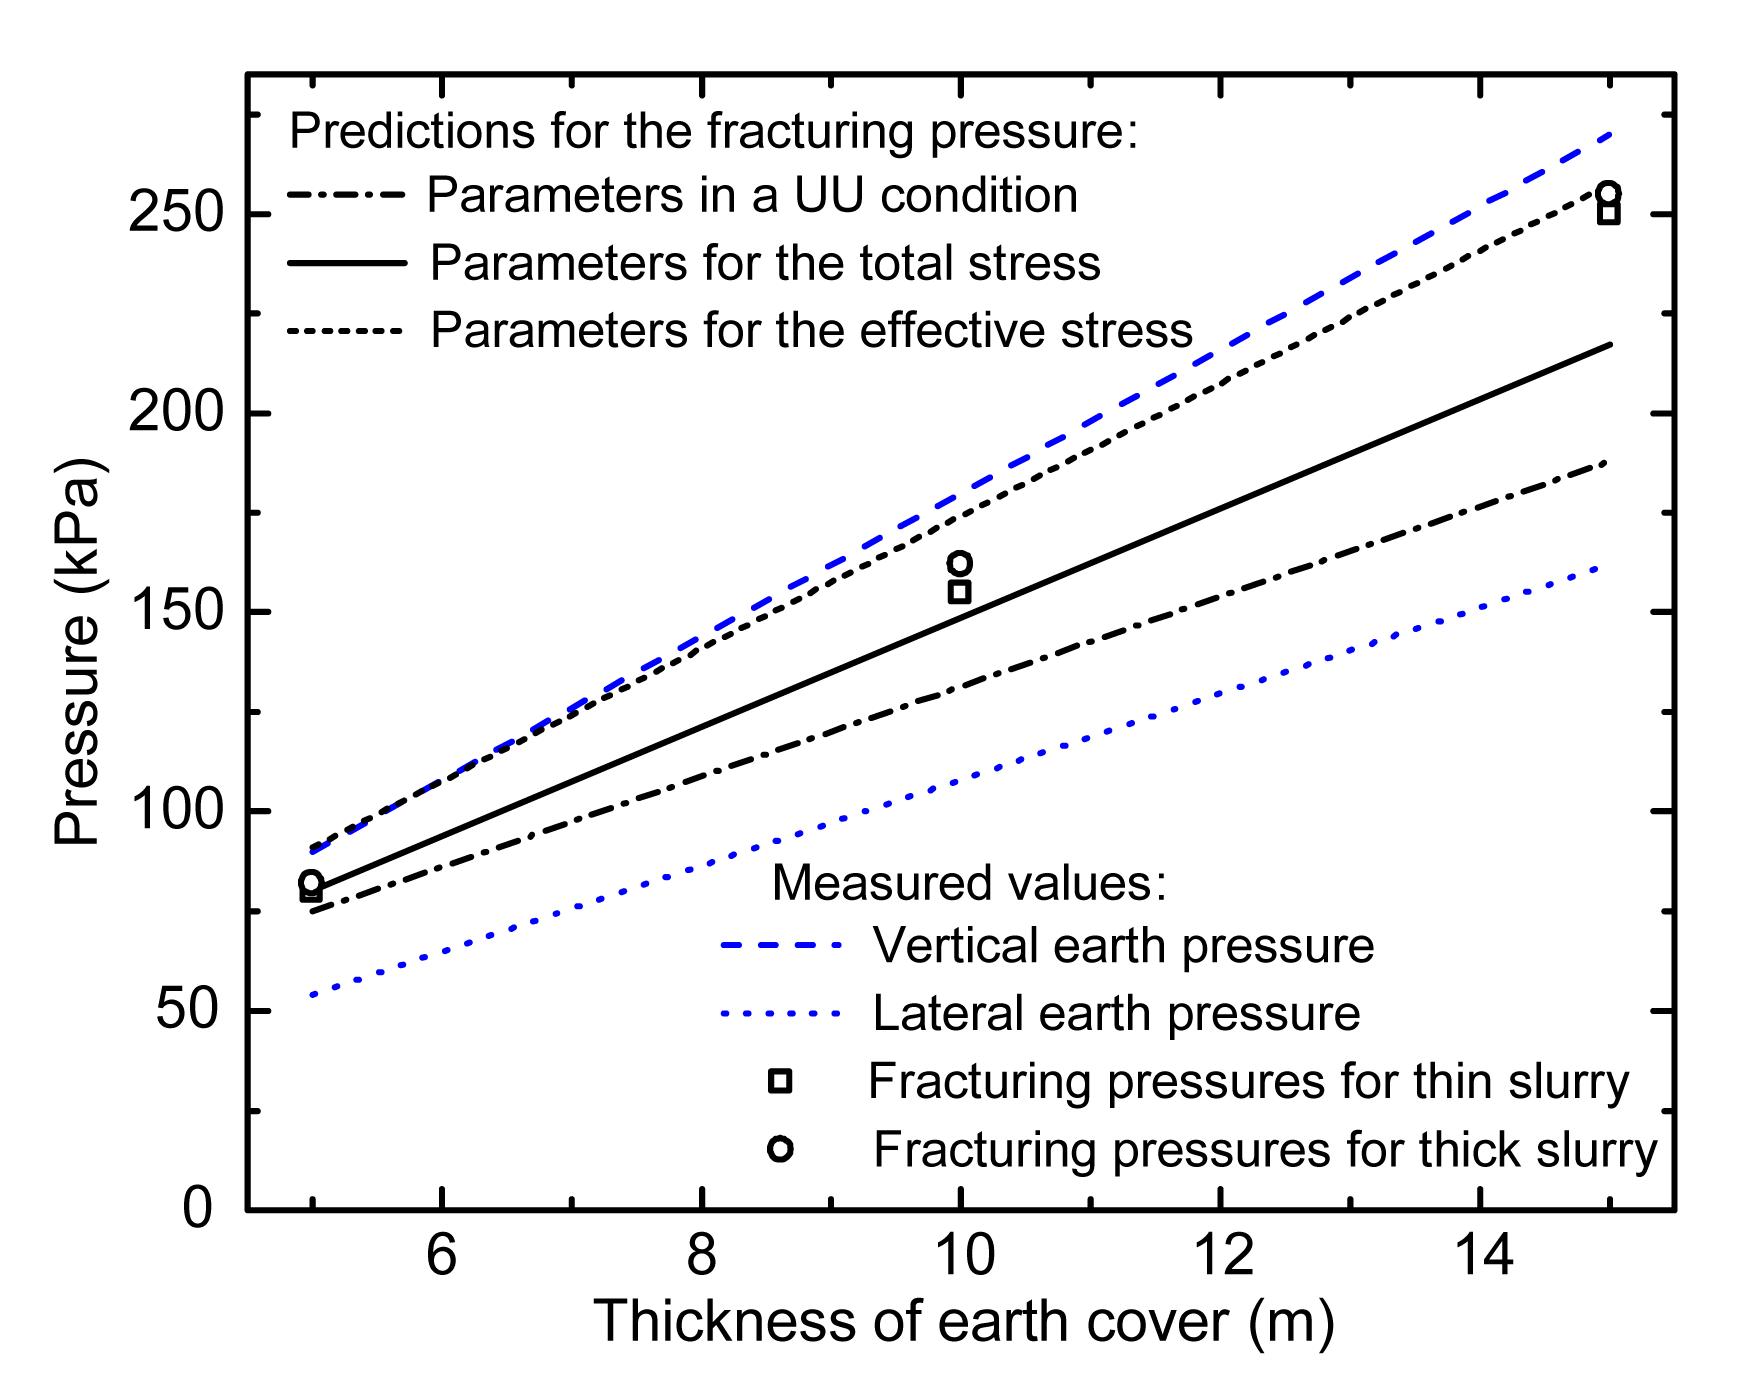
The predictions of Eq. (10), using the strength parameters in the CU condition in the total stress, are better than those using most other strength parameters (Fig. 21). The stratum has a long history of consolidation, and slurry fracturing is a rapidly changing process. The predictions of Eq. (10) that use the effective strength parameters are more accurate, but they tend to over-predict the actual values, which can be dangerous for project applications. Therefore, the strength parameters in total stress (rather than in effective stress) were chosen for subsequent analysis.
Fig.21 Comparison of the strength parameters used to predict the initial fracturing pressures
4.2. Fracture propagation
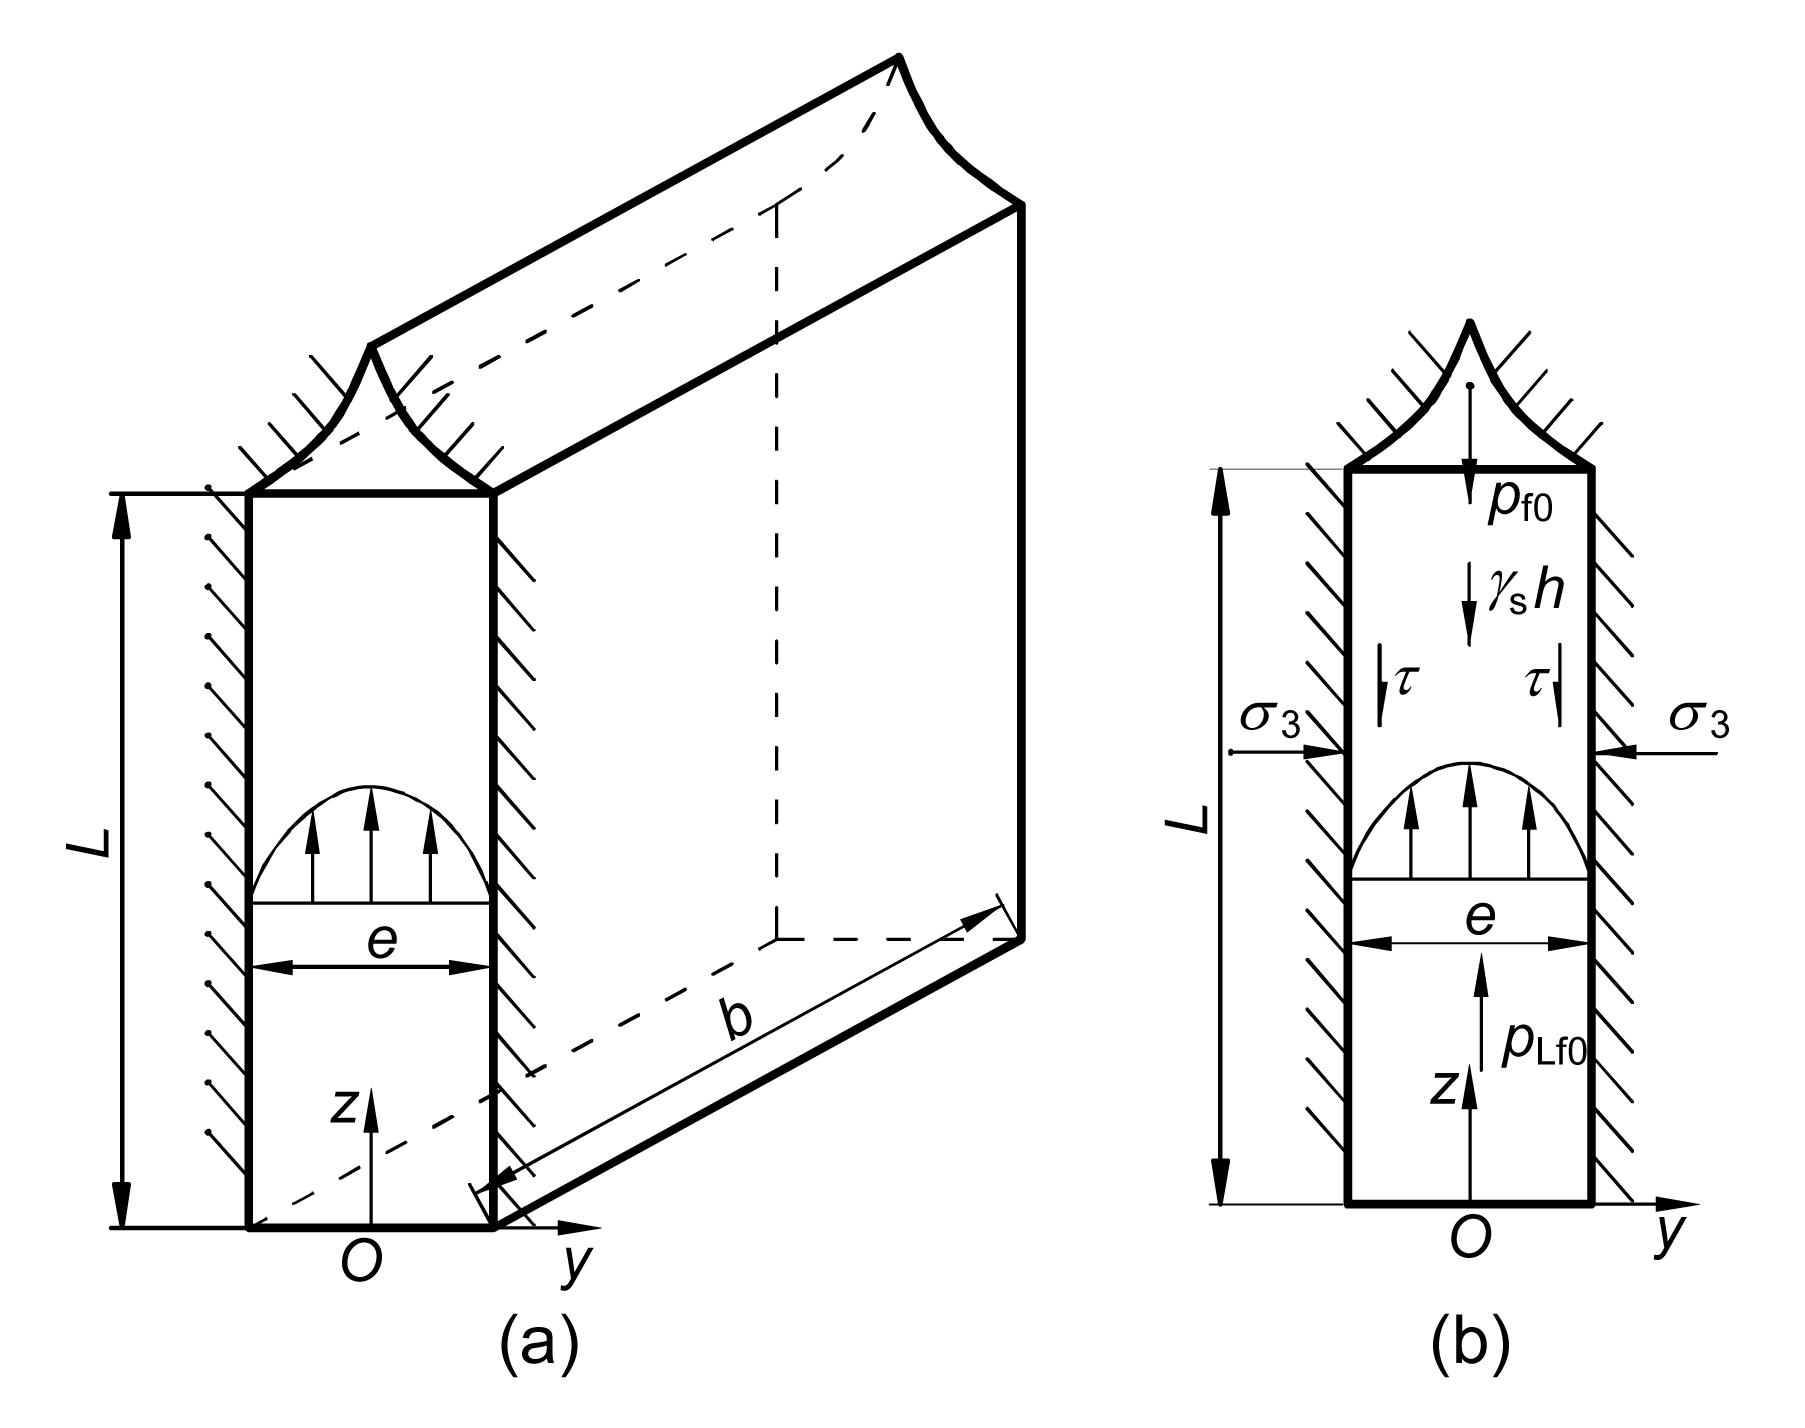
One of the fracture faces was uncovered by manual excavation (Fig. 9). A unit length of the fracture face can be analyzed using the model shown in Fig. 22. During fracture propagation, the fracturing pressure at the fracture tip, the body force of the slurry, and the viscous resistance against the slurry movement are considered in the model.
Fig.22 Mechanical model for fracture propagation (a) Three-demensional model; (b) Two-demensional model
Assuming that the balance between the driving force and resistance forces is maintained, the following equation can be obtained:
,
where pLf0 is the driving pressure, b is the width of the fracture near the tip of the fracture, e is the aperture of the fracture, pf0 is the fracturing pressure of the fracture tip, τ is the viscous resistance pressure against slurry movement, L is the length of the fracture, and γs is the bulk density of the slurry.
Eq. (12) can be simplified as
,
where pf0 can be expressed in total stress as
.
Water with cohesive clay particles is typically considered to be a Bingham fluid, such as slurry. Under simple shear, the stress-stain relationship is nonlinear:
where μ is the coefficient of the dynamic viscosity, u is the slurry velocity, τ0 is the yield stress, sgn() is the sign function, and sgn()=x/|x|, where x=∂u/∂y.
Slurry is much thinner than cement mortar, and the bentonite in slurry is beneficial for lubrication. Thus, the yield stress of the slurry is very low and can be ignored. The stress-stain relationship can be described as
.
Assume that the curvature of the fracture surface is very slight. The coordinates can be set with the y-axis along the fracture surface. Fracture propagation has been investigated by Murdoch (1992; 1993a; 1993b) in the laboratory with the assumption of laminar flow. Using the same assumption, the boundary layer theory (Munson et al., 2012) can be introduced for viscous resistance calculations:
,
where U is the maximum value of the slurry velocity, Rex is the Reynolds number, and Rex=Ux/ν, where x is the length of the fracture surface and ν is the kinematic viscosity coefficient.
Therefore, the driving pressure, pLf0, can be obtained by
.
However, if the thickness of the boundary layer was larger than the half-aperture of the fracture, then the two boundary layers would cross each other. The maximum slurry velocity occurs at the middle of the aperture. The differential coefficient of the slurry velocity would not be continuous, which does not occur. Thus, the form of velocity distribution in the slurry is assumed to be a quadratic parabola, which is slightly different from the form obtained with boundary layer theory. Nonetheless, the difference between the two forms is very slight and can be neglected. The form of the slurry velocity distribution can then be described by
,
where Δp is the pressure difference. The maximum value of the slurry velocity is:
.
The average velocity of the slurry, , and the flow rate of the slurry, q, are, respectively
,
.
A fracture path was uncovered by means of hand excavation to investigate the fracture propagation (Fig. 9). The geometric parameters of the fracture surface shape can be obtained from the figures, i.e., when the fracture reaches 2 m below the ground surface, as shown in Fig. 9. The width of the fracture was 0.35 m, the length was 3.6 m, and the height was 3.0 m. The average fracture aperture was 1.1 mm.
The parameters of the stratum are obtained from field or laboratory tests, including the lateral pressure coefficient of 0.6, the bulk density of 18.0 kN/m3, the friction angle of 15.6°, and the cohesion of 12.1 kPa in the total stress. The bulk density of the slurry is 10.2 kN/m3, and the coefficient of the kinematic viscosity of the slurry is between 10 and 30 MPa·s (Zhao, 2012). The driving pressure of 73.52 kPa during this time can be obtained with Eqs. (18), (20), (21), and (22) by using all of the aforementioned parameters.
The driving pressures at the other depths can also be obtained using the same method, as can the fracturing pressures at the tip of the fracture. These calculated values were then compared with measured values (Fig. 23). The differences between the calculated and measured values increase with the amount of fracturing propagation. This increasing difference may be connected with the assumption that the fracture surface was planar while it was actually very rough. A roughness coefficient must be introduced, and thus, Eq. (18) was modified as Eq. (23). Eq. (23) provides a fairly good prediction when the roughness coefficient α equals 20 (Fig. 24). The value of α contains the modification of the apertures because the values of the apertures were residual. The water heads and viscous resistances of the slurry increase during the fracture propagation, whereas the fracturing pressures at the fracture tip decrease (Fig. 24).
.
Fig.23 Comparison of the calculated and measured values of the fracturing propagation of the A3 hole
Fig.24 Comparison of the modified and measured values of the fracturing propagation of the A3 hole
The depths of the A2 and A1 holes were 10 and 15 m, respectively. The fracturing propagation in these holes was analyzed using the same method, given that α=30 for the A2 hole and α=40 for the A1 hole. The predictions correspond well with the measured values (Figs. 25 and 26). However, the predictions obtained with Eq. (23) are initially larger and then smaller than the actual fracturing propagation. One reason for this observation may be that the lateral pressure coefficient (K0) becomes large when close to the ground surface, whereas the same value is used for the prediction. More branches of the fracturing path may also occur that hold the fracture, especially at 15 m (Fig. 26).
Fig.25 Comparison of the modified and measured values of the fracturing propagation for the A2 hole
Fig.26 Comparison of the modified and measured values of the fracturing propagation for the A1 hole
Eq. (23) suggests that the driving pressure is composed of the fracturing pressure, the water head of the slurry, and the viscous resistance of the slurry. The driving pressure interacts with the soil properties, such as the bulk density, friction angle, cohesion, and lateral pressure coefficient, as well as the slurry properties, such as the bulk density and viscosity. These parameters were varied in the possible ranges to analyze their influence on the driving pressure (Table 3). The geometry of the fracture was also considered a parameter for the calculation; the fracture dimensions (an aperture of 1.1 mm, a fracture length of 12 m, and a fracture width of 0.7 m) were used for a sensitivity analysis. However, the width of the fracture varied linearly with the depth from 0.7 m at the ground surface to 0.0 m at the bottom of the hole.
Table 3
Factors of influence and series of calculations
Series
Bulk density of soil, γ (kN/m3)
Coefficient of lateral pressure, K0
Friction angle, φ (°)
Cohesion, C (kPa)
Bulk density of slurry, γs (kN/m3)
Coefficient of kinematic viscosity of slurry, ν (m2/s)
1
15
0.6
15
10
11
2×10⁻⁵
17
19
2
17
0.4
15
10
11
2×10⁻⁵
0.6
0.8
3
17
0.6
10
10
11
2×10⁻⁵
15
20
4
17
0.6
15
5
11
2×10⁻⁵
10
15
5
17
0.6
15
10
10
2×10⁻⁵
11
12
13
6
17
0.6
15
10
11
1×10⁻⁵
2×10⁻⁵
3×10⁻⁵
The calculations in Table 3 indicate that the soil properties affect only the fracturing pressure. The fracturing pressure is sensitive to certain parameters, such as the bulk density, friction angle, and lateral pressure coefficient, but not to others, such as the cohesion (Figs. 27a–27d). The driving pressures become smaller with the fracturing propagation for soils with large parameters, such as the bulk density and friction angle. Therefore, slurry fracturing will continue, as it occurs in soils with large parameter values.
The slurry properties affect both the water head and viscous resistance of the slurry. They are both sensitive to the bulk density of the slurry (Fig. 27e), whereas only the viscous resistance is sensitive to the coefficient of kinematic viscosity of the slurry (Fig. 27f). The driving pressures become greater as the bulk density and kinematic viscosity coefficient of the slurry increase. Thus, it is possible that the slurry fracturing will continue for the slurry with large parameters if the driving pressure does not further increase once slurry fracturing occurs.
Fig.27 Sensitivity analysis of parameters for driving pressure (a) Bulk density of soil; (b) Lateral pressure coefficient of soil; (c) Friction angle of soil; (d) Cohesion of soil; (e) Bulk density of slurry; (f) Viscosity of slurry
Some fractures will remain open but not propagate if the driving pressure is held constant, whereas others will continue at a constant pressure. These phenomena, observed by Murdoch (1992a; 1993b; 1993c) in the laboratory, can be explained by the mechanical model of fracture propagation. Whether they continue or not is determined by the relative relationship between the slurry and soil properties. It is possible that slurry fracturing will be contained for a slurry with large physical parameters in a soil with small strength parameters. Otherwise, the slurry fracturing will continue.
4.3. Project application
Slurry breakout occurred during the shield excavation of the Second Heinenoord Tunnel in the Netherlands (Bezuijen and Brassinga, 2006). The support pressure of 450 kPa suddenly dropped to 280 kPa after the slurry breakout. Efforts were made to restore support pressure by pumping bentonite, but these efforts were not successful and the support pressure dropped to 260 kPa. Thus, the measures used to maintain the support pressure after a slurry breakout led only to the slurry rushing out. This result can be easily understood through a fracture propagation model with the value of 0.0 for the fracturing pressure at the fracture tip. Because the stratum was fractured as a whole, the ability to seal the stratum was lost. Consequently, the support pressure must not be increased quickly after the slurry fracturing occurs; rapid increases in the support pressure actually lead to increased fracture propagation, accelerating the slurry breakout. The two phenomena are different. The former is easy to address, whereas the latter often causes engineering accidents, such as face collapse and water infiltration.
Therefore, it is important to prevent slurry fracturing and particularly to prevent it from developing into a slurry breakout, although this development can occur very easily in the above analysis. Once slurry fracturing occurs, tunneling should be implemented carefully. Such measures as tunneling at a higher speed and maintaining a low support pressure (only greater than the pore water pressure) can be employed. The through of the shield can lead to erosion of the fracture path, and thus prevent slurry breakout. However, these measures are also dangerous and not easily implemented. Thus, the best way to prevent slurry breakout is to prevent slurry fracturing. There are several measures that can be taken to prevent slurry fracturing during shield excavation:
The soft stratum can be reinforced to improve its anti-fracturing abilities.
Given that the properties of a soft stratum cannot be easily changed, slurries with high bulk density and viscosity can be prepared beforehand for shield excavating in an easily fractured soft stratum.
The maximum support pressure should be limited. The slurry pressure is typically set in the center of the shield, i.e., the support pressure (P0). The slurry pressure in the crown of the shield is the cut pressure (Pc). The relationship between the cut pressure and support pressure can be expressed as
,
where D is the diameter of the shield.
The slurry will fracture the stratum and erupt out of it if the cut pressure Pc exceeds the initial fracturing pressure Pf (Fig. 28). h1 is the vertical distance from the roof of the tunnel to the water surface, while h0 is calculated from the center of the tunnel. Thus, the maximum support pressure can be obtained as
.
Fig.28 Relationship between the support pressure and initial fracturing pressure
The initial fracturing pressure (Pf) can be investigated with the following methods:
Using an in-situ slurry fracturing test with the apparatus and procedures described in this study. The in-situ slurry fracturing test will not only obtain the initial fracturing pressure but will also allow for the investigation of the fracturing propagation determined by the properties of both the strata and slurry. However, the test will leave holes and steel pipes in the strata. These holes could induce slurry fracturing during a shield excavation, and the steel pipes could cause damage to the shield machine. Therefore, the steel pipe should be removed and the holes should be backfilled with cement mortar. Ideally, the in-situ test apparatus should be restored and the steel pipes should be recycled.
Using an in-situ test in the field near the tunnel to be built, as described in this study. The strata of the field for the test should be very similar to the field for the proposed tunnel. The results of the field tests should be modified by the theories described in this study. The setting values of the support pressures were supplied for the shield launching of the Weisan Road Tunnel under the Yangtze River in Nanjing. The values of 0.210 and 0.220 MPa were provided for the north and south tubes, respectively, following the in-situ tests.
If the in-situ tests cannot be performed for some reason, the initial fracturing pressure of clays can be estimated with Eq. (10). For example, the initial fracturing pressure for the shield launching the north tube of the Weisan Road Tunnel can be estimated to have a value of 0.105 MPa. This estimate is calculated with Eq. (10) using the strata parameters provided in Fig. 4 and Table 1. This value is smaller than that of 0.123 MPa obtained from the upper boundary method, which uses the pore pressure plus 1.0 times the vertical effective stress (Bezuijen and Brassinga, 2006). This result also can be verified using the test results provided in Table 3. Therefore, the upper boundary method tends to be unsafe, and slurry fracturing can easily occur in clays. The maximum support pressure should not exceed the following value:
.
5. Conclusions
When excavating a slurry shield in a shallow stratum, slurry fracturing can easily occur with shallow earth cover. In this study, an in-situ slurry fracturing apparatus was created to analyze the slurry fracturing and fracture propagation phenomena. The fracturing test procedures and a method for identifying slurry fracturing were first introduced. Mechanical models of the slurry fracturing and fracture propagation were described and verified with in-situ tests. The following conclusions can be drawn:
The driving pressure, which equals the anti-fracturing pressure of the strata, is related to the soil and slurry properties. Slurry with large bulk density and viscosity parameters is beneficial in preventing slurry fracture propagation. However, these parameters have little influence on the initial fracturing pressure in clays.
The mechanical models of slurry fracturing and fracture propagation provide fairly accurate predictions.
Measures preventing slurry fracturing and breakout are offered not only for preparation of a shield tunnel, but also for shield tunneling under dangerous conditions. The most important measure is limiting the maximum support pressure values. The maximum support pressures can be obtained from in-situ tests and the mechanical models described in this study. Slurry fracturing can easily occur in clays, and using an upper bound method may be unsafe.
The phenomenon of declining support pressure is beneficial in preventing fracture propagation when slurry fracturing occurs. The support pressure must not be immediately increased once fracturing occurs. Increasing the support pressure will lead only to further fracture propagation and hasten a slurry breakout.
[1] Alfaro, M.C., Wong, R.C.K., 2001. Laboratory studies on fracturing of low-permeability soils. Canadian Geotechnical Journal, 38(2):303-315.
[2] Atkin, R.J., Fox, N., 2011. An Introduction to the Theory of Elasticity. Dover Publications Inc.,New York :
[3] Bezuijen, A., Brassinga, H.E., 2006. Blow-out pressures measured in a centrifuge model and in the field. Tunnelling: A Decade of Progress: GeoDelft 1995-2005, Taylor & Francis,:143-148.
[4] Bezuijen, A., Sanders, M.P.M., Hamer, D.D., 2007. Laboratory tests on compensation grouting, the influence of grout bleeding. Underground Space-the 4th Dimension of Metropolises. Taylor & Francis,London, Britain :395-401.
[5] Boyce, G., Wolski, M., Zavitz, R., 2011. Chemistry and physics behind microtunnel slurries. North American Society for Trenchless Technology,Washington, DC :1-10.
[7] Falk, C., 1998. Pre-investigation of the subsoil developments in construction of the 4th Elbe Tunnel Tube. Tunnelling and Underground Space Technology, 13(2):111-119.
[8] Maidl, B., Herrenknecht, M., Maidl, U., 2012. Mechanised Shield Tunneling. Ernst & Sohn,Berlin :
[9] Mori, A., Tamura, M., 1987. Hydrofracturing pressure of cohesive soils. Soils and Foundations, 27(1):14-22.
[10] Mori, A., Tamura, M., Fukui, Y., 1990. Fracturing pressure of soil ground by viscous materials. Soils and Foundations, 30(3):129-136.
[11] Munson, B.R., Young, D.F., Okiishi, T.H., 2012. Fundamentals of Fluid Mechanics. Wiley,New York :
[12] Murdoch, L.C., 1992. Hydraulic fracturing of soil during laboratory experiments, Part 1. Methods and observations. Geotechnique, 43(2):255-265.
[13] Murdoch, L.C., 1993. Hydraulic fracturing of soil during laboratory experiments, Part 2. Propagation. Geotechnique, 43(2):267-276.
[14] Murdoch, L.C., 1993. Hydraulic fracturing of soil during laboratory experiments, Part 3. Theoretion. Geotechnique, 43(2):277-287.
[15] Panah, A.K., Yanagisawa, E., 1989. Laboratory studies on hydraulic fracturing criteria in soil. Soils and Foundations, 29(4):14-22.


Open peer comments: Debate/Discuss/Question/Opinion
<1>