1. Introduction
The wide applications of nanoparticles (NPs) are due to their small size and high surface activity, which also causes potential threats to human health (Nel et al.,
2006). Oxide NPs are an important group of engineered nanomaterials; it has been reported that NPs can penetrate the cell wall and cell membrane, enter the cells, and cause toxicity in organisms (Brunner et al.,
2006; Xia et al.,
2006). Therefore, the transport of NPs in nature has become a very important environmental issue.
While different from the studies of dissolved chemicals, particle agglomeration and sedimentation must also be considered when we examine the NP transport in the natural environment, or study its toxicity in biological systems. In natural aqueous media, large NP agglomerates will deposit faster than single particles due to their gravity, and will be blocked easily while transporting into a porous media (Chen and Elimelech,
2007; Ghosh et al.,
2008; Petosa et al.,
2010). NPs interact with natural organic matter (NOM) under various chemical solutions, which controls the agglomeration of NPs, as well as their attachment to environmental surfaces (Keller et al.,
2010). NOMs include humic substances, which either prevent NP agglomeration and favor NP transport due to steric effects and electrostatic effects (Chowdhury et al.,
2012), or induce NP agglomeration due to gel bridging (Chae et al.,
2012). In biological systems, particle agglomeration and the rate of particle sedimentation are relevant when evaluating the potential toxicity of NPs (Limbach et al.,
2005). It has been reported that the faster the particles are deposited, the more likely they will interact with cells (Hsiao and Huang,
2013), and therefore increase the risk of toxic side effects. In the biological media, NPs interact with various varieties of biomolecules, such as proteins. Serum albumin is the most abundant protein component in blood plasma. Bovine serum albumin (BSA) is often selected as a model protein to study nanoparticle-protein interactions, because it shares 98% of its amino acid sequence with its human variant (Dominguez-Medina et al.,
2013).
NP agglomerates deposit faster than single particles due to their increased gravitational sedimentation and decreased Brownian diffusion (Abel et al.,
1994; Petosa et al.,
2010). This rule fits the homogeneous agglomerates (NPs agglomerate with each other). However, it is unclear for heterogeneous NP agglomerates that form together with organic matters or biomolecules. The colloidal sedimentation is a complicated process, and is related to several physicochemical processes, including gravitation, clustering, diffusion, viscosity, etc. (Abel et al.,
1994; Buzzaccaro et al.,
2008). In addition, the metallic cations in the media interact with carboxylic, phenolic, carbonyl, quinone, aromatic, acetal, heteroaliphatic, aliphatic, and amino functional groups in NOMs or biomolecules (Akaighe et al.,
2012), which may affect the NP agglomeration and sedimentation. The relationship between NP agglomeration and sedimentation needs further evaluation, especially in the presence of organic matters or biomolecules. Therefore, in this study we try to compare the relationships between NP’s hydrodynamic diameter (
d
H) and its sedimentation rate in monovalent and divalent electrolytes, respectively, and compare the effects of BSA and humic acid (HA) treatments. This study is important for predicting the stability and transport of NPs in aqueous media.
2. Materials and methods
2.1. Materials
Three oxide NPs (Al
2O
3, SiO
2, and TiO
2) were purchased from Zhejiang Hongsheng Material Technology Co., China. The purity and diameters of the NPs were provided by the manufacturer. The NP’s surface areas (
S
BET) were measured by the multi-point Brunauer-Emett-Teller (BET) method, which are listed in Table
1. Stock NP suspensions were prepared by adding NP powders into deionized (DI) water, and followed by using a sonication bath. At first, NP suspensions were diluted to their desired concentrations by using NaCl or CaCl
2 electrolyte, and then were sonicated for 30 min. Commercial HA was purchased from Aladdin Reagent, which was extracted by NaOH from the leonardite. BSA was purchased from Sigma-Aldrich and was utilized as purchased.
Table 1
Properties of the examined oxide nanoparticles
| Particles |
Crystal |
Purity |
Primary size (nm) |
S
BET (m2/g) |
ζ at pH 6 (mV)
|
|
ζ
Na
|
ζ
Ca
|
| Al2O3
|
γ form |
≥99.9% |
60±5 |
208 |
35 |
37 |
| SiO2
|
Porous form |
≥98% |
20–50 |
675 |
−7 |
−5 |
| TiO2
|
Anatase form |
≥99% |
5–10 |
324 |
5 |
11 |
ζ: zeta potential; ζ
Na: zeta potential in 0.05 mol/L NaCl; ζ
Ca: zeta potential in 0.05 mol/L CaCl2
To prepare the BSA/HA-treated NPs, an NP suspension was shaken together with large amounts of BSA/HA in DI water for 24 h, then the supernatant was removed after centrifugation. The particles were washed twice by NaCl or CaCl
2 electrolyte to remove the unadsorbed BSA/HA residues. The adsorption amounts of BSA on Al
2O
3, SiO
2, and TiO
2 NPs are 297, 93.4, and 213 mg/g, and the adsorption amounts of HA on Al
2O
3, SiO
2, and TiO
2 NPs are 86.8, 9.4, and 110 mg/g, respectively.
2.2. Characterization of HA
The C, H, O, N, and S contents of the HA were measured by an Elementar Vario EI III elemental analyzer (Germany). The ash content was measured by heating the samples at 800 °C for 4 h. The solid-state
13C nuclear magnetic resonance (NMR) spectroscopy analysis was performed to characterize the structural composition of the commercial HA on a Bruker AV300 Solid NMR spectrometer (Karlsruhe, Germany). The NMR spectrum was acquired at
13C frequency of 75 MHz. The NMR running parameters were as follows: spinning rate, 12 kHz; contact time, 3.5 ms; recycle delay time, 5 s; line broadening, 100 Hz.
2.3. Transmission electron microscope (TEM) imaging
The concentrations of Al
2O
3, SiO
2, and TiO
2 NP suspensions were adjusted to 100, 100, and 50 mg/L, respectively for sample making. After a 30-min sonication, a tiny drop of NP suspension was placed on a copper mesh grid, dried under an infrared lamp in a dust-free environment, and imaged through a JEM-1011 TEM at an electron emission of 100 kV. The images of the BSA-/HA-treated NPs were compared with untreated NPs.
2.4. Zeta potential measurements
The zeta potential of the tested NPs were measured in 0.05 mol/L NaCl and CaCl
2, respectively, using Zetasizer (Nano ZS90, Malvern Instruments Ltd., UK). The concentrations of Al
2O
3, SiO
2, and TiO
2 NP suspensions were 200, 200, and 50 mg/L, respectively. Before the measurement, the NP suspensions were adjusted to gradient pH values from 3 to 10 and sonicated for 30 min for better dispersion.
2.5. Measurements of hydrodynamic diameters
Hydrodynamic diameters (
d
H) of the tested NPs were measured through dynamic light scattering (DLS) at pH 6 in 0.05 mol/L NaCl and CaCl
2, respectively, which were also conducted by the Malvern Zetasizer. Al
2O
3, SiO
2, and TiO
2 NP suspensions were 200, 600, and 50 mg/L, respectively. The NP suspensions were sonicated for 30 min before conducting the DLS measurement.
2.6. Sedimentation study
The sedimentation curve was obtained by monitoring the optical absorbance at 800 nm during a time interval of 3 h by a UV-vis spectrophotometer (TU-1900, Beijing Persee General Instrument Co., Ltd.). BSA or HA did not have any absorbance at 800 nm. The Al
2O
3, SiO
2, and TiO
2 NP suspensions were 200, 600, and 50 mg/L, respectively, and were adjusted to pH 6 in 0.01, 0.05, 0.1 mol/L NaCl or CaCl
2 electrolyte for absorbance scans. All measurements were made in square cuvettes with a 1-cm light bath and a 3-ml NP suspension. The center of the light beam struck the cuvette 1.5 cm above its bottom, which was almost in the middle of the whole bulk solution. The scan started (time 0) right after a 30-min sonication. The absorbance intensity (
A) as a function of time was divided by the initial intensity (
A
0) to obtain the modified sedimentation curve.
3. Results and discussion
3.1. Structural characterization of the commercial HA
The C, H, O, N, S, and ash mass percent contents of the HA were 40.2%, 3.76%, 49.1%, 0.99%, 0.86%, and 21.7%, respectively. The elemental contents were in the scope of the reported extracted natural HAs (Sun et al.,
2013).
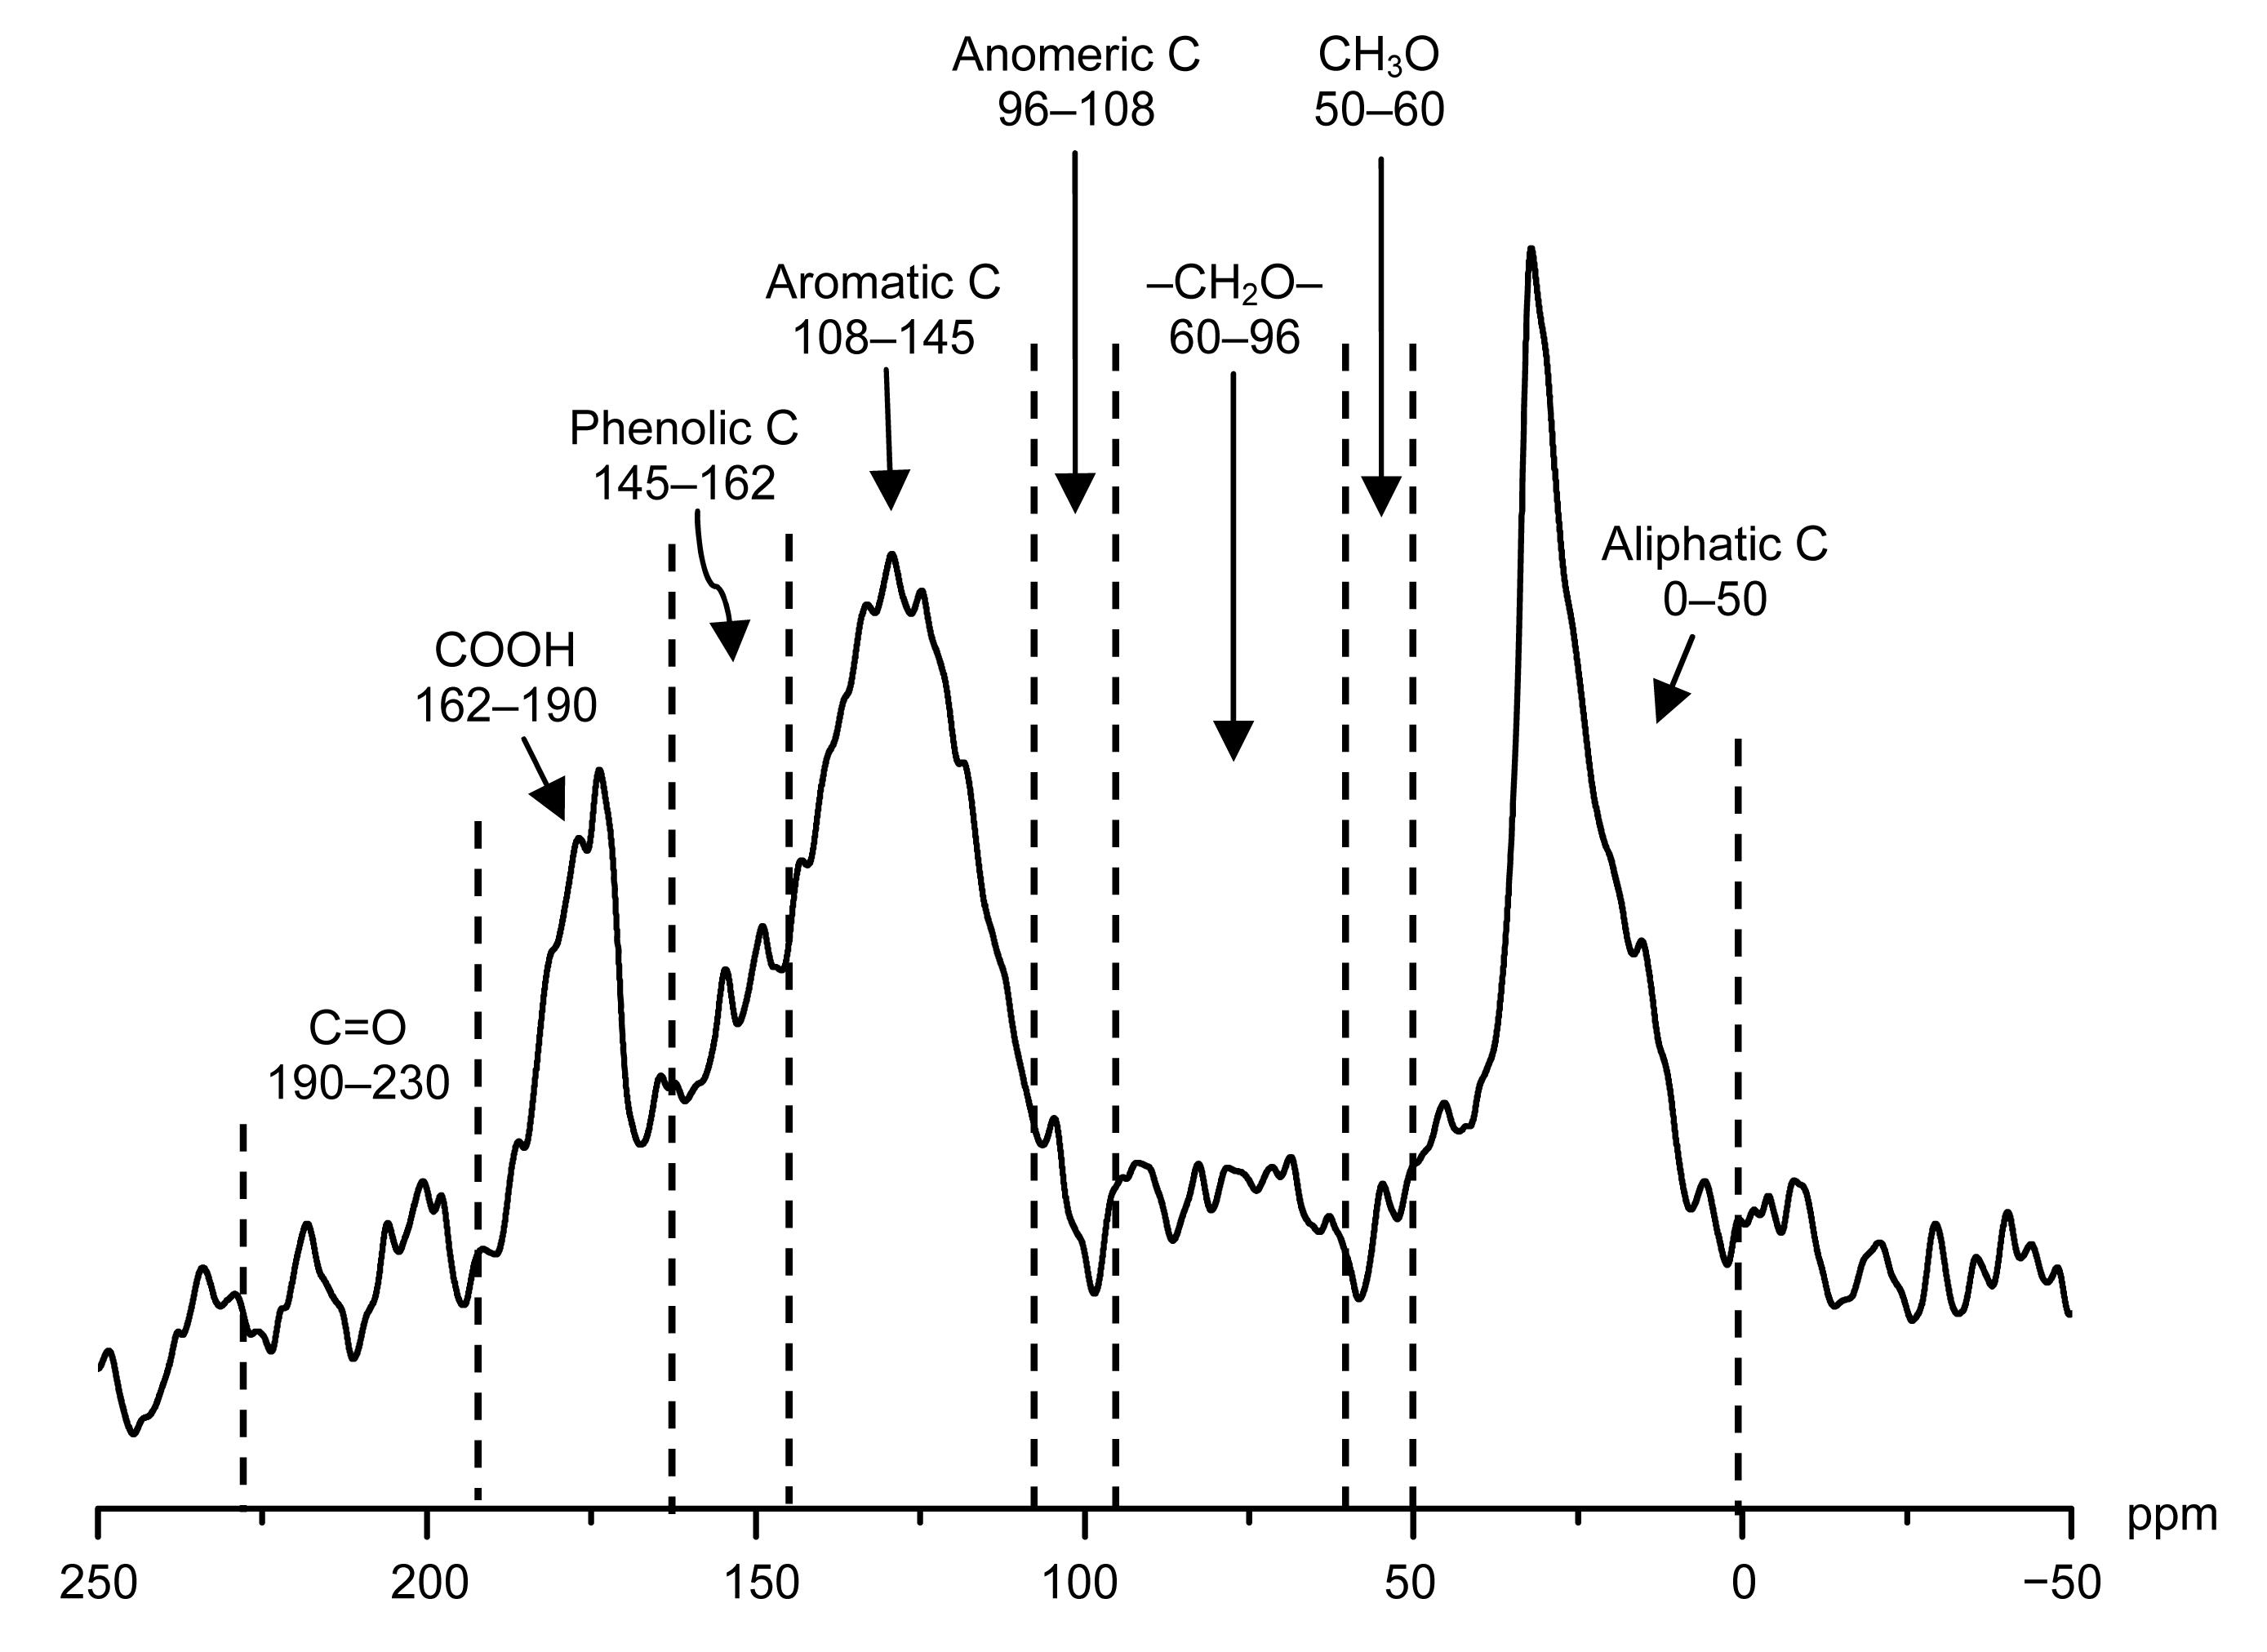
The spectra of the
13C NMR analysis of the HA appears in Fig.
1. The
13C NMR data show a quantitative distribution for different carbon moieties in the HA. The chemical shift assignments are depicted elsewhere: 0–50 ppm (ppm=10
−6), mainly aliphatic or paraffinic carbons; 50–60 ppm, methoxy groups; 60–96 ppm, –CH
2O–groups; 96–108 ppm, anomeric groups; 108–145 ppm, aromatic groups; 145–162 ppm, phenolic groups; 162–190 ppm, carboxylic groups; and 190–230 ppm, non carboxylic carbonyl groups (Malcolm and MacCarthy,
1986; Kang and Xing,
2008). The integration results of the HA carbon distributions are listed in Table
2, which is similar to the reported peat and leonardite HA results (Malcolm and MacCarthy,
1986). The HA tested contains a high content of aromatic groups and carboxylic groups, and its aromaticity is 47.92%.
Fig.1
Solid-state 13C NMR spectrum for the HA
Table 2
Integration results of the solid state 13C NMR spectra of HA
| C chemical shift |
Distribution (%) |
| 0–50 ppm |
29.61 |
| 50–60 ppm |
1.86 |
| 60–96 ppm |
8.47 |
| 96–108 ppm |
2.71 |
| 108–145 ppm |
30.97 |
| 145–162 ppm |
8.28 |
| 162–190 ppm |
13.37 |
| 190–230 ppm |
4.73 |
|
| Aliphatic C |
42.65 |
| Aromatic C |
39.25 |
| Aliphaticity |
52.08 |
| Aromaticity |
47.92 |
Aliphatic C: total aliphatic carbon region (0–108 ppm); aromatic C: total aromatic carbon region (108–162 ppm); aliphaticity: aliphatic C (0–108 ppm)/sum of aliphatic C and aromatic C (0–162 ppm); aromaticity: aliphatic C (108–162 ppm)/sum of aliphatic C and aromatic C (0–162 ppm)
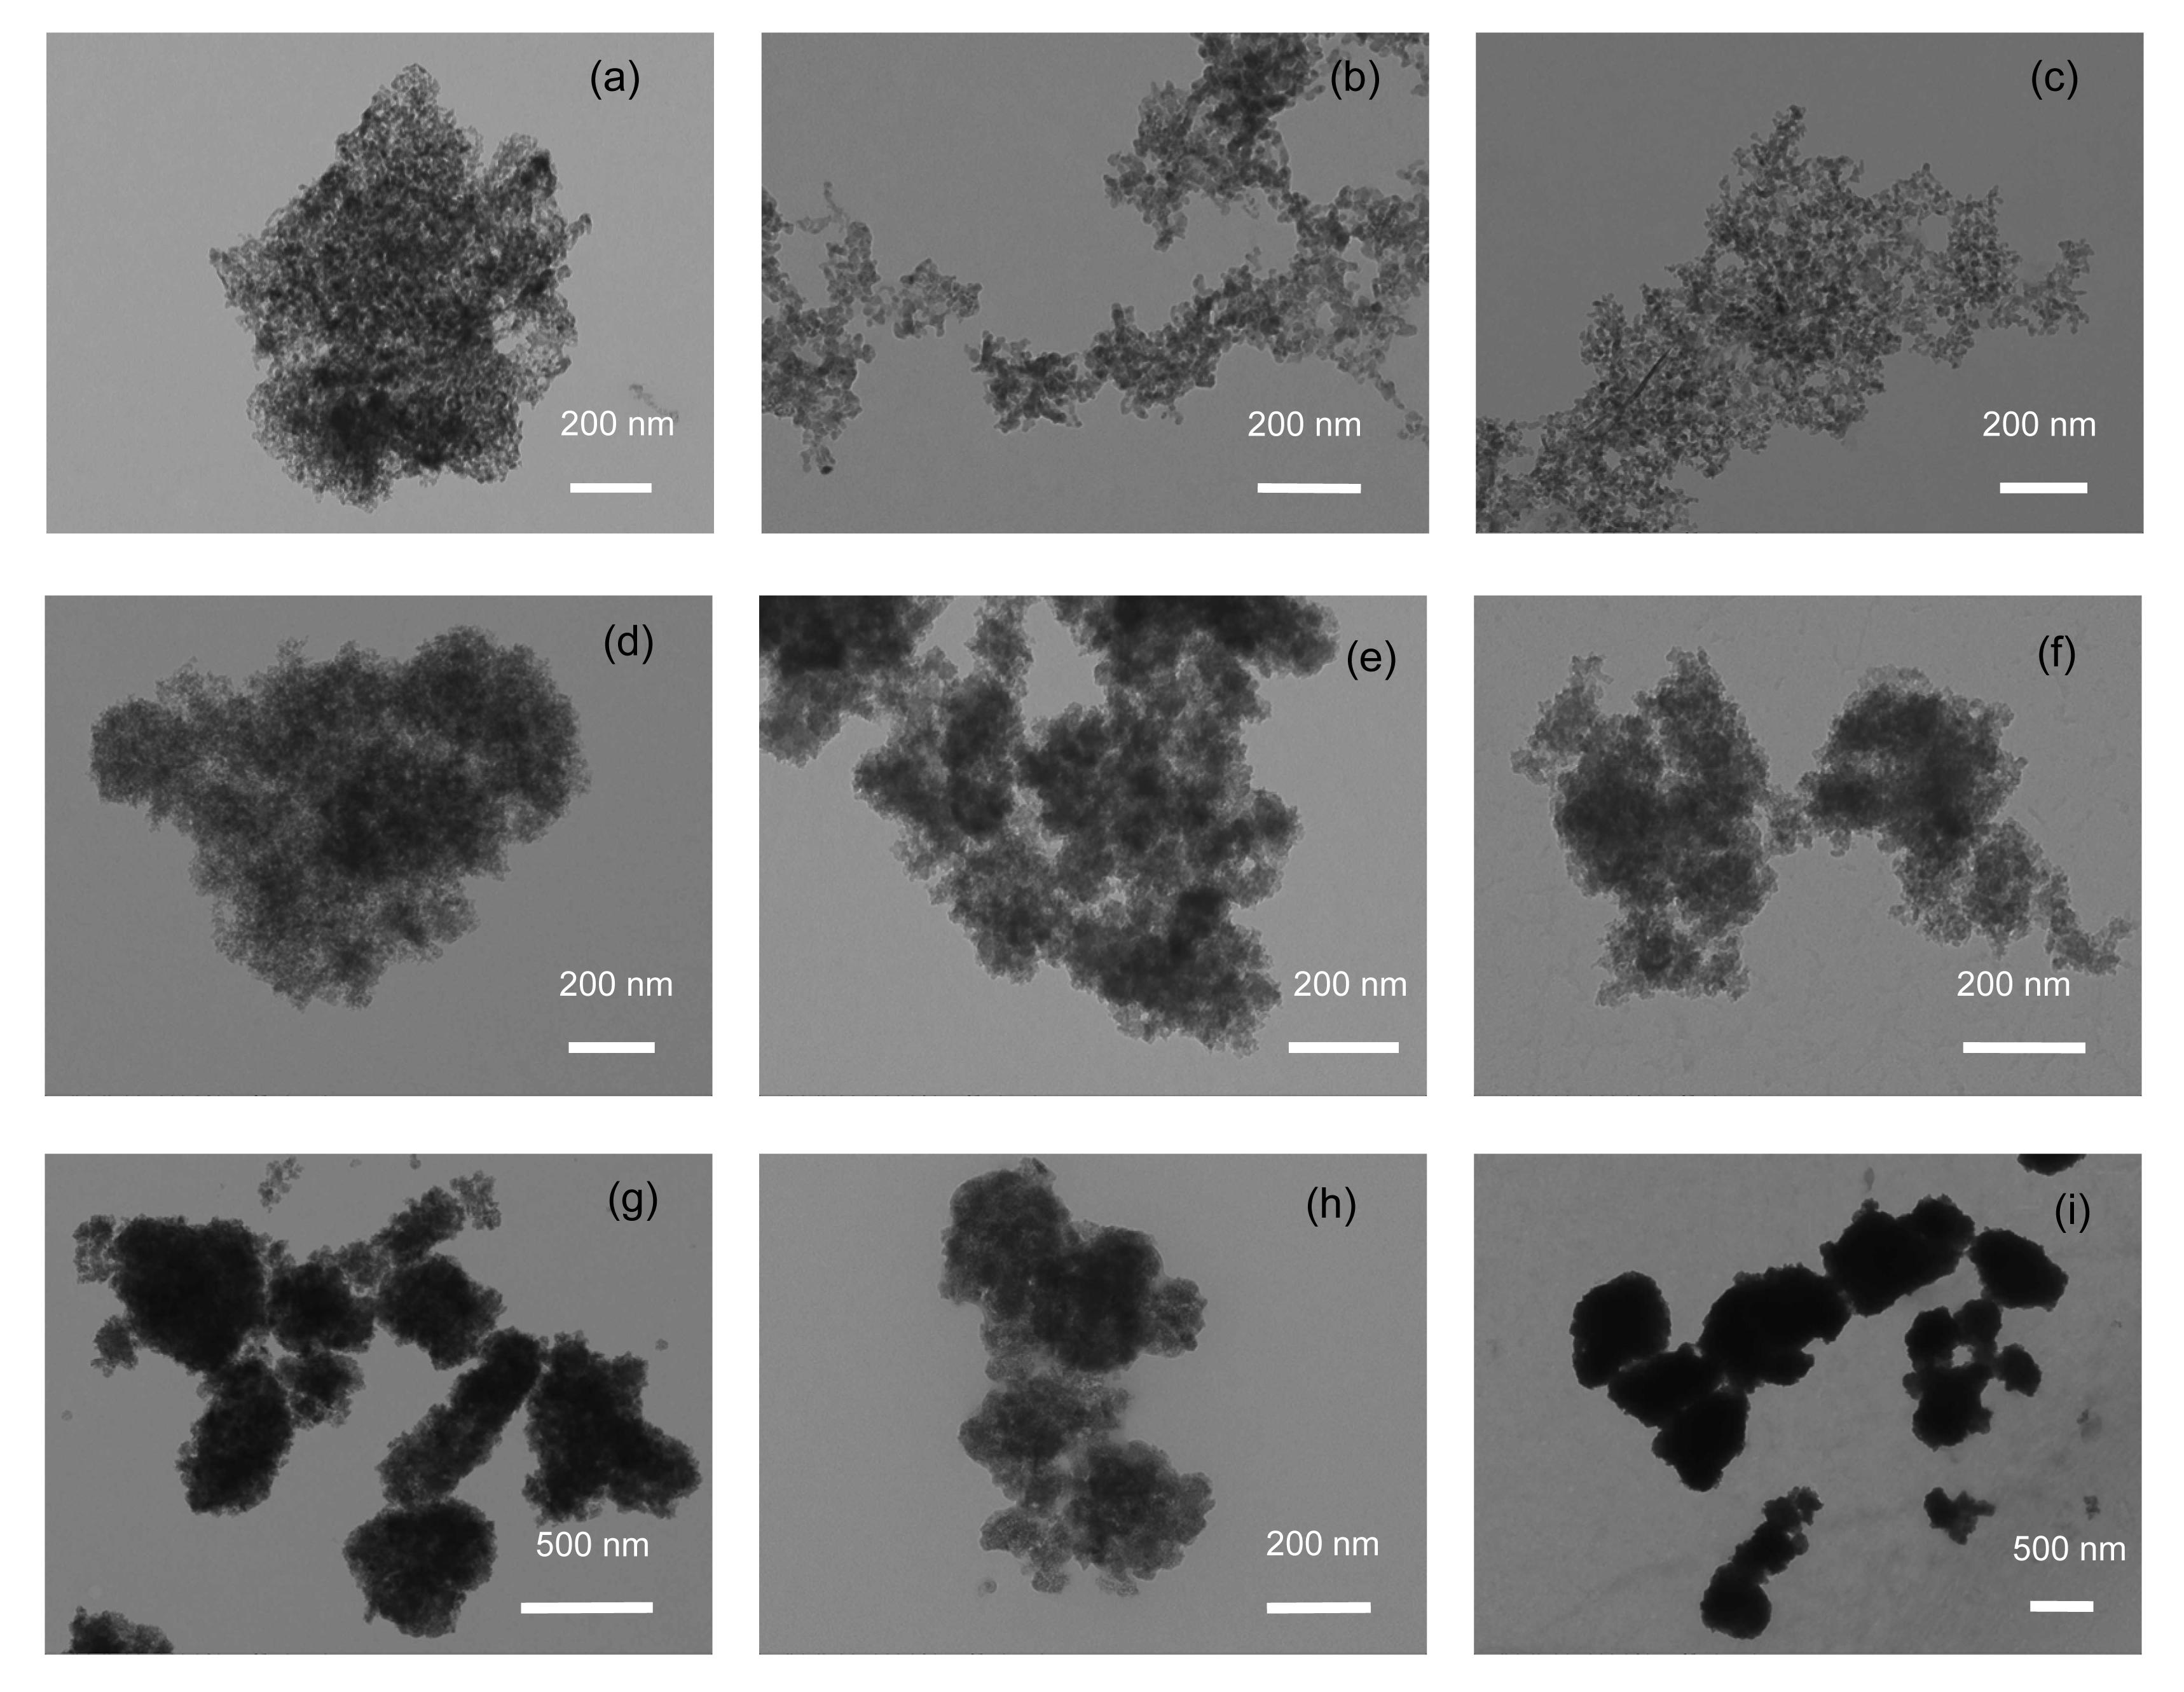
3.2. Effects of BSA and HA on NPs agglomeration observed by TEM imaging
Three NPs appear as agglomerates when they are dried on TEM grids (Fig.
2). After BSA/HA treatment, the Al
2O
3 NPs obviously show better dispersion when compared with the untreated NPs, but the SiO
2 NPs look very similar to the untreated NPs. The TiO
2 NPs were reported as tending to form large and compact agglomerates (Jiang et al.,
2009; Keller et al.,
2010). BSA treatments make TiO
2 NPs less compact and the BSA coatings on the NPs agglomerates can be observed, but HA induces more compact agglomerates. The effects of electrolytes on NPs agglomeration cannot be studied through TEM imaging because the electrolytes are condensed during the drying process. The TEM imaging is not an
in-situ observation and provides limited information.
Fig.2
TEM images for Al2O3, SiO2, and TiO2 NPs and BSA-/HA-treated NPs
(a) Al2O3 NPs; (b) BSA-treated Al2O3 NPs; (c) HA-treated Al2O3 NPs; (d) SiO2 NPs; (e) BSA-treated SiO2 NPs; (f) HA-treated SiO2 NPs; (g) TiO2 NPs; (f) BSA-treated TiO2 NPs; (g) HA-treated TiO2 NPs. Samples are dried in DI water
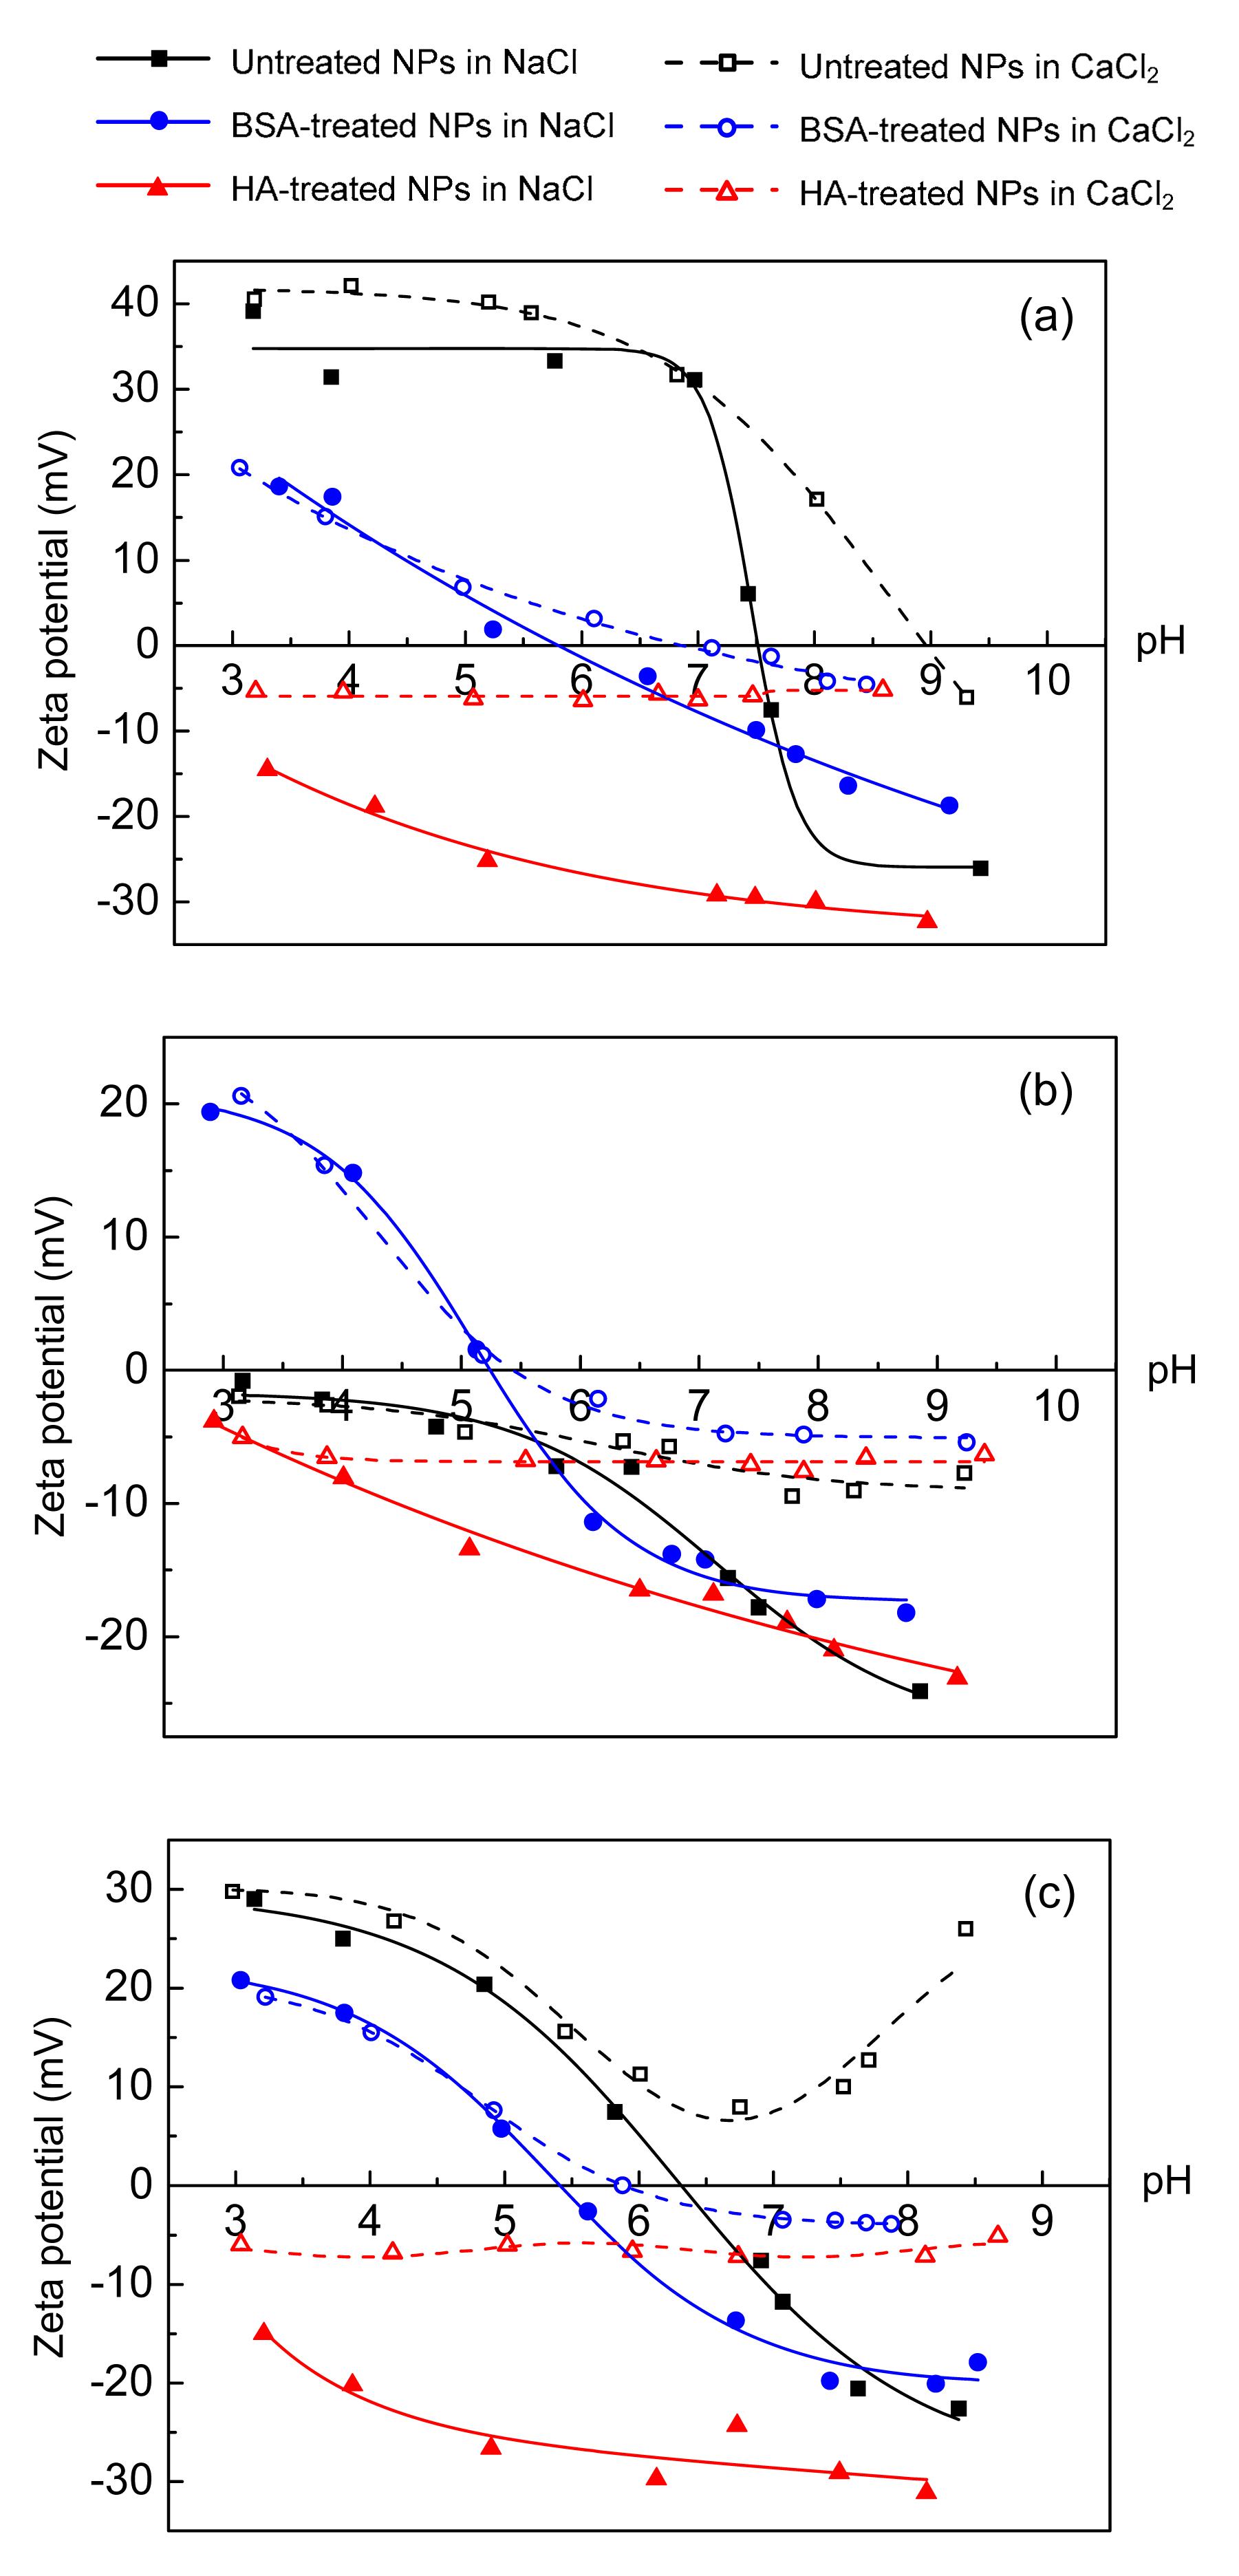
3.3. Effects of BSA/HA treatments on the zeta potentials of NPs
The zeta potentials of Al
2O
3, SiO
2, and TiO
2 NPs are measured in 0.05 mol/L NaCl and CaCl
2, respectively (Fig.
3). In NaCl, the three BSA-treated NPs show similar zeta potential curves and their points of zero charge (PZC) are between 5 and 6, which reflects the effects of the BSA coatings. Their curves in NaCl and CaCl
2 electrolytes are similar at pH<5. However, at pH>5 their zeta potentials in CaCl
2 are higher than those in NaCl electrolyte. The zeta potentials in CaCl
2 are higher than those in NaCl in the alkaline pH region for untreated- and HA-treated NPs. Calcium induces higher zeta potentials of NPs than sodium because Ca
2+ neutralizes the negatively-charged BSA/HA counter-ions in the inner Helmholtz plane (Akaighe et al.,
2012). In NaCl electrolyte, HA coatings cause HA-treated NPs to be highly negatively-charged in the entire measured pH region. The increased HA coatings were reported to gradually decrease the charges of HA-coated oxide NPs, and finally approached the zeta potential of the HAs (Yang et al.,
2009). This indicates that HA coatings dominate the charges of HA-coated NPs. However, in CaCl
2 electrolyte, the zeta potentials of HA-treated NPs are around −6 mV, and do not decrease when the pH increases. The weak negative charges are consistent with the reported zeta potential of HA-treated Al
2O
3 NPs in 0.05 mol/L CaCl
2 (Ghosh et al.,
2010). Although the zeta potential curves of the three untreated-NPs are quite different, the curves of BSA-/HA-treated NPs show some similarity and reflect features of the BSA/HA coatings.
Fig.3
Zeta potentials of untreated NPs, BSA-treated NPs, and HA-treated NPs in 0.05 mol/L NaCl or CaCl2 electrolyte
(a) Al2O3; (b) SiO2; (c) TiO2
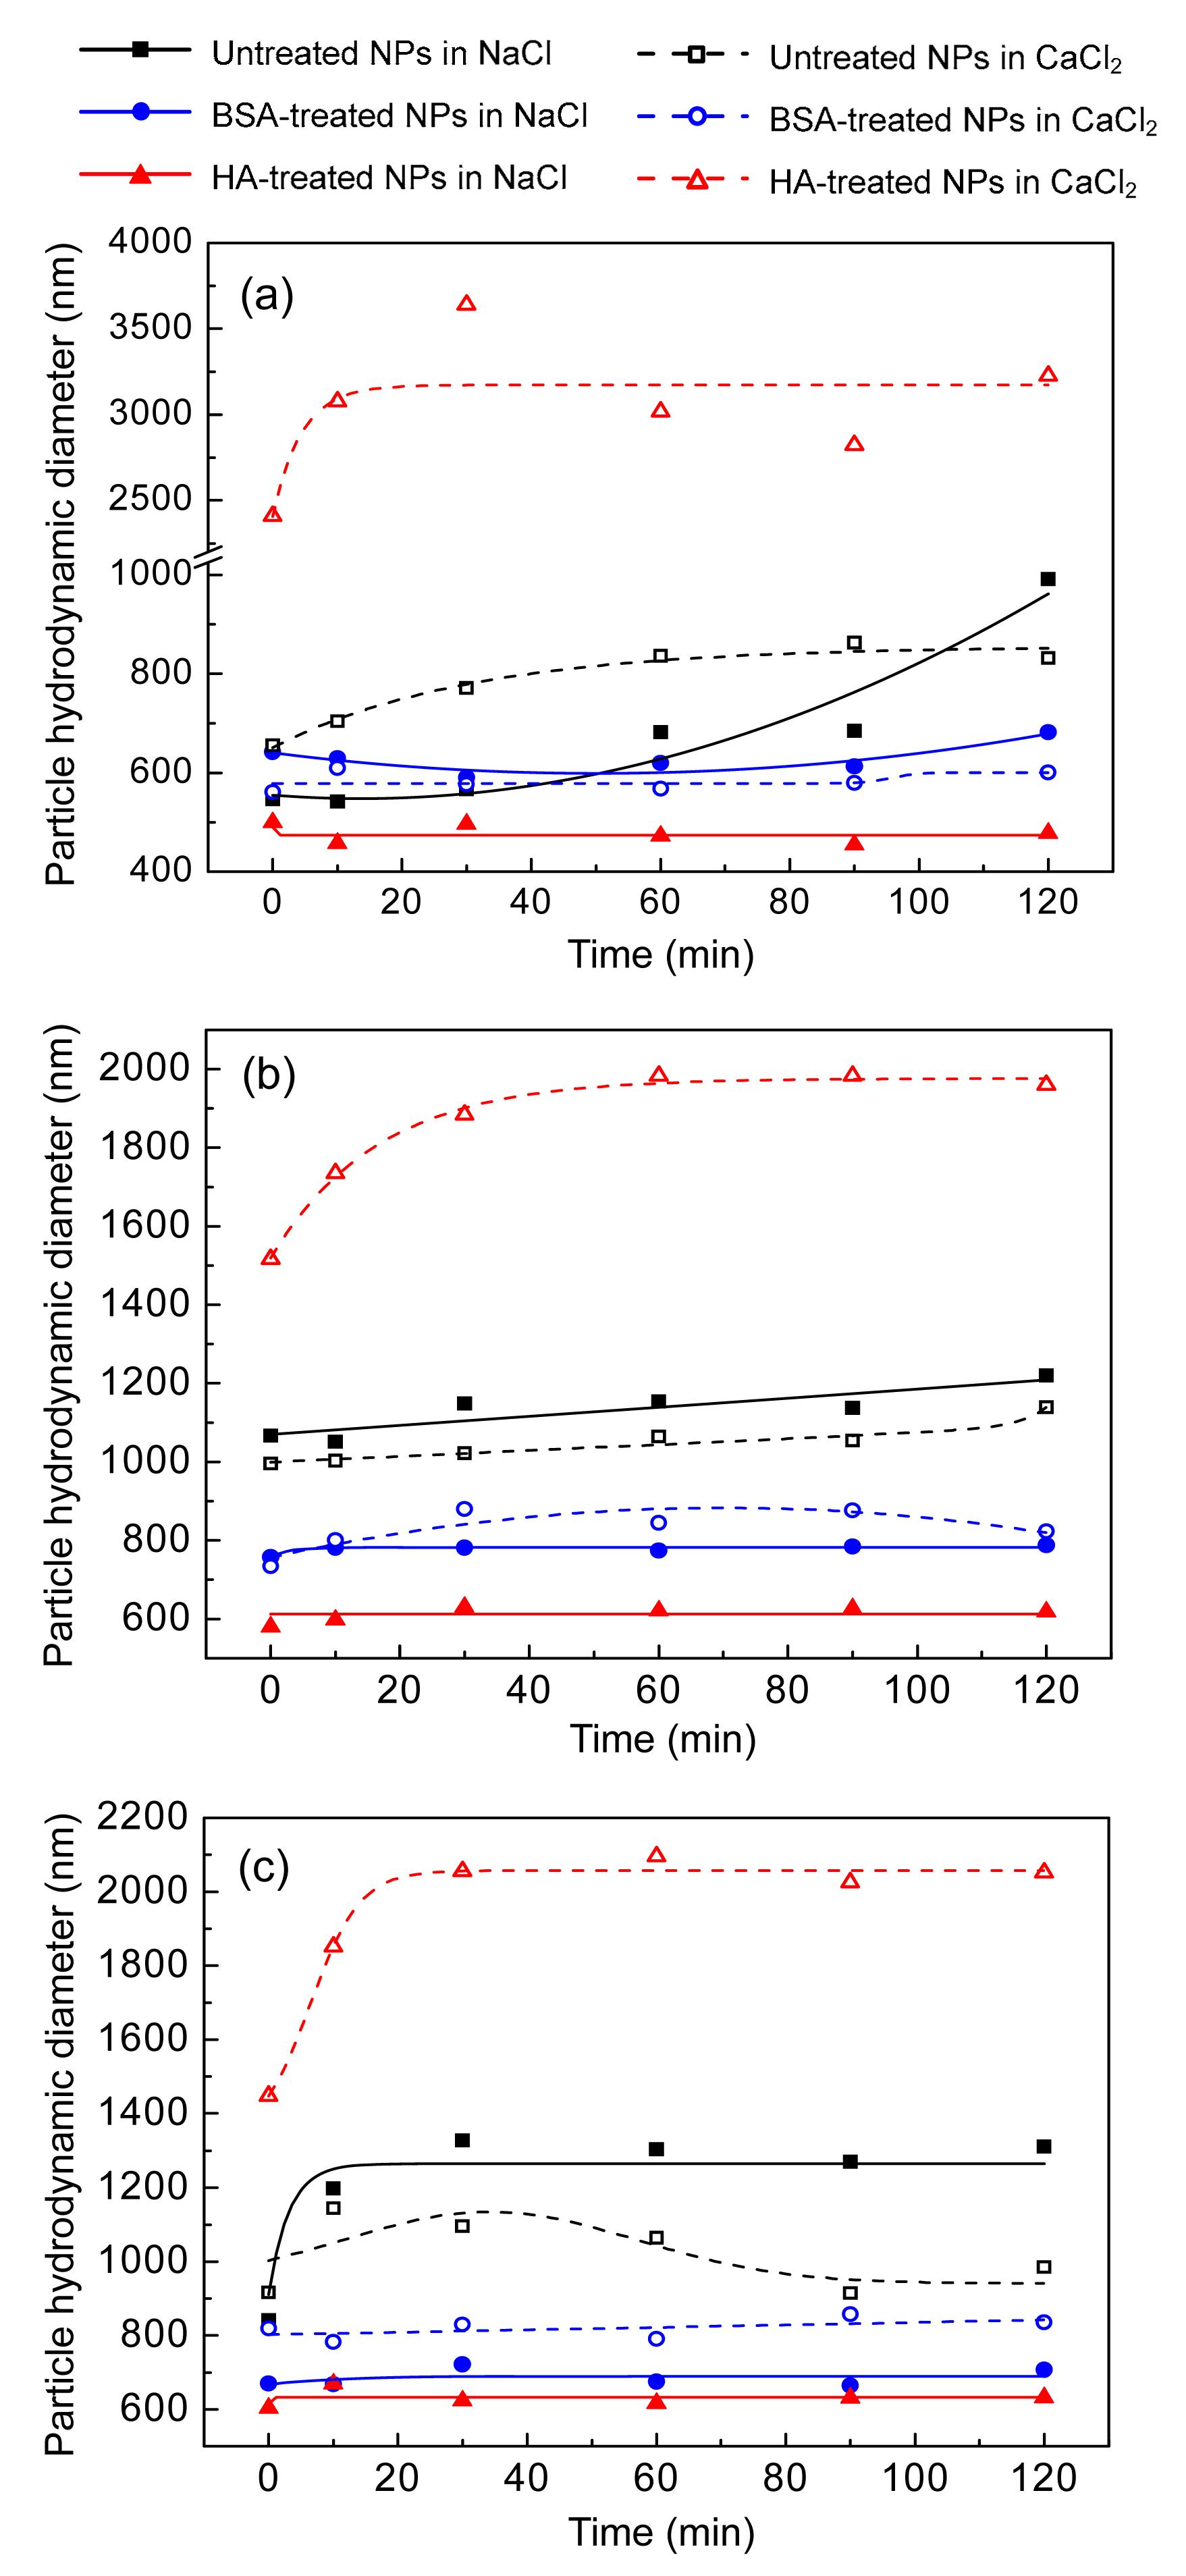
3.4. Change in hydrodynamic diameter of NP after BSA/HA treatment
The
d
H values of the tested NPs are much higher than their primary particle diameters as reported by the manufacturer (Table
1), indicating their agglomeration in aqueous media. In Fig.
4, BSA-treated NPs show a smaller
d
H than untreated-NPs for all of the three NPs, which indicates that the BSA proteins can prevent NPs from agglomerating. BSA retards NP agglomeration because the globular architecture of adsorbed BSA on the NPs induces long range steric repulsive forces (Saleh et al.,
2010). In addition, albumin protein was reported to reduce the diameter of TiO
2 agglomerates by the steric stabilization mechanism (Allouni et al.,
2009).
Fig.4
Hydrodynamic diameters of Al2O3 (a), SiO2 (b), and TiO2 (c) NPs in 0.05 mol/L NaCl or CaCl2 electrolyte at pH 6
HA treatments decrease the
d
H values of Al
2O
3, SiO
2, and TiO
2 in NaCl, but greatly increase their agglomeration in CaCl
2 (Fig.
4). Ca
2+ was already reported to induce agglomeration and increase
d
H values of HA-coated Al
2O
3 NPs (Ghosh et al.,
2010), alginite-coated hematite (Chen et al.,
2006), and fullerene in the presence of HA (Chen and Elimelech,
2007). The
d
H is enlarged because HA-coated NPs bind to each other via calcium complexation between HA molecules (Chen and Elimelech,
2007).
The different
d
H values of HA-treated NPs in NaCl and CaCl
2 electrolytes may be related to the absolute values of NP surface charges. The absolute charges in NaCl are larger than those in CaCl
2 (Fig.
3), which means there are larger electrostatic repulsive forces between particles in NaCl electrolyte. Electrostatic repulsive forces may prevent NPs from agglomerating. However, BSA-treated NPs have small absolute charges (Fig.
3) and reduced agglomerate size (Fig.
4), which indicates that electrostatic repulsion is not the dominant factor for controlling NP agglomeration.
3.5. Sedimentation kinetics of NPs measured by optical absorbance
BSA and HA obviously affect NP sedimentation as shown in Fig.
5. The three NPs present different sedimentation manners. For Al
2O
3 NPs, the BSA treatment stabilizes the NP suspension and slows down the Al
2O
3 NP sedimentation in NaCl (Fig.
5a). However, in CaCl
2 electrolyte, the sedimentation rate of BSA-treated NPs is similar to untreated NPs (Fig.
5b). HA treatment increases the sedimentation rate just a little bit in NaCl electrolyte (Fig.
5a), and causes very fast sedimentation in CaCl
2 electrolyte (Fig.
5b). In summary, the sedimentation rates are as follows: HA-treated NPs>untreated NPs>BSA-treated NPs in NaCl electrolyte, and HA-treated>untreated NPs≈BSA-treated NPs in CaCl
2 electrolyte.
Fig.5
Sedimentation curves of Al2O3, SiO2, and TiO2 NPs in 0.01 mol/L, 0.05 mol/L, and 0.1 mol/L NaCl and CaCl2 electrolytes at pH 6
(a) Al2O3 in NaCl; (b) Al2O3 in CaCl2; (c) SiO2 in NaCl; (d) SiO2 in CaCl2; (e) TiO2 in NaCl; (f) TiO2 in CaCl2; the absorbance intensity at 800 nm was divided by the intensity of initial time (A/A
0); for interpretation of the references to color in this figure legend, the reader is referred to the web version of this article
The sedimentation curves for untreated SiO
2 NPs start from a stable stage, then drop very quickly at around 30 min. BSA slows down the SiO
2 sedimentation in both NaCl and CaCl
2 electrolytes (Figs.
5c and 5d), which can be explained by the decrease in their
d
H values (Fig.
4b). HA slows down the sedimentation process in NaCl electrolyte (Fig.
5c), but speeds up the sedimentation in CaCl
2 electrolyte (Fig.
5d). The sedimentation rates are as follows: untreated NPs>HA-treated NPs≈BSA-treated NPs in NaCl electrolyte, and HA-treated NPs>untreated NPs>BSA-treated NPs in CaCl
2 electrolyte.
The sedimentation curves of untreated TiO
2 NPs drop smoothly. In NaCl, both BSA and HA treatments decrease the sedimentation rates (Fig.
5e). In CaCl
2, BSA slows the TiO
2 sedimentation but HA induces a much faster sedimentation (Fig.
5f). It was reported that HA tended to stabilize the TiO
2 NPs in 0.1 mol/L NaCl electrolyte, but accelerated the sedimentation in Milli-Q water (Erhayem and Sohn,
2014). The latter result is consistent with our TEM observation that HA causes the most condensed agglomerates (Fig.
2). The sedimentation rates are as follows: untreated NPs>HA-treated NPs>BSA-treated NPs in NaCl electrolyte, and HA-treated NPs>untreated Nps>BSA-treated NPs in CaCl
2 electrolyte.
The BSA-treated NPs have the slowest sedimentation rates in both NaCl and CaCl
2 electrolytes, which indicates that the adsorbed BSA prevents NP agglomeration and sedimentation due to the steric repulsive forces. HA-treated NPs show the fastest sedimentation rates in CaCl
2 electrolyte, indicating that the calcium complexation disrupts the stability of the NP suspension. In NaCl or CaCl
2, the sedimentation rates in 0.01, 0.05, 0.1 mol/L electrolytes are similar, therefore the ionic strength does not cause any obvious differences in this study.
3.6. Relationships between NP agglomeration and sedimentation
Agglomeration and sedimentation are two closely related processes. Agglomerate usually has a larger sedimentation velocity compared to that of a single particle; therefore agglomeration can increase the sedimentation rate (Abel et al.,
1994). In this study, BSA treatments decrease the
d
H of Al
2O
3, SiO
2 and TiO
2 NPs (Fig.
4), and also slow the sedimentation rates of all three NPs. HA causes the largest NP agglomerates in CaCl
2 electrolyte (Fig.
4), and induces the fastest sedimentation process (Fig.
5). Untreated Al
2O
3 NPs show the fastest absorbance drop right after sonication (Figs.
5a and 5b), which is consistent with the continuous increases in their
d
H values (Fig.
4a). The sedimentation rate is related to the agglomerate size because large agglomerates increase the gravitational sedimentation and decrease random Brownian diffusion (Petosa et al.,
2010). Moreover, the large agglomerate or gel formation during sedimentation may retard particle diffusing, causing it to reduce back to a low concentration region, which results in faster sedimentation (Whitmer and Luijten,
2011).
However, larger
d
H values do not always induce a faster sedimentation rate. In NaCl electrolyte, BSA-treated NPs have larger
d
H values than the HA-treated NPs (Fig.
4), but their sedimentation rates are slower than or similar to those of HA-treated NPs (Fig.
5). Untreated Al
2O
3 NPs agglomerate to a much larger size than BSA-treated Al
2O
3 NPs in CaCl
2 electrolytes, but their sedimentation rates are close to each other (Fig.
5b). It was also reported that CeO
2 NPs formed larger agglomerates in river water in the presence of NOMs than their original material suspension, but the sedimentation rate was relatively low (Quik et al.,
2012). The compositions of NPs agglomerate are different in river waters and in their stock suspension, which probably induces such results. It indicates that particle sedimentation is a complicated process and the size of agglomerates is not the only determining factor. Particle/agglomerate and collector surface charges, agglomerate density, the solution chemistry of the suspending medium, viscosity between particle and medium, and the Hamaker constant of the particle-fluid-collector are all possible affective factors when particles sediment onto a collector surface (Elimelech et al.,
1998; Whitmer and Luijten,
2011). Moreover, several physicochemical processes are known to significantly alter the colloidal sedimentation: diffusion, hindered settling, hydrodynamic clustering/declustering, and Brownian clustering/declustering (Abel et al.,
1994). Larger agglomerates have larger gravity, but may have less bulk density and an increased ratio of buoyancy to gravity. The NOMs or biomolecules change the NPs from hard spheres to sticky spheres, which may increase the viscous drag (Buzzaccaro et al.,
2008). Therefore, the agglomerates with a stickier surface may deposit more slowly when all other conditions are the same. According to the complicated sedimentation process and multi affecting factors, the sedimentation rates of BSA-treated and HA-treated NPs cannot be predicted only by the size of their agglomerates. Further studies on the density of agglomerates and their surface hardness are needed to better understand the NP sedimentation process, especially in the presence of NOMs or biomolecules.
4. Conclusions
In this study, BSA and HA showed different influences on NP agglomeration and sedimentation behaviors. BSA treatments decreased the size of NP agglomerates and retarded its sedimentation in both NaCl and CaCl
2 electrolytes because the BSA globular architecture induced steric repulsive forces between NPs. HA treatments enlarged NP agglomerates and thereby accelerated its sedimentation greatly in CaCl
2 due to the intermolecular bridging via calcium complexation. It was supported by our results that NP agglomeration caused fast sedimentation. However, the smaller agglomerate size did not always induce the lower sedimentation rate, which indicated that agglomerate size was not the only determining factor in the NP sedimentation process.
* Project supported by the National Natural Science Foundation of China (Nos. 21377070 and 41303079), the Natural Science Foundation of Shandong Province (No. ZT2012BQ005), the State Key Laboratory of Environmental Chemistry and Ecotoxicology (No. KF2011-08), and the State Kay Laboratory of Pollution Control and Resource Reuse (Nos. PCRRF12008 and PCRRF13010), ChinaReferences
[1] Abel, J.S., Stangle, G.C., Schilling, C.H., 1994. Sedimentation in flocculating colloidal suspensions.
Journal of Materials Research, 9(2):451-461.

[2] Akaighe, N., Depner, S.W., Banerjee, S., 2012. The effects of monovalent and divalent cations on the stability of silver nanoparticles formed from direct reduction of silver ions by Suwannee River humic acid/natural organic matter.
Science of the Total Environment, 441:277-289.
[3] Allouni, Z.E., Cimpan, M.R., Hl, P.J., 2009. Agglomeration and sedimentation of TiO
2 nanoparticles in cell culture medium.
Colloids and Surfaces B: Biointerfaces, 68(1):83-87.
[4] Brunner, T.J., Wick, P., Manser, P., 2006.
In vitro cytotoxicity of oxide nanoparticles: comparison to asbestos, silica, and the effect of particle solubility.
Environmental Science & Technology, 40(14):4374-4381.
[5] Buzzaccaro, S., Tripodi, A., Rusconi, R., 2008. Kinetics of sedimentation in colloidal suspensions.
Journal of Physics: Condensed Matter, 20(49):494219
[6] Chae, S.R., Xiao, Y., Lin, S., 2012. Effects of humic acid and electrolytes on photocatalytic reactivity and transport of carbon nanoparticle aggregates in water.
Water Research, 46(13):4053-4062.
[7] Chen, K.L., Elimelech, M., 2007. Influence of humic acid on the aggregation kinetics of fullerene (C
60) nanoparticles in monovalent and divalent electrolyte solutions.
Journal of Colloid and Interface Science, 309(1):126-134.
[8] Chen, K.L., Mylon, S.E., Elimelech, M., 2006. Aggregation kinetics of alginate-coated hematite nanoparticles in monovalent and divalent electrolytes.
Environmental Science & Technology, 40(5):1516-1523.
[9] Chowdhury, I., Duch, M.C., Gits, C.C., 2012. Impact of synthesis methods on the transport of single walled carbon nanotubes in the aquatic environment.
Environmental Science & Technology, 46(21):11752-11760.
[10] Dominguez-Medina, S., Blankenburg, J., Olson, J., 2013. Adsorption of a protein monolayer via hydrophobic interactions prevents nanoparticle aggregation under harsh environmental conditions.
ACS Sustainable Chemistry & Engineering, 1(7):833-842.
[11] Elimelech, M., Jia, X., Gregory, J., 1998. Particle Deposition & Aggregation: Measurement, Modelling and Simulation. . Butterworth-Heinemann,Wuborn :
[12] Erhayem, M., Sohn, M., 2014. Effect of humic acid source on humic acid adsorption onto titanium dioxide nanoparticles.
Science of the Total Environment, 470-471:92-98.
[13] Ghosh, S., Mashayekhi, H., Pan, B., 2008. Colloidal behavior of aluminum oxide nanoparticles as affected by pH and natural organic matter.
Langmuir, 24(21):12385-12391.
[14] Ghosh, S., Mashayekhi, H., Bhowmik, P., 2010. Colloidal stability of Al
2O
3 nanoparticles as affected by coating of structurally different humic acids.
Langmuir, 26(2):873-879.
[15] Hsiao, I.L., Huang, Y.J., 2013. Effects of serum on cytotoxicity of nano- and micro-sized ZnO particles.
Journal of Nanoparticle Research, 15(9):1-16.
[16] Jiang, W., Mashayekhi, H., Xing, B.S., 2009. Bacterial toxicity comparison between nano- and micro-scaled oxide particles.
Environmental Pollution, 157(5):1619-1625.
[17] Kang, S.H., Xing, B.S., 2008. Humic acid fractionation upon sequential adsorption onto goethite.
Langmuir, 24(6):2525-2531.
[18] Keller, A.A., Wang, H.T., Zhou, D.X., 2010. Stability and aggregation of metal oxide nanoparticles in natural aqueous matrices.
Environmental Science & Technology, 44(6):1962-1967.
[19] Limbach, L.K., Li, Y.C., Grass, R.N., 2005. Oxide nanoparticle uptake in human lung fibroblasts: effects of particle size, agglomeration, and diffusion at low concentrations.
Environmental Science & Technology, 39(23):9370-9376.
[20] Malcolm, R.L., MacCarthy, P., 1986. Limitation in the use of commercial humic acid in waters and soil research.
Environmental Science & Technology, 20(9):904-911.
[21] Nel, A., Xia, T., Mdler, L., 2006. Toxic potential of materials at the nanolevel.
Science, 311(5761):622-627.
[22] Petosa, A.R., Jaisi, D.P., Quevedo, I.R., 2010. Aggregation and deposition of engineered nanomaterials in aquatic environments: role of physicochemical interactions.
Environmental Science & Technology, 44(17):6532-6549.
[23] Quik, J.T., Stuart, M.C., Wouterse, M., 2012. Natural colloids are the dominant factor in the sedimentation of nanoparticles.
Environmental Toxicology and Chemistry, 31(5):1019-1022.
[24] Saleh, N.B., Pfefferle, L.D., Elimelech, M., 2010. Influence of biomacromolecules and humic acid on the aggregation kinetics of single-walled carbon nanotubes.
Environmental Science & Technology, 44(7):2412-2418.
[25] Sun, K., Jin, J., Kang, M.J., 2013. Isolation and characterization of different organic matter fractions from a same soil source and their phenanthrene sorption.
Environmental Science & Technology, 47(10):5138-5145.
[26] Whitmer, J.K., Luijten, E., 2011. Sedimentation of aggregating colloids.
The Journal of Chemical Physics, 134(3):034510
[27] Xia, T., Kovochich, M., Brant, J., 2006. Comparison of the abilities of ambient and manufactured nanoparticles to induce cellular toxicity according to an oxidative stress paradigm.
Nano Letters, 6(8):1794-1807.
[28] Yang, K., Lin, D.H., Xing, B.S., 2009. Interactions of humic acid with nanosized inorganic oxides.
Langmuir, 25(6):3571-3576.


Open peer comments: Debate/Discuss/Question/Opinion
<1>