Affiliation(s):
1.
Power Machinery and Vehicular Engineering Institute, Zhejiang University, Hangzhou 310027, China; moreAffiliation(s): 1.
Power Machinery and Vehicular Engineering Institute, Zhejiang University, Hangzhou 310027, China; 2.
Department of Mechanical and Aerospace Engineering, Monash University-Clayton, Victoria 3800, Australia; less
Yu-qi Huang, Rui Huang, Xiao-li Yu, Feng Lv. Simulation, experimentation, and collaborative analysis of adjacent heat exchange modules in a vehicular cooling system[J]. Journal of Zhejiang University Science A, 2013, 14(6): 417-426.
@article{title="Simulation, experimentation, and collaborative analysis of adjacent heat exchange modules in a vehicular cooling system", author="Yu-qi Huang, Rui Huang, Xiao-li Yu, Feng Lv", journal="Journal of Zhejiang University Science A", volume="14", number="6", pages="417-426", year="2013", publisher="Zhejiang University Press & Springer", doi="10.1631/jzus.A1300038" }
%0 Journal Article %T Simulation, experimentation, and collaborative analysis of adjacent heat exchange modules in a vehicular cooling system %A Yu-qi Huang %A Rui Huang %A Xiao-li Yu %A Feng Lv %J Journal of Zhejiang University SCIENCE A %V 14 %N 6 %P 417-426 %@ 1673-565X %D 2013 %I Zhejiang University Press & Springer %DOI 10.1631/jzus.A1300038
TY - JOUR T1 - Simulation, experimentation, and collaborative analysis of adjacent heat exchange modules in a vehicular cooling system A1 - Yu-qi Huang A1 - Rui Huang A1 - Xiao-li Yu A1 - Feng Lv J0 - Journal of Zhejiang University Science A VL - 14 IS - 6 SP - 417 EP - 426 %@ 1673-565X Y1 - 2013 PB - Zhejiang University Press & Springer ER - DOI - 10.1631/jzus.A1300038
Abstract: A cooling system consisting of several heat exchange modules is a necessary part of an automobile, and its performance has a direct effect on a vehicle’s energy consumption. heat exchangers, such as a charged air cooler (CAC), radiator, oil cooler, or condenser have different structures and can be arranged in various orders, and each combination may produce different effects because of interactions among them. In this study, we aimed to explore the principles governing interactions among adjacent heat exchangers in a cooling system, using numerical simulation and experimental technology. 3D models with different combinations were developed, compared, and analyzed comprehensively. A wind tunnel test platform was constructed to validate the computational results. We found that the heat dissipation of the modules was affected slightly by their relative position (the rules basically comply with the field synergy principle), but was independent of the modules’ spacing within a certain distance range. The heat dissipation of one module could be effectively improved by restructuring, but with a penalty of higher resistance. However, the negative effect on the downstream module was much less than expected. The results indicated that the intensity of heat transfer depends not only on the average temperature difference between cold and hot mediums, but also on the temperature distribution.
Darkslateblue:Affiliate; Royal Blue:Author; Turquoise:Article
Article Content
1. Introduction
A cooling system is an important auxiliary system to ensure the operational stability of a vehicle. It consists of several modules including a charged air cooler (CAC), radiator, oil cooler, and condenser. All heat exchanger modules are cooled successively by air, the only cooling medium. With the growing demands for fuel economy, automobile safety and comfort, engine compartments have become more and more crowded. The shape and size of a cooling system are severely limited. Thus, with a single module already designed for high efficiency, the spacing and position of adjacent modules may have a significant effect on the performance and size of the entire system.
Composite analysis of multi-heat exchangers in cooling systems has been carried for several years. There are complicated structures in a cooling system, including pipes, plates, and tiny fins. To understand the internal flow and heat transfer, a lot of resources have been invested in numerical studies of vehicular cooling systems. Asanuma et al. (1997) explored the interaction between a radiator and a condenser. They found that the condenser had significant negative effects on the performance of the radiator. Uhl et al. (2001) adopted 3D computational fluid dynamics (CFD) software to analyze the detailed flow in a radiator, condenser, and CAC, and coupled the simulated results with a flow solver. Their calculated results matched their measurements well. Kim and Kim (2008) predicted the performance of an engine cooling module under various operating conditions using CFD programs. The predicted air velocity before the radiator closely matched their test data. Juan (2008) simulated the engine compartment of a truck, and analyzed the influence on the internal flow of a number of factors including the grille, hood, bumper, radiator, fan size, blades, and arrangement. Their research indicated that the radiator had a major influence on the flow resistance, and that torque decreased with the application of optimized blades.
Experimentation has been widely used in research to overcome the limitation of computational ability. Wind tunnel tests have been commonly used to study many aspects of vehicular cooling systems, from fins (Dong, 2007) to the entire system (Lv, 2010). Ngy (1999) investigated the effects on cooling performance of different radiator sizes, fan sizes, fan shrouds, and fan speeds. A wind tunnel test system was established, and the results from seven different vehicles were compared. Ngy et al. (2002) studied the effects of condenser size and position, and conducted a simulation based on experimental data. Khaled et al. (2012) adopted particle image velocimetry (PIV), laser doppler velocimetry (LDV), and thermocouples to study a vehicle under-hood cooling module. Flow and temperature distributions were clearly presented and a new monitoring tool was developed.
With the development of computer technology and test techniques, studies on cooling systems are becoming more accurate, and have given valuable results for reference. But most studies analyzed multi-heat exchangers as a whole, and interactions between heat exchangers have received less attention, especially in experimental studies. This study focused on the adjacent heat exchangers in a cooling system. The cooling modules were modelled separately and analyzed comprehensively, to explore the factors governing their interaction.
Because of their large size and heat transfer surfaces, the radiator and CAC were considered as the main components of the vehicular cooling system. The overall size of a cooling package is determined mainly by the size and spacing of these two modules. For this reason, the radiator and CAC modules were the main focus of this paper. Commercial CFD codes based upon the finite volume method were used to make the simulation. Three modules with different combinations were simulated, compared, and examined using a collaborative analysis, and the results were validated with experimental data based on wind tunnel tests.
2. Methodology
2.1. Simulation description
The main research objects in this study were a typical radiator (830 mm×624 mm×102 mm) and CAC (800 mm×605 mm×162 mm) from a certain engineering vehicle.
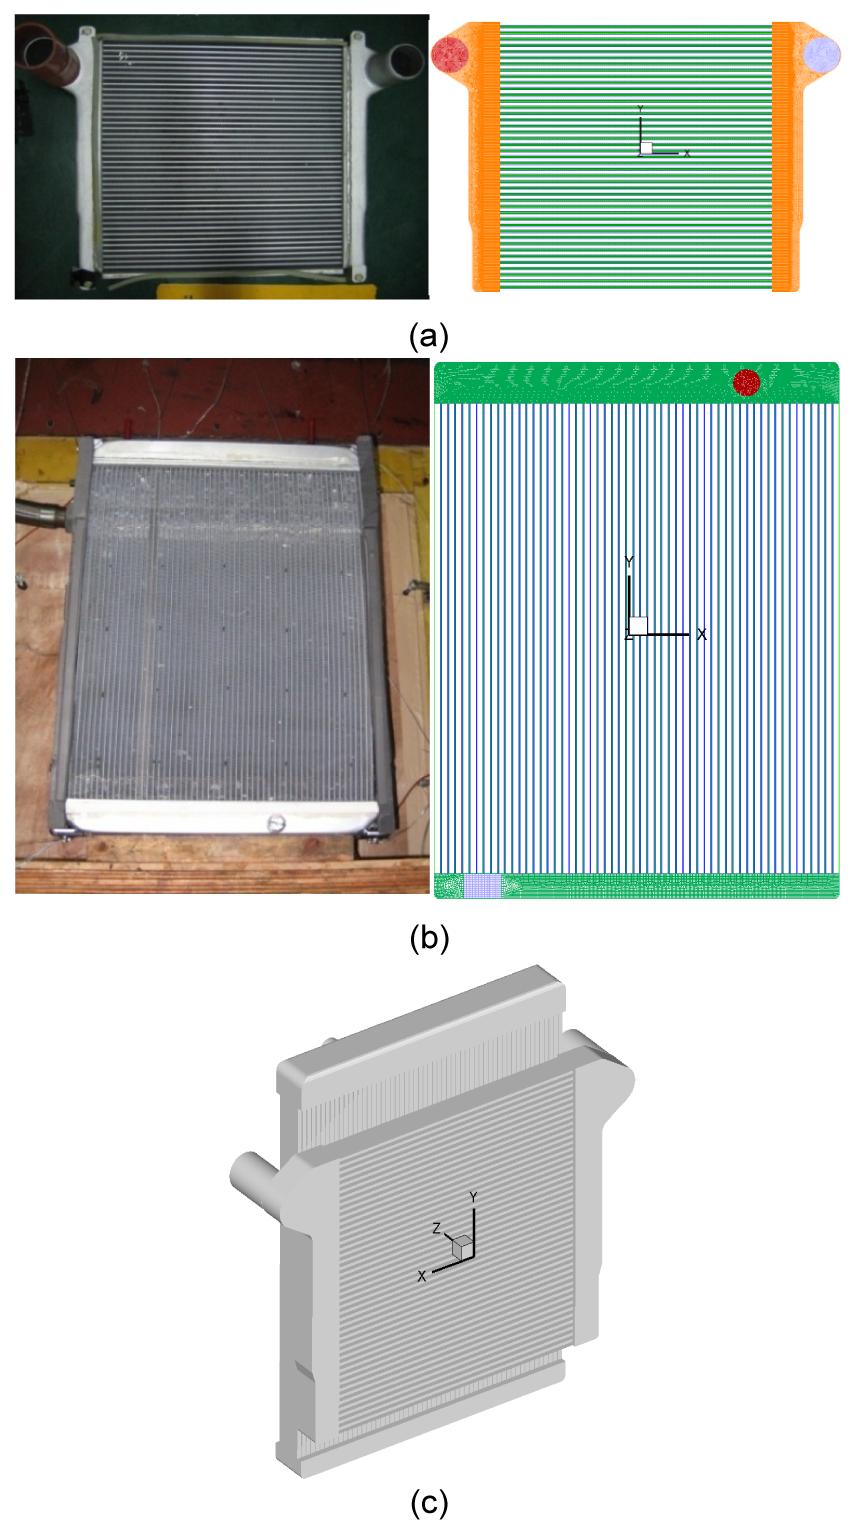
The CAC was a kind of plate-fin heat exchanger with serrated fins on the hot-side and wavy fins on the cold-side. It was arranged in front of the radiator because of its more critical cooling requirement. The radiator was a traditional tube-fin heat exchanger composed of flat tubes and wavy fins. 3D models were established on the basis of actual production (Fig. 1). Ambient air, as the cooling medium, flows through the CAC and radiator in turn. The space between the modules’ cores is about 35 mm. The height and width of the channels are consistent with those of the actual products. In considering the restricted computational capability, the fins are omitted and simplified as a porous medium. The channels are meshed with hexahedral cells. The water and air tanks are meshed with unstructured tetrahedral mesh. We identified a cell size from 0.5 mm to 3 mm after a grid-independent test. About 8.3 million mixture elements were generated for the models.
Fig.1 3D model, grids and photo of the CAC and radiator (a) CAC; (b) Radiator; (c) 3D model for simulations
According to the actual testing conditions, the models were analyzed as four cases. The hot air mass flow rates were kept at 1240 kg/h in all cases, and the cooling air velocity was adjusted from 4 m/s to 10 m/s.
The standard k-ε turbulence model with shear flow corrections was used to deal with high-speed turbulent flow problems. The second-order upwind difference scheme was adopted for the momentum, energy and turbulence equations. The turbulence kinetic energy, k and its dissipation rate, ε, were obtained from the following transport equations:
,
,
where ρ and μ are the density and viscosity, respectively, and t is the transport time. Gk represents the generation of turbulence kinetic energy due to the mean velocity gradients, calculated by
.
The k and ε are coupled to the governing equations via the relation:
.
In Eqs. (1), (2) and (4), C1ε, C2ε, Cμ, σk, and σε are constants: C1ε=1.44, C2ε=1.92, Cμ=0.09, σk=1.0, and σε=1.3.
The empirical constant for the turbulence model was assigned values in accordance with the recommendation of Launder and Spalding (1972).
To deduce the porous media parameters, the empirical correlation given by regressing experimental data to a certain function was adopted (Dong et al., 2007b).
The calculation equations for wavy-fin are written as (Dong, 2007b)
,
where Fp is the fin space, Fh is the fin height, L is the wavelength, Ld is the entire flow length, and b is the amplitude.
The calculation equations for a plane-fin are written as
,
where δ is the fin thickness, and Dc is the hydrodynamic diameter of the fin.
According to the definition of friction factor f:
.
Then,
,
where Vc is the average velocity of the flow field, and D is the hydrodynamic diameter of the fin. ΔPi and ΔPe are the pressure differentials produced by the circulation area abruptly narrowing and widening, respectively. They are negligible in this case. We calculated the factor f with different velocities, then the pressure drop was derived. The porosity parameters were estimated from the correlation between the velocity and pressure differential.
CFD program Fluent 13 was used to solve these problems in a super-computer with eight Intel Xeon CPUs (2.0 GHz per CPU). It took about 20 h per case for calculation with six CPUs involved.
2.2. Experiments
2.2.1. Test bench
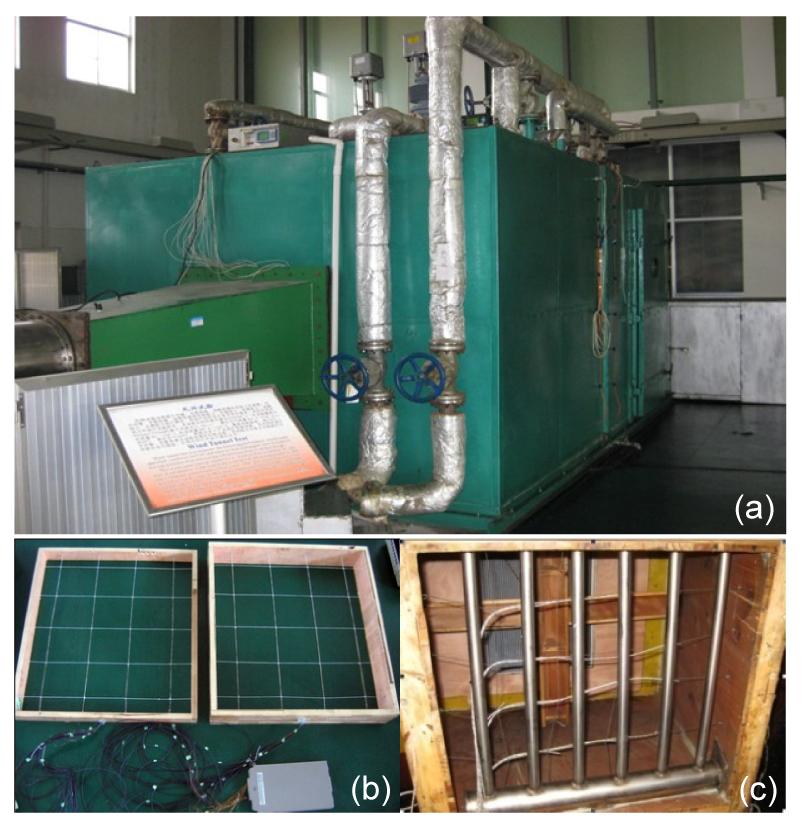
A wind tunnel test platform (Fig. 2) consisting of an cooling air system, water circulation system (Fig. 3), hot air circulation system (Fig. 4), and experimental data acquisition system (Huang, 2010) was constructed to test the heat exchangers.
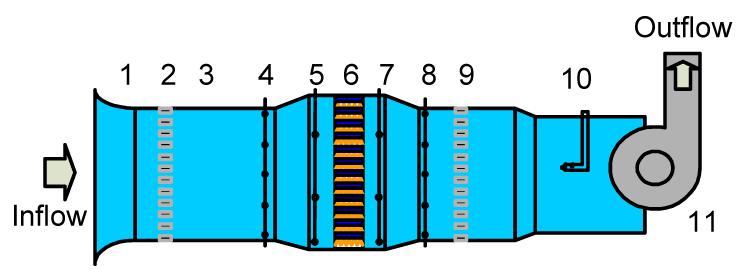
Fig.2 Sketch of the wind tunnel test system 1: air inlet section; 2, 9: honeycomb; 3: front stable section; 4, 8: temperature-measuring net; 5, 7: pressure measurement; 6: cooling modules (including CAC and radiator); 10: back stable section and velocity measurement; 11: fan and outlet
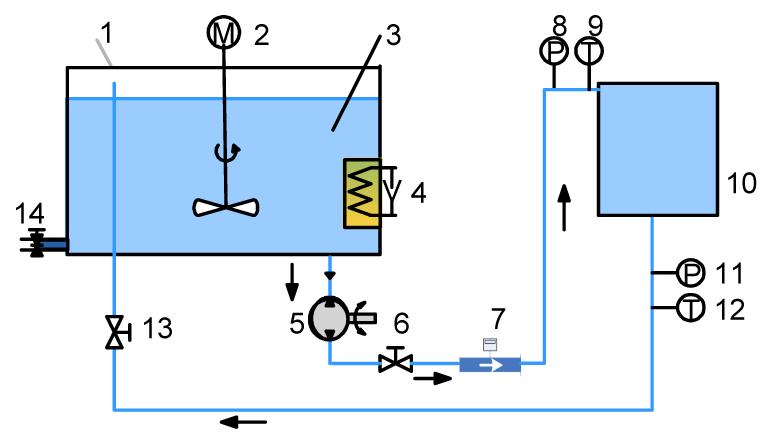
Fig.3 Sketch of the water circulation system 1: water tank; 2: agitation system; 3: cooling water; 4: electric heater; 5: pumps; 6, 13: flow valve; 7: Coriolis mass flow meter; 8, 11: pressure sensor; 9, 12: temperature sensor; 10: radiator; 14: drainpipe
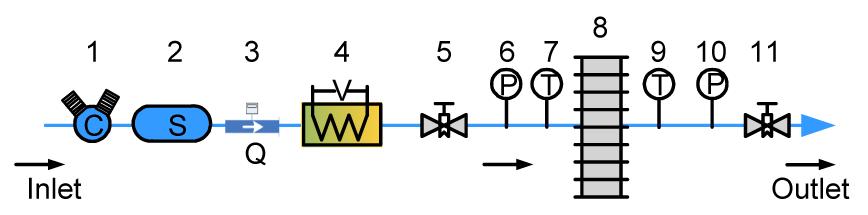
Fig.4 Sketch of the hot air circulation system 1: air compressor; 2: air tank; 3: Coriolis mass flow meter; 4: electric heater; 5, 11: flow valve; 6, 10: pressure sensor; 7, 9: temperature sensor; 8: CAC
In this platform, the main function of the cooling air system was to emulate the actual flow in the running vehicle. It was controlled by adjusting fan speeds to a maximum of 30 000 m3/h. Rectifying units, including honeycomb and gauze elements, were designed to make the flow uniform.
The heated air circulation system was used to supply the hot air with adjustable temperature, flow rate, and pressure. In this study, heated air substituted for charged air. The hot air volume flow rate could be adjusted from 4 m3/min to 50 m3/min, and the temperature range was from ambient to 300 °C.
Like the heated air circulation system, the water circulation system was adopted to emulate the cooling water in an engine system, with adjustable temperature, flow rate, and pressure. The amount of water flowing could be adjusted from 1 m3/h to 15 m3/h. The water tank was open style, giving a permissible temperature range from ambient to 99 °C.
2.2.2. Test services and sensors
A Coriolis mass flow meter with a range from 0 kg/min to 600 kg/min was employed to measure the hot air and water flow rate. Its error was ±0.15%. A ToCeil-FB thermal mass flow meter (Shanghai, China) was used to measure the cooling air flow rate for the merits of high sensitivity and stability. As for the pressure, a few sensors were applied in different positions (Table 1).
Table 1
Parameters of the pressure and differential pressure transducer
Measured parameter
Sensor
Range (kPa)
Precision (%)
Wind tunnel inlet pressure
Flow totalizer
0–300
0.50
Cooling air pressure
Differential pressure transmitter
−2–0
0.25
Cooling air pressure drop
Differential pressure transmitter
0–2.5
0.25
Hot air inlet pressure
Pressure sensor
0–300
0.25
Hot air pressure drop
Differential pressure transmitter
0–100
0.25
Water pressure
Pressure sensor
0–600
0.25
Water pressure drop
Differential pressure transmitter
0–200
0.25
The temperature data in this experiment was monitored with Pt100 thermal resistors. All the temperature sensors were demarcated by a thermostatic oil bath, and accuracy reached super A class. To achieve reliable results, two temperature-measuring nets (Fig. 5) composed of many sensors were set in front of and behind the radiator, respectively.
Fig.5 Photo of the experimental services (a) Wind tunnel; (b) Temperature-measuring net between the CAC and radiator; (c) Temperature-measuring net behind the radiator
After the services were installed and organized, we ran the test bench under the initial conditions. The data were recorded while the system reached thermal equilibrium.
2.3. Collaborated study method
To explore the interaction of adjacent modules, combinations involving three different adjustments were compared in this study: (1) Changing the relative positions; (2) Changing the spacing; and, (3) Changing the flow pattern of the hot medium in the CAC.
Firstly, we adjusted the relative position with two methods: (A) Moving the CAC up, to align the cores at the top; (B) Moving the CAC down, to align the cores at the bottom.
Then, to analyze the influence of module space, two models were modified as follows, with all the other structures kept the same: (C) Increasing the modules’ space by 50 mm; (D) Increasing the modules’ space by 100 mm.
Finally, the effects of the flow pattern of the prior module were analyzed in detail. The inlet and outlet positions were changed as follows, with all the other structures kept the same: (E) Turning the entire CAC upside-down, with the hot air flowing from the lower left corner to the lower right corner; (F) Turning the right tank of the CAC upside-down, with hot air flowing from the upper left corner to the lower right corner (Fig. 6).
Fig.6 Photo of the CAC (model F)
The tests and simulations were carried out according to these six methods, and the heat dissipations (calculated by the measured temperature difference) were contrasted and analyzed.
3. Results
3.1. Numerical results analysis
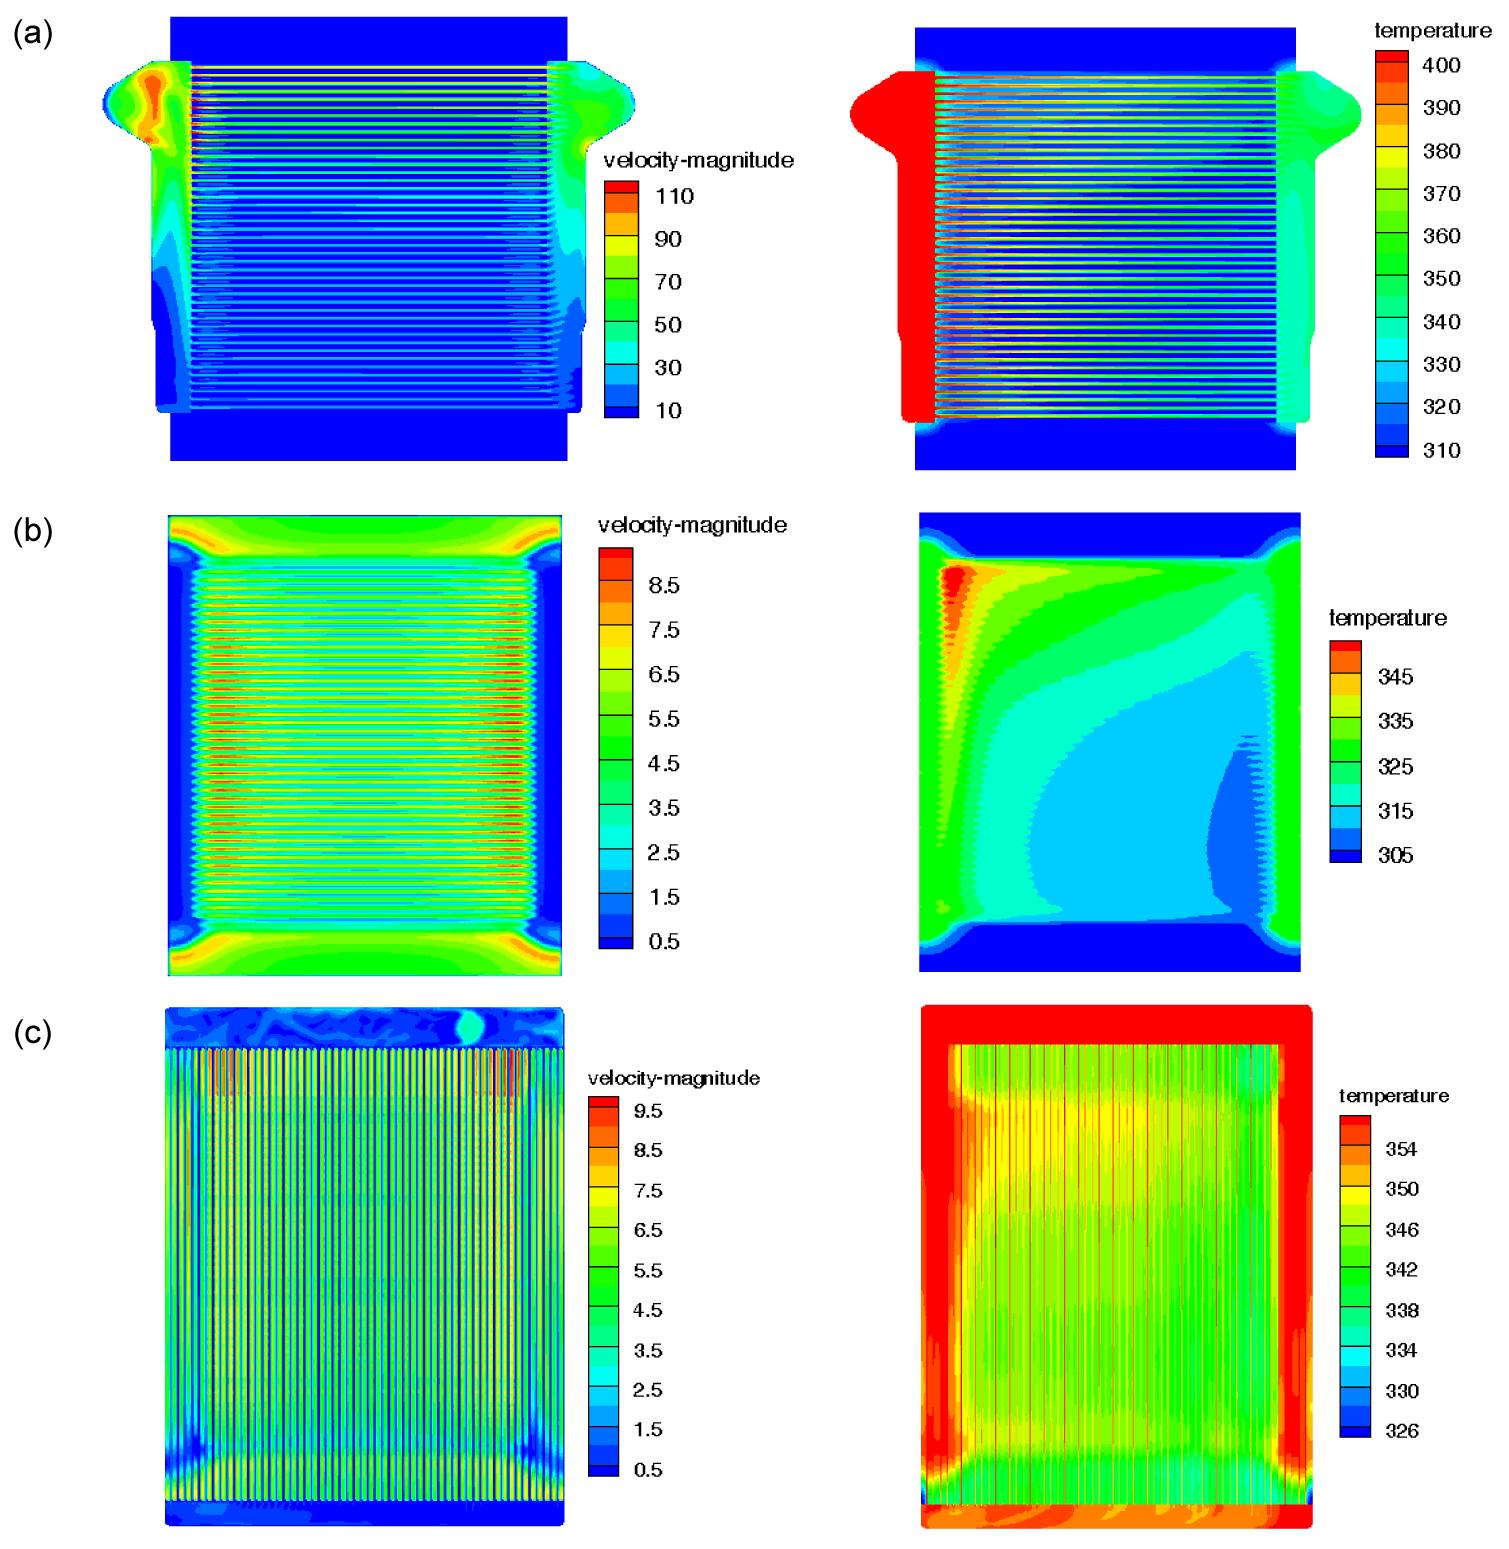
A few typical cross-sections of the original model are extracted to demonstrate the internal flow and temperature distribution. Fig. 7a shows the middle section in the CAC, Fig. 7b the parallel section behind the CAC, and Fig. 7c the middle section in the radiator. Clearly, the flow and temperature status of the downstream module are highly reliant on the status of the prior module. The mass flux across the upper channels of the CAC is larger, therefore the cooling air of the upper region is heated at a higher temperature. In the present model, the heat dissipation in the radiator was strongly influenced by the size and position of the adjacent CAC tanks. This suggests that collaborative analysis should be taken into account in the design of cooling packages.
Fig.7 Velocity and temperature distributions (a) Middle section in the CAC; (b) Parallel section behind the CAC; (c) Middle section in the radiator
The velocity and temperature curves along the X-minus direction inside and downstream of the radiator are illustrated in Fig. 8. The velocity distribution was nearly zygomorphic. In Fig. 8a, the upper points indicate the velocity distributions in air channels, and the lower points indicate the velocity in water-tubes. The air flow rates on the left and right sides were relatively low owing to the block of CAC tanks. The temperature distributions were exactly contrary in Fig. 8b, in that the higher temperatures came from water-tubes and the lower values from the air temperatures. At the intermediary region of the core, both temperatures were higher on the left and lower on the right. The lowest water temperature appeared in the tube with the lowest water flow rate. On the left and right sides, low flow rates of air incurred high temperatures, with the temperature values of air and water being very close.
Fig.8 Velocity curve (a) and temperature curve (b) along the X-minus direction in the middle of the radiator
3.2. Results validation
To validate the numerical simulations, the computational results were compared to the test results (Figs. 9 and 10). The computational and test results display similar trends. When the cooling air flow rate was increased, the pressure drop increased too, accompanied by an enhancement of heat exchange. Thus, the temperature differences of hot air and water were both enlarged.
Fig.9 Comparison of the cooling air in tests and simulations (a) Temperature difference; (b) Pressure drop
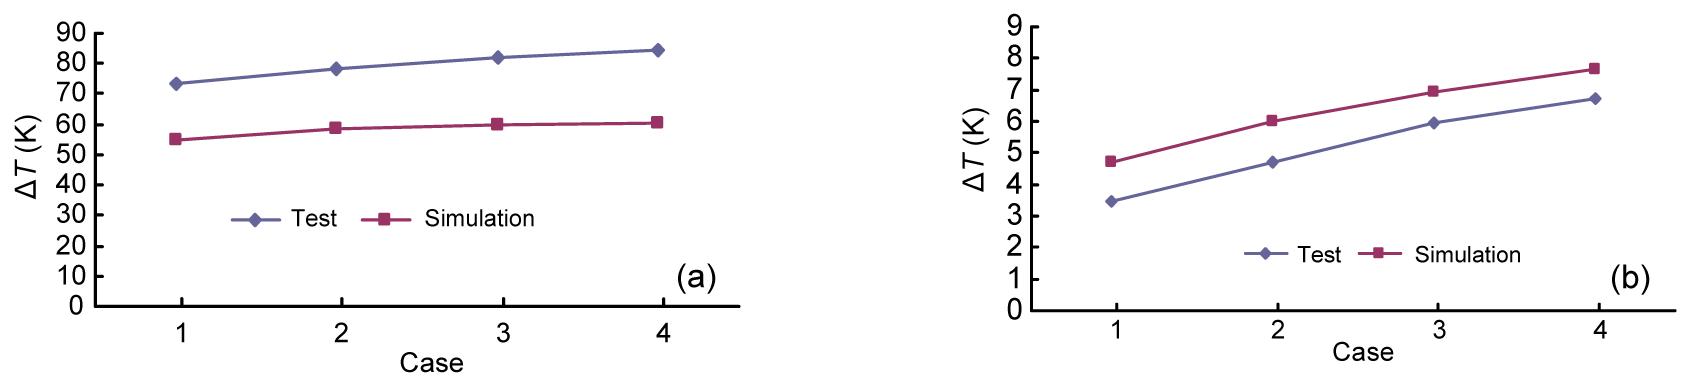
Fig.10 Comparison of the temperature difference between tests and simulations (a) Temperature difference of hot air; (b) Temperature difference of water
From these comparisons we found that the simulated temperatures deviated from the test results more than did the flow resistances. This is probably because: (1) the porous parameters were converted from the empirical equations of the friction factor, thus inaccuracies in anticipating heat exchange could not be corrected; (2) the porous model in FLUENT 13 may not be accurate in processing the energy equation, thereby giving poor results. However, in general, the simulated and measured results matched well in their trends. The data error was acceptable and could be corrected by parameters. Thus, the simulation model could be effectively used in further studies.
3.3. Collaborative analysis
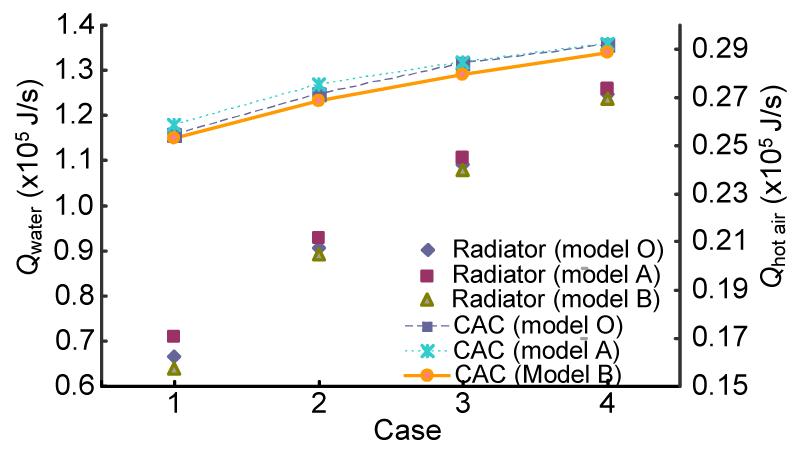
The effects of changing the relative positions were studied first. The heat dissipations in different models (calculated by the measured temperature differences) are contrasted in Fig. 11, where model O represents the original structure, and models A and B represent the two adjusted structures.
Fig.11 Heat dissipations of the water and hot air in different positions
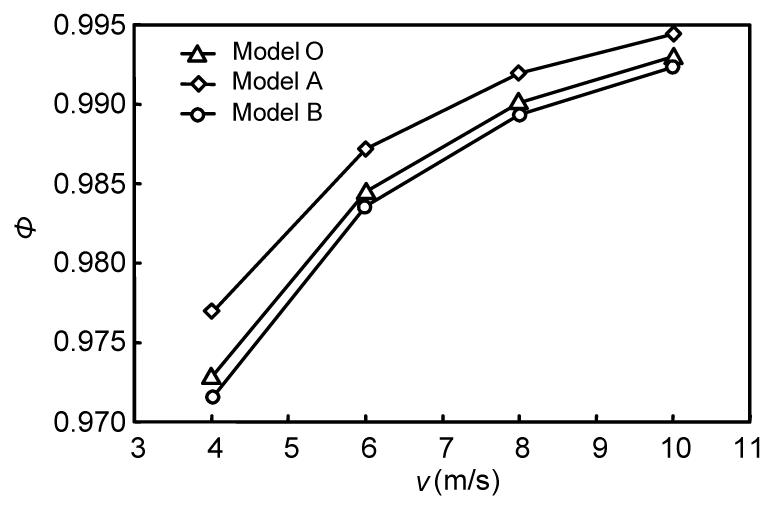
Based on the field synergy principle proposed by Guo and Huang (2004), the more uniform the temperature difference (between cold and hot mediums) distribution, the better is the heat transfer performance. A parameter, Φ, defined as the uniformity factor of the temperature difference field (TDF), was adopted to describe the uniformity degree. In the cross flow heat exchanger, it could be written as shown in Eq. (9):
.
Here, Cr=Cmin/Cmax is the heat capacity rate ratio, and NTU is the number of heat transfer units.
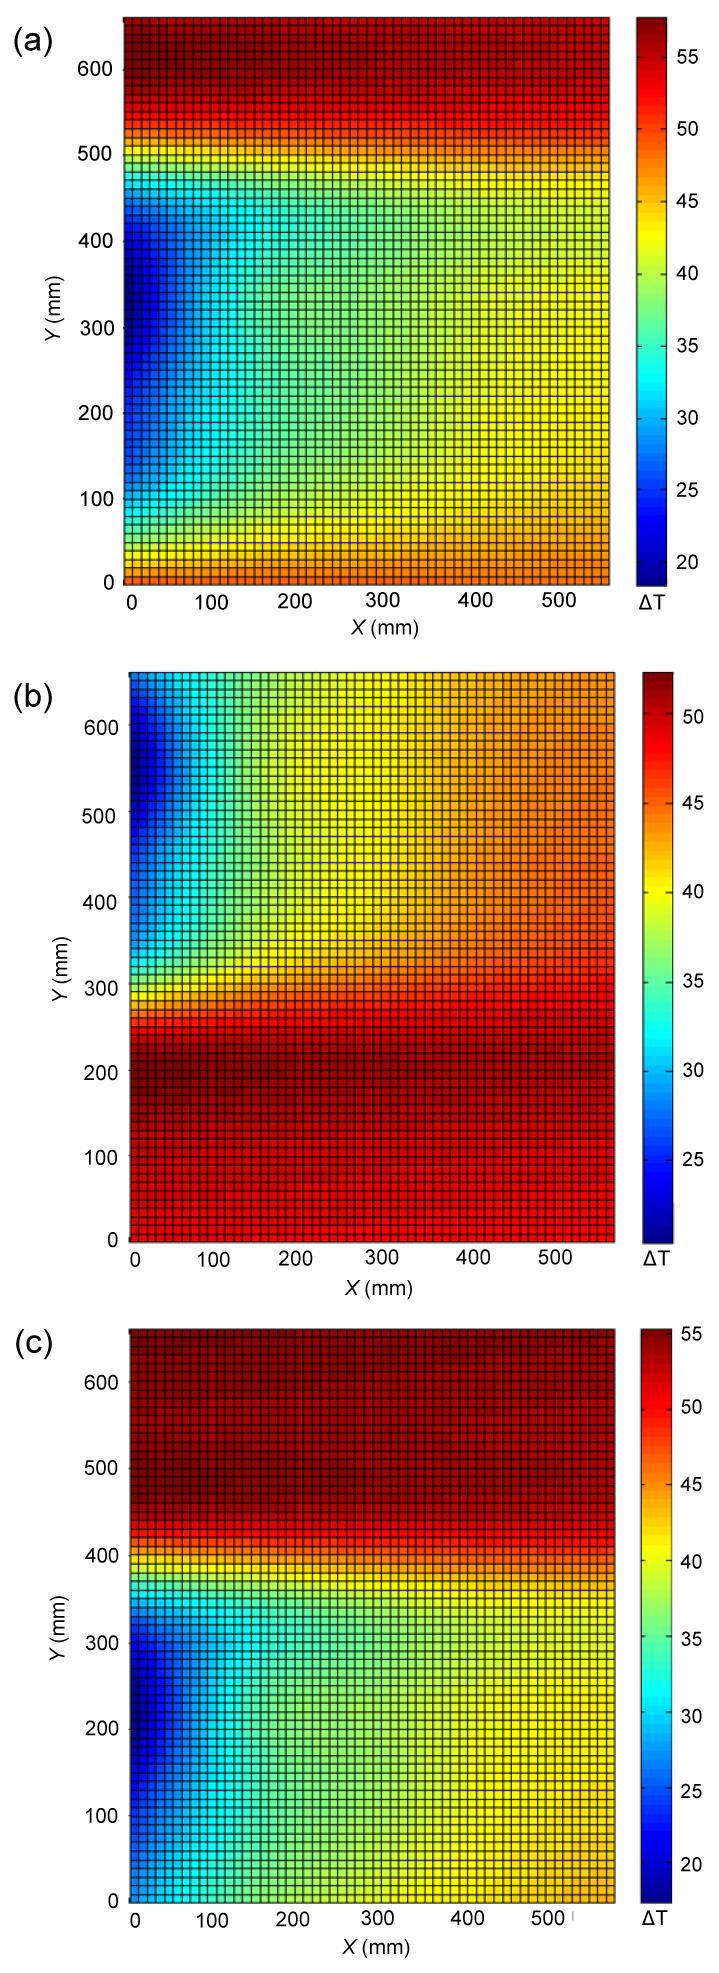
Fig. 12 plots the parameter Φ inside the radiator, and Fig. 13 displays the TDF (between water and cooling air) of the radiator mounted in modules. In Fig. 13b, temperature differences are mainly in the range of 25 to 50 °C, less variable than the range of 20 to 55 °C in Figs. 13a and 13c. At the same time, the high temperature difference area marked by red (in the web version) in Fig. 13b is obviously bigger than those in Figs. 13a and 13c. More synergy and a larger area of strong heat transfer indicate a better performance.
Fig.12 Uniformity factor of the TDF in the radiator
Fig.13 TDF of the radiator mounted in module (a) Model O; (b) Model A; (c) Model B
Compared to the original structure and method B, method A was slightly better at heat dissipation from the radiator. The temperature of a radiator is generally higher at the top and lower at the bottom. Although the topside cooling air is heated by the CAC in method A, the temperature of the cold medium also appeared to be higher at the top and lower at the bottom. This makes the TDF of the radiator more uniform than the one in model B and in the original model, and therefore the heat-transfer efficiency is higher accordingly. In terms of the prior module, the CAC, there is no obvious relationship between the original model and model B. However, it could be observed that the change involved in model A is disadvantageous to the CAC.
The effects of changing the spacing were studied. By carrying out experiments under the same conditions, we found that heat dissipations of both modules were unaffected by changed spacing. Thus, we believe that spacing variation within a certain range would not influence the heat-transfer efficiency.
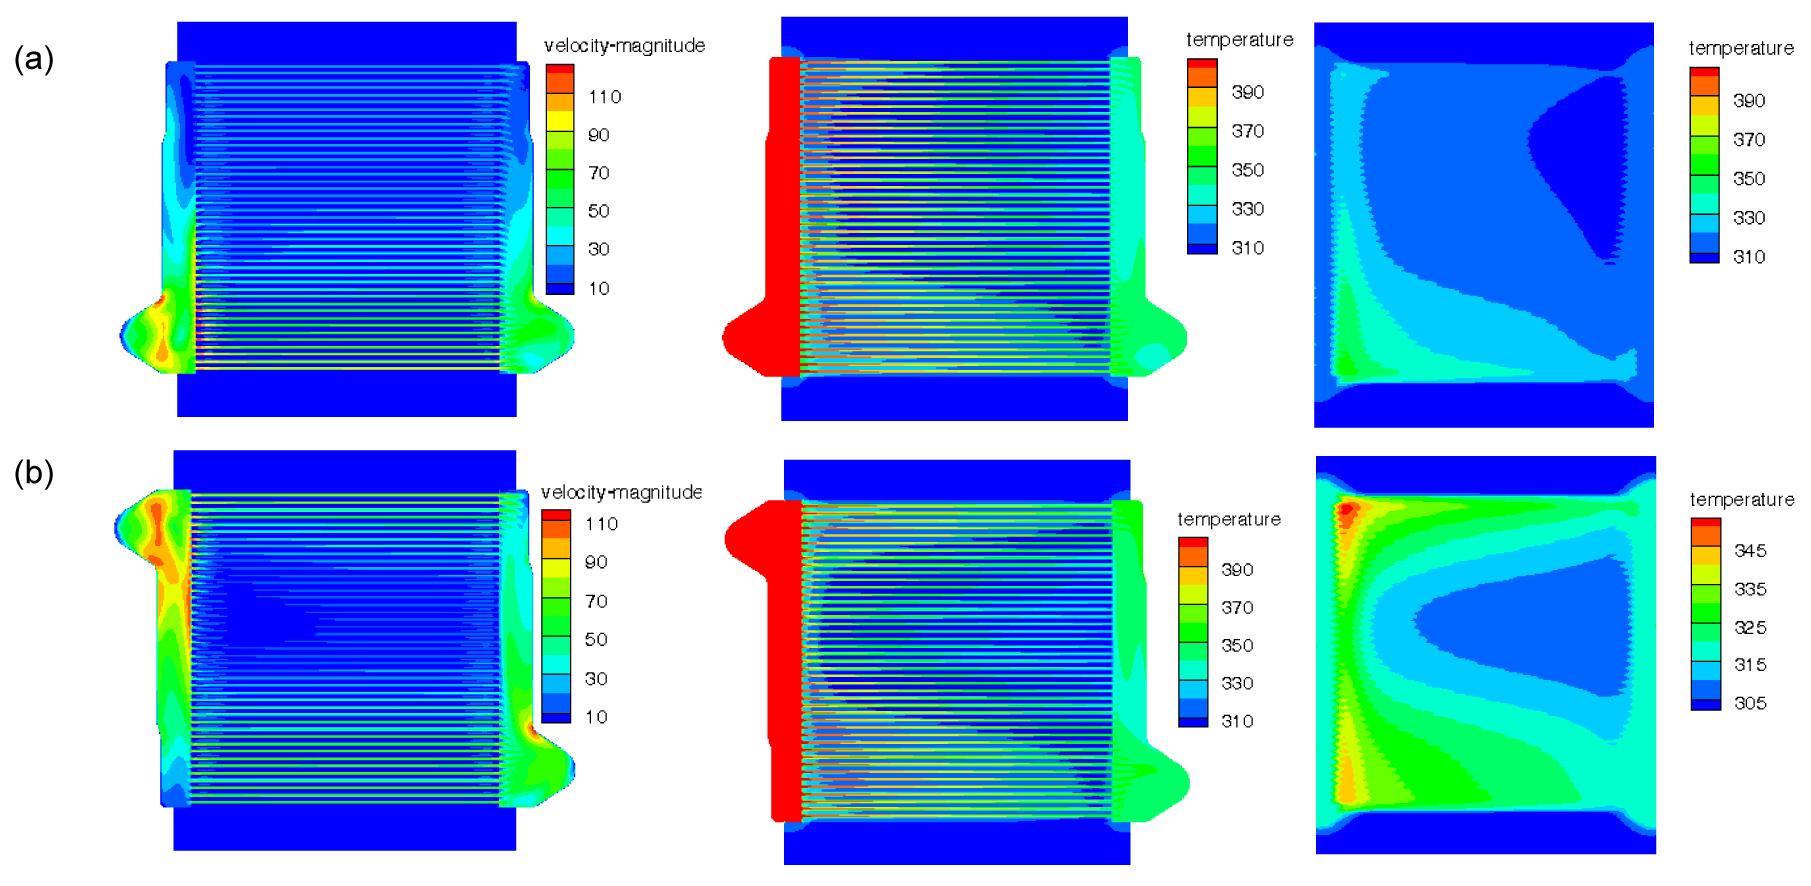
Finally, simulations and experiments on different CAC structures were carried out. The adjusted models were established and simulated in the same way as the original model. In the original CAC, the hot air inlet and outlet were both assigned to the top. Most flow occurs across the upper channels. The temperatures and flow rates of all channels were distinctly non-uniform. With the changing of the air-tank structure, the flow patterns were transformed, and the flow and temperature fields of the entire model were changed accordingly. The velocity and temperature distributions in the new models are shown in Fig. 14. The flow patterns were clearly influenced by the tank structure in the CAC. In model F, the flow path was broadly lengthened and more channels were involved in the mass-transfer. This represents more uniformity in the allocation of hot medium, and makes better use of the cooling air. From the temperature distribution in the section behind the CAC, the cooling air of model F is heated in a larger area compared to those of model E and the original model (Fig. 7).
Fig.14 Velocity distribution of the middle section in the CAC and the temperature distribution inside and behind the CAC (a) Model E; (b) Model F
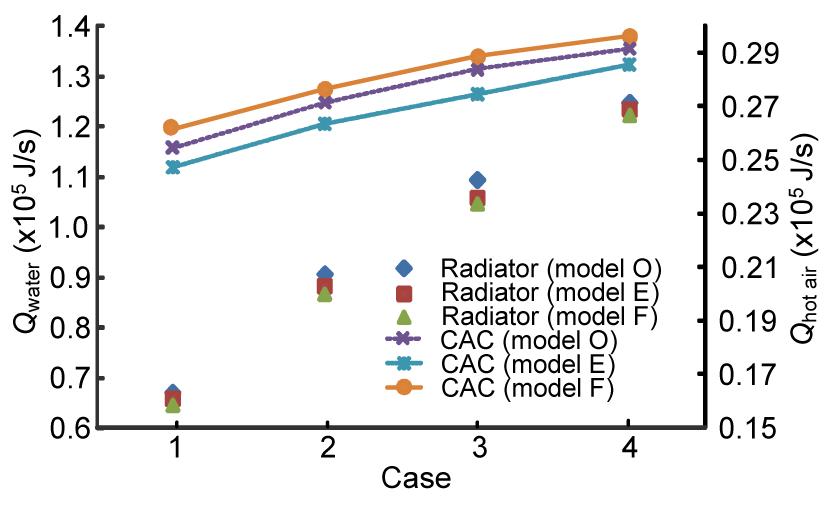
To validate the influence on the flow pattern, wind tunnel measurements were carried out under similar conditions. As plotted in Fig. 15, the curves illustrate the heat dissipations calculated by the measured temperature differences of hot mediums, where model O means the original structure, and models E and F represent the two modified structures.
Fig.15 Heat dissipations of the water and hot air in different CAC structures
Based on this figure, the heat dissipation of the CAC in model F is visibly higher than those of model E and the original model. As for the heat dissipation of the radiator in the three models, the data were very similar, but the value in model F was always the lowest. Comparing the hot-side pressure drop of the CAC (Fig. 16), we found that the flow resistance inside model F was about 12% higher than the resistance inside model E. However, with increasing cooling air velocity, the hot-side pressure drop decreased gradually, and the mass flow rates remained the same. This may be related to the variation in the hot air properties. The increased cooling air flow rate induces a better cooling effect. Accompanied by the larger scope of the temperature drop, the density increases and the viscosity reduces, thus the flow resistance of the hot air declines accordingly. In light of these results, the heat dissipation of one single module can be effectively improved by restructuring, but with a penalty of higher resistance. The influence on the thermal status of the next module was much less than expected. Although the heat transfer of the CAC was significantly enhanced, there was no substantial influence on the performance of the radiator. This indirectly reflects the fact that the intensity of heat transfer depends not only on the average temperature difference between the cold and hot mediums, but also on the temperature distribution.
Fig.16 Hot-side pressure drop of the CAC
4. Conclusions
This study deals with a collaborative analysis of adjacent heat exchanger modules in an automobile. Numerical simulations and experiments were carried out, and the results were very similar. Three kinds of combination were selected to analyze the interaction of adjacent modules and we found that the heat dissipation of the modules is affected by their relative position, and the rules comply with the field synergy principle: the more uniform the temperature difference (between cold and hot mediums) distribution, the better is the heat transfer performance.
Based on this study, the variation of spacing within a certain range would not obviously influence the heat-transfer efficiency. The heat exchange capacity of one single module can be effectively improved by restructuring, but with a penalty of higher resistance. However, although the heat transfer of the prior module was significantly enhanced, there was no substantial influence on the performance of the next module. This reflects the fact that the intensity of heat transfer depends not only on the average temperature difference between cold and hot mediums, but also on the temperature distribution.
Nevertheless, the interaction of adjacent heat exchangers should not be neglected in limited spaces, and deserves further investigation. This research could provide a valuable reference for the design and optimization of vehicular cooling systems.
Acknowledgements
Special material and technical support given for this work by the Zhejiang Yinlun Company, China are gratefully acknowledged.
[1] Asanuma, T., Kojima, K., Muramoto, H., 1997. Analysis of Mutual Thermal Effects in Radiator and Condenser Cooling. SAE Technical Paper, 1997-1774, :
[2] Dong, J.Q., 2007. Research on Air Side Flow and Heat Transfer Character of Vehicle Cooling Systems. PhD Thesis, (in Chinese), Shanghai Jiao Tong University,Shanghai, China :
[3] Dong, J.Q., Chen, J.P., Chen, Z.J., Zhang, W.F., Zhou, Y.M., 2007. Heat transfer and pressure drop correlations for the multi-louvered fin compact heat exchangers. Energy Conversion and Management, 48(5):1506-1515.
[4] Dong, J.Q., Chen, J.P., Chen, Z.J., Zhou, Y.M., Zhang, W.F., 2007. Heat transfer and pressure drop correlations for the wavy fin and flat tube heat exchangers. Applied Thermal Engineering, 27(2-3):2066-2073.
[5] Guo, Z.Y., Huang, S.Y., 2004. Field Synergy Principle and New Technique of Heat Transfer Enhancement. (in Chinese), China Electric Power Press,Beijing, China :
[6] Huang, Y.Q., 2010. The Flow and Heat Transfer Coupling Analysis and Construction Modification of Vehicular Cooling Models based on Field Synergy Principle. PhD Thesis, Zhejiang University,Hangzhou, China :
[7] Juan, T., 2008. Investigation and Assessment of Factors Affecting the Under-hood Cooling Air Flow Using CFD. SAE Technical Paper, 2008-01-2658, :
[8] Khaled, M., Mangi, F., El Hage, H., Harambat, F., Peerhossaini, H., 2012. Fan air flow analysis and heat transfer enhancement of vehicle under-hood cooling system—Towards a new control approach for fuel consumption reduction. Applied Energy, 91(1):439-450.
[9] Kim, H.J., Kim, C.J., 2008. A numerical analysis for the cooling module related to automobile air-conditioning system. Applied Thermal Engineering, 28(14-15):1896-1905.
[10] Launder, B., Spalding, D.B., 1972. Mathematical Models of Turbulence. Academic Press,London, England :
[11] Lv, F., 2010. The Investigation on Match and Design of Commercial Vehicle Cooling Module. PhD Thesis, Zhejiang University,Hangzhou, China :
[12] Ngy, S.A., 1999. A Simple Engine Cooling System Simulation Model. SAE Technical Paper, 1999-01-0237, :
[13] Ngy, S.A., Guerrero, P., Jouanny, P., 2002. Influence of Front End Vehicle, Fan and Shroud on the Heat Performance of A/C Condenser and Cooling Radiator. SAE Technical Paper, 2002-01-1206, :
[14] Uhl, B., Brotz, F., Fauser, J., 2001. Development of Engine Cooling Systems by Coupling CFD Simulation and Heat Exchanger Analysis Programs. SAE Technical Paper, 2001-01-1695, :
Open peer comments: Debate/Discuss/Question/Opinion


Open peer comments: Debate/Discuss/Question/Opinion
<1>