Feng Wu, Jing-hai Gong, Zhang Zhang. Calculation of corrosion rate for reinforced concrete beams based on corrosive crack width[J]. Journal of Zhejiang University Science A, 2014, 15(3): 197-207.
@article{title="Calculation of corrosion rate for reinforced concrete beams based on corrosive crack width", author="Feng Wu, Jing-hai Gong, Zhang Zhang", journal="Journal of Zhejiang University Science A", volume="15", number="3", pages="197-207", year="2014", publisher="Zhejiang University Press & Springer", doi="10.1631/jzus.A1300280" }
%0 Journal Article %T Calculation of corrosion rate for reinforced concrete beams based on corrosive crack width %A Feng Wu %A Jing-hai Gong %A Zhang Zhang %J Journal of Zhejiang University SCIENCE A %V 15 %N 3 %P 197-207 %@ 1673-565X %D 2014 %I Zhejiang University Press & Springer %DOI 10.1631/jzus.A1300280
TY - JOUR T1 - Calculation of corrosion rate for reinforced concrete beams based on corrosive crack width A1 - Feng Wu A1 - Jing-hai Gong A1 - Zhang Zhang J0 - Journal of Zhejiang University Science A VL - 15 IS - 3 SP - 197 EP - 207 %@ 1673-565X Y1 - 2014 PB - Zhejiang University Press & Springer ER - DOI - 10.1631/jzus.A1300280
Abstract: This paper deals with a correction method for corrosive crack width caused by non-uniform corrosion. Considering the corrosion cracking characteristics of a reinforced concrete structure, a correction model of corrosive crack width involving the mutual impacts between adjacent measuring points is established. The calculation model for steel bar corrosion rate for single point is obtained through quantitative analysis and accelerated corrosion tests on more than 70 reinforced cubic members. Two methods are suggested by combining two models, the correction and the corrosion calculation ones. electrolyte accelerated corrosion tests on seven beams are carried out to verify these methods. The experimental results show that the ratio between the maximum corrosion rate by the indirect method and the measured average value ranges from 1.4 to 2.4, and the indirect method is shown to be an effective method for calculating the maximum corrosion rate.
Darkslateblue:Affiliate; Royal Blue:Author; Turquoise:Article
Article Content
1. Introduction
When reinforced concrete is located in a chloride-rich environment, chloride ions can penetrate and diffuse through the body of the concrete and ultimately reach the steel bars and cause corrosion. Once the bars in concrete members are corroded, the volume expansion of rust generates radial tension around those bars. With the continuous development of steel corrosion, the tensile stress in the concrete gradually increases and the concrete cover will crack in a longitudinal direction until the tensile stress reaches a certain value. This so-called corrosive cracking in reinforced concrete components, as a criterion for service life, has a significant influence on the durability of reinforced concrete structures (Pantazopoulou and Papoulia, 2001). Many studies on reinforced concrete cracking caused by corrosion have been carried out, including the corrosion process of chloride ion in the concrete cover (Alonso et al., 1998; Hoseini et al., 2009; Zhang et al., 2010), security analysis of corrosive cracking (Qing and Melchers, 2005; Capozucca, 2008) and numerical simulation of performance degradation caused by corrosive cracking (Hansen and Saouma, 1999; Chen and Mahadevan, 2008), etc. In current research the steel corrosion rate is usually taken as the main parameter and also as an independent variable in calculation models for the performance degradation of the reinforced concrete structure. Since it is difficult to directly measure the corrosion rate of steel in reinforced concrete structures, there are some non-destructive test methods available, such as electrochemical techniques (Andrade and Alonso, 2001; Montemor et al., 2003; Elsener, 2005), radar measurement techniques (Rhazi et al., 2000), etc. However, the accuracy of measured corrosion rate within each micro-segment using non-destructive testing is still not good, resulting in uncertainties in the prediction of the residual service life of a reinforced concrete structure.
The corrosive cracking is more likely to be observed than the mass loss of the steel. The relationships between corrosion rate and corrosive crack width can be established based on experimental results (Alonso et al., 1998; Thoft-Christensen, 2000; Vidal et al., 2004), serving as a non-destructive prediction method of performance degradation for corrosive reinforced concrete structures.
Existing studies have concentrated on the maximum value of the corrosive crack width without considering the impact of the concrete nearby. Alonso et al. (1998) established a corrosion rate calculation method based on the maximum corrosive crack. Vidal et al. (2004) corroded beams naturally for periods up to 17 years to propose a model relating crack width to the corresponding reinforcement weight loss on the basis of the test results for cracking and corrosion penetration. In these studies, it is worth noting that only the maximum value of the crack length at all the measure points is adopted, and the actual corrosion phenomena cannot be accurately described, as steel corrosion is usually non-uniform along the steel bar. Furthermore, concrete along the longitudinal direction of the steel bar may not be all the same in quality and the potential maximum value should not be based upon a single point because the crack width at a specific measure point may be overrated or underrated.
Malumbela et al. (2010) studied non-uniform corrosion based on the rate of percentage gravimetric mass loss of a steel coupon of 50–100 mm in length. After cleaning rust at the end of the corrosion test, the results showed that in the case of non-uniform corrosion, the ratios between the maximum mass loss of steel and the average values were from 1.2 to 1.9. However, the calculation method for the corrosion rate based on crack width was not provided.
In this paper, a correction model of corrosive crack width considering the impact between adjacent measuring points, and calculation model for corrosion rate of single point based on crack width will first be established. Based on the two models above, the calculation of corrosion rate for beams based on corrosive crack width in the case of non-uniform corrosion is established. Several identical beams are corroded by an electrolyte accelerated corrosion test to verify the accuracy of the calculation method.
2. Correction model of corrosive crack width
Previous researchers, such as Alonso et al. (1998) and Vidal et al. (2004), always take one cross section, especially in the position of the maximum crack width measured, as the research object generally, and rarely consider longitudinal variation. However, steel corrosion in reinforced concrete is non-uniform in nature. Differences in the corrosion of the steel along the longitudinal direction may impact upon the internal force and deformation of the surrounding concrete, leading to inaccurate calculations. As for corrosive reinforced concrete beams, the maximum crack width at different measuring points is generally adopted; however, little attention has been paid to research on interaction between adjacent measuring points. Once the reinforcement bar corrodes and then the concrete cracks at a certain point, points adjacent to the corrosion point will have an influence on the corrosion crack. Thus, it may be unreasonable to determine the corrosion rate according to the crack width at a single measuring point. With the measured crack widths at all the measuring points, points with larger crack width can be regarded as the “dangerous points” in accordance with the following principles:
The measured crack width at the measuring point should be greater than those at the two adjacent measuring points and greater than the average value of the crack width at all the measured points along the same crack;
If the measured values at all points are approximate, the three measured points with maximum measured values should be chosen. To take account of the heterogeneity of concrete, measuring points should be evenly distributed along the crack.
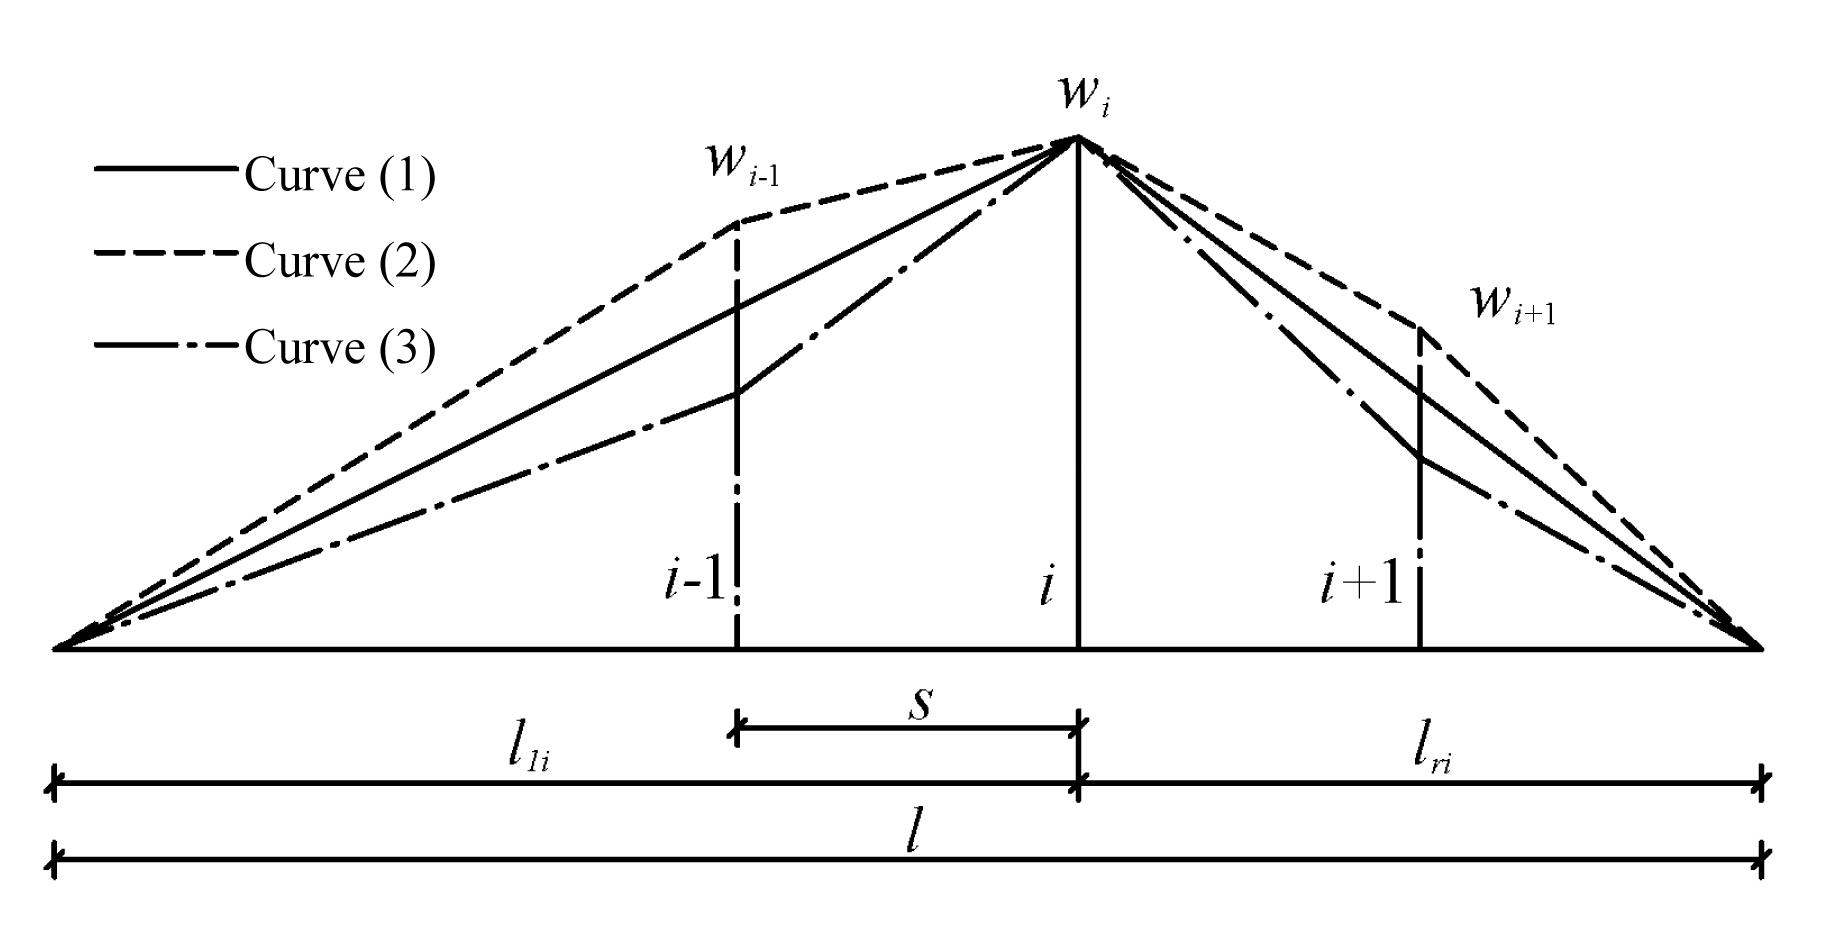
Assuming that point i denotes the dangerous point, and its adjacent points are regarded as point i−1 and point i+1, as shown in Fig. 1, the corrosive crack length of the longitudinal direction is l (curved crack length takes the projective straight-line distance value along the beam axis). Assume that the measured crack width at point i is the maximum, according to crack width measurements. The left and right adjacent measuring points are i−1 and i+1 while the crack widths at the three measuring points are wi−1, wi, and wi+1, respectively. The distances from point i to the end of the corrosive crack are lli and lri, respectively, the distance of the measuring points is assumed to be equal to s, and that can be determined based on the requirement for precision: to increase accuracy the more uneven the longitudinal crack width is, the smaller the distances adopted; however, excessively short distances will greatly increase the workload.
Fig.1 Correction model of crack width at the dangerous point
If point i is subjected to cracking in concrete cover due to corrosion, other measuring points are assumed to approximately obey the linear law, as shown in Fig. 1. If all measuring points are corroded:
(1) When and , as curve (2), the point i is subjected to lesser constraints from adjacent points, wi can extend with freedom, and the corrosion rate at point i is likely to be overrated. Then the member is likely to be safe and wi need not be revised.
(2) When and , as curve (3), the point i is subjected to greater constraints from adjacent points, wi cannot extend freely, and the corrosion rate of point i is likely to be underrated, thereby resulting in reduction of safety.
When the second case happens, in order to ensure the safety of components, the measured crack width at point i should be amplified. The difference between linear crack width distribution at point i−1 (or i+1) and the measured value of wi−1 (or wi+1) is to be regarded as the limited crack width at point i, which plus wi is the revised width at point i:
.
(3) When and , or and , only take one side into account:
,
or
where wi' is the revised value of crack width at point i.
3. Calculation model for corrosion rate of single point based on crack width
3.1. Geometric model obtained by theoretical deduction
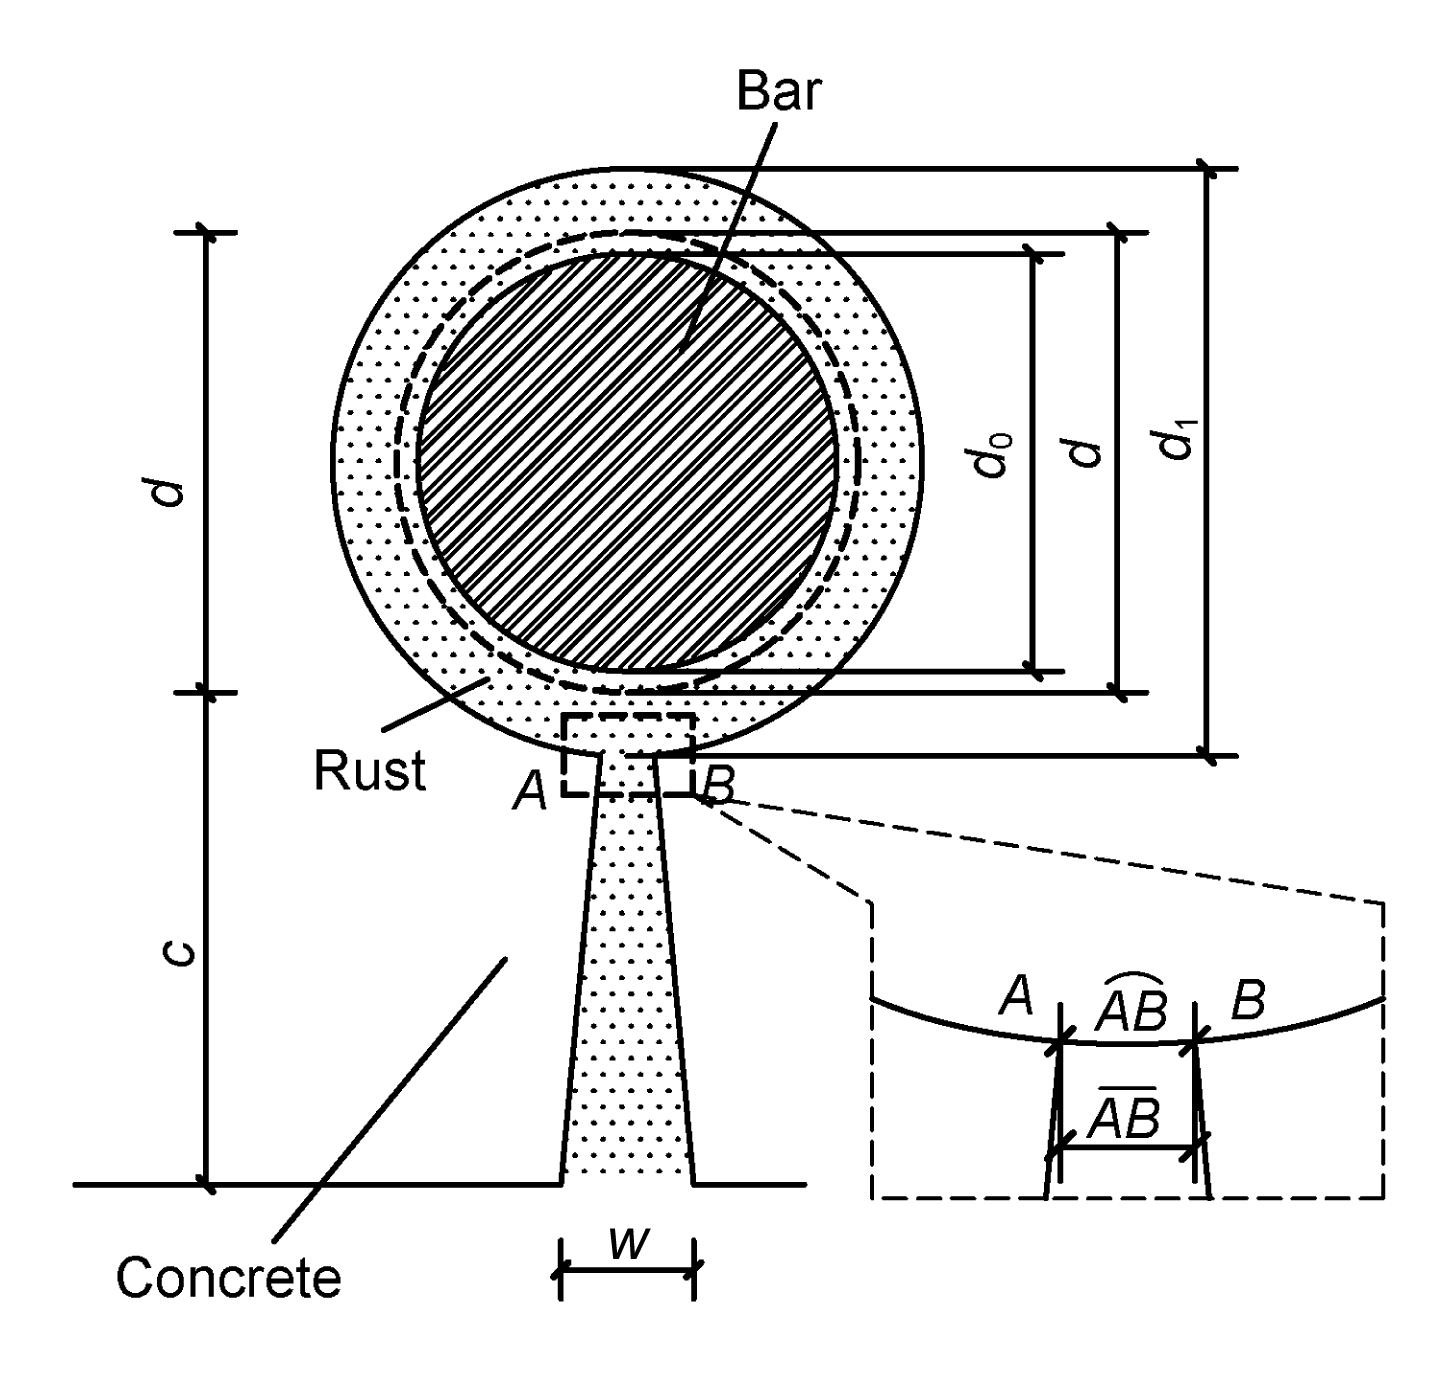
The volume expansion of rust can be calculated as an expansion coefficient (Kumiko et al., 1993). Val et al. (2009) studied the phenomenon of corrosion products penetrating concrete pores and cracks through an investigation of the thickness of the porous zone and the extent of the corrosion products that penetrate into cracks. To consider the effect of corrosion outflow from pore and crack, a reduction factor is introduced. It is assumed that the rust fills the crack and pore, and then outflows along the crack, as shown in Fig. 2. Steel corrosion is a time-based occurrence, i.e., corrosion rate is a function of the time. However, this study deals with establishing the relationship between corrosion rate and corrosive crack width after cracking, and the problem of time impact has been transformed into the crack width growth problem. Therefore, the proposed model, which excludes the time parameter, is established as a geometric model to relate the rust, the pores, and the cracks.
Fig.2 Calculation model of the corrosive crack width and corrosion rate
On the assumption that the permeability properties of concrete, tensile strength, elastic modulus, and other factors have little impact on the cracking growth, and the rust discharges from the ladder part only. To consider the effect of corrosion outflow from pore and crack, a reduction factor is introduced. According to the constant volume (area), there is:
,
that is,
,
where Vc is the corroded expansion volume, Vr is the corroded expansion volume of the ring part, and V1 is the corroded expansion volume of the ladder part. k is the outflow reduction factor of rust, and various constants are taken according to their locations (i.e., the atmospheric zone, the splash zone, underwater zone, etc.). w is the corrosive crack width. n is the coefficient of rust volume expansion, takes 2.5 to 4 under normal atmospheric conditions, takes 1.1 to 1.8 under the conditions of rapid electrochemical corrosion, and takes 2.9 to 3.2 under alternating wet and dry conditions of a marine environment (Kumiko et al., 1993). ρ is the corrosion rate calculated by the mass loss of steel, and c is the thickness of the concrete cover. d is the original diameter of the steel bar, d0 is the residual diameter of the steel bar, and d1 is the nominal diameter of the steel bar. The action lines of the radial corrosion expansion force intersect at the centroid of the steel bar, so the interfaces of cracking intersect at the centroid. The micro-segment arc length () of cracking is approximately instead of straight line length () as shown in Fig. 2. According to constant volume (area), we can obtain:
,
that is,
.
According to Eq. (5), we have
,
where it is assumed that d1−d=0 as π(d+2c)≫w, but d12−d2 retains.
Note that Eq. (8) is established upon the premise of the calculation model of Fig. 2, which is only valid when corrosive crack happens.
3.2. Electrolyte accelerated corrosion test on reinforced block members
When measured values are revised according to the correction model of corrosive crack width, the corrosion rate ρ can be obtained by Eq. (8) in the event that k is a certain quantity. Similarly, if k is a known quantity, ρ can be calculated by Eq. (8). Therefore, the ρ-w relation is extremely critical to the calculation method.
3.2.1. Specimen configuration and material properties
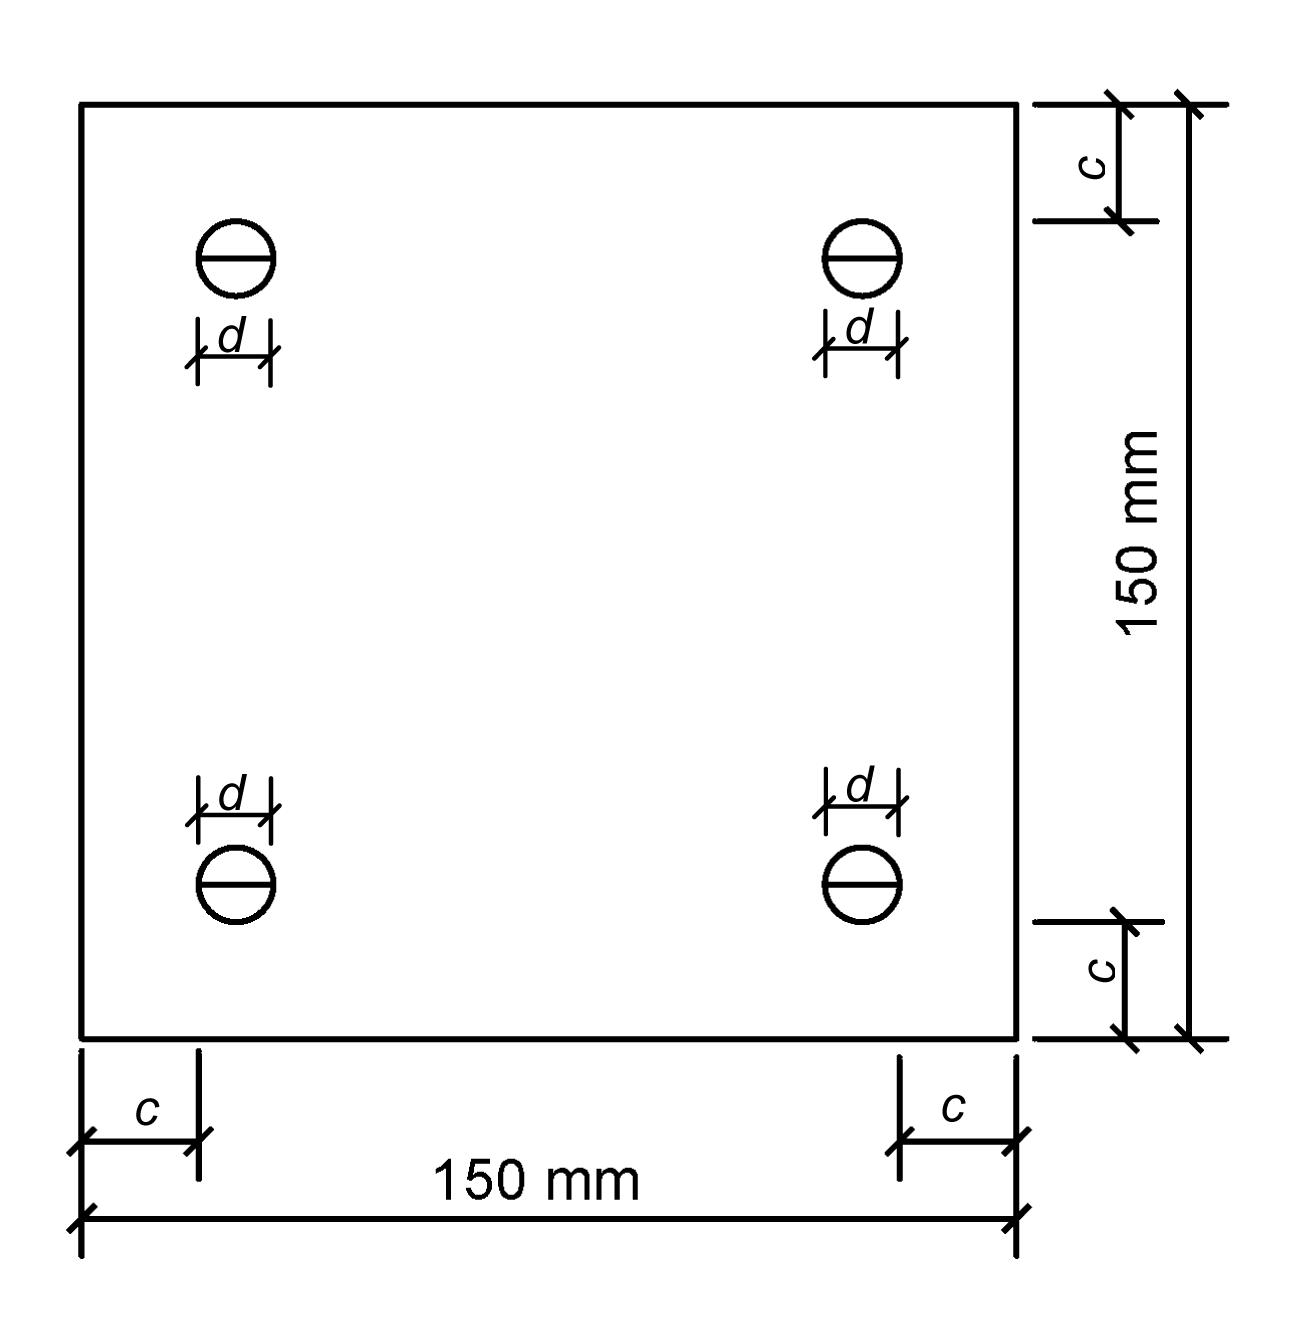
Accelerated corrosion by an electrochemical method has been taken to obtain a simple ρ-w formula, as well as the value of the reduction factor. There is one steel bar penetrating each corner of the cubic specimen (Fig. 3). The cubic specimen is 150 mm in length. For the shorter length of the bar in the cubic specimen, it can be approximately considered as uniform corrosion (Malumbela et al., 2010). The concrete strength grade is C35, and the diameter of steel bar, d, is divided into three categories: 16 mm, 20 mm, and 25 mm, as well as the thickness of concrete cover (denoted as c): 25 mm, 30 mm, and 35 mm.
Fig.3 Dimensions and reinforcement of specimen
3.2.2. Electrolyte accelerated corrosion and crack measurements
More than 70 specimens were immersed in 5% (in volume) NaCl solution for 3 d and then electrified with a current density of 1 mA/cm2 as shown in Fig. 4. All the specimens were corroded in batches, over periods from 5 d to 15 d. After several days there was one corrosive crack corresponding to every bar. We measured the crack width of specimens by using a crack width gauge after electrifying. Three measurements of crack were measured in the ends and the mid-span of each crack, and the average value was taken as the eigenvalue. The corroded bars were taken out after measuring the crack width, with rust removed according to ASTM G1-03 standard (2003) to obtain the mass loss of steel denoted as the average corrosion rate after weighing.
Fig.4 Installation and connection for experiment
3.2.3. Results and analysis
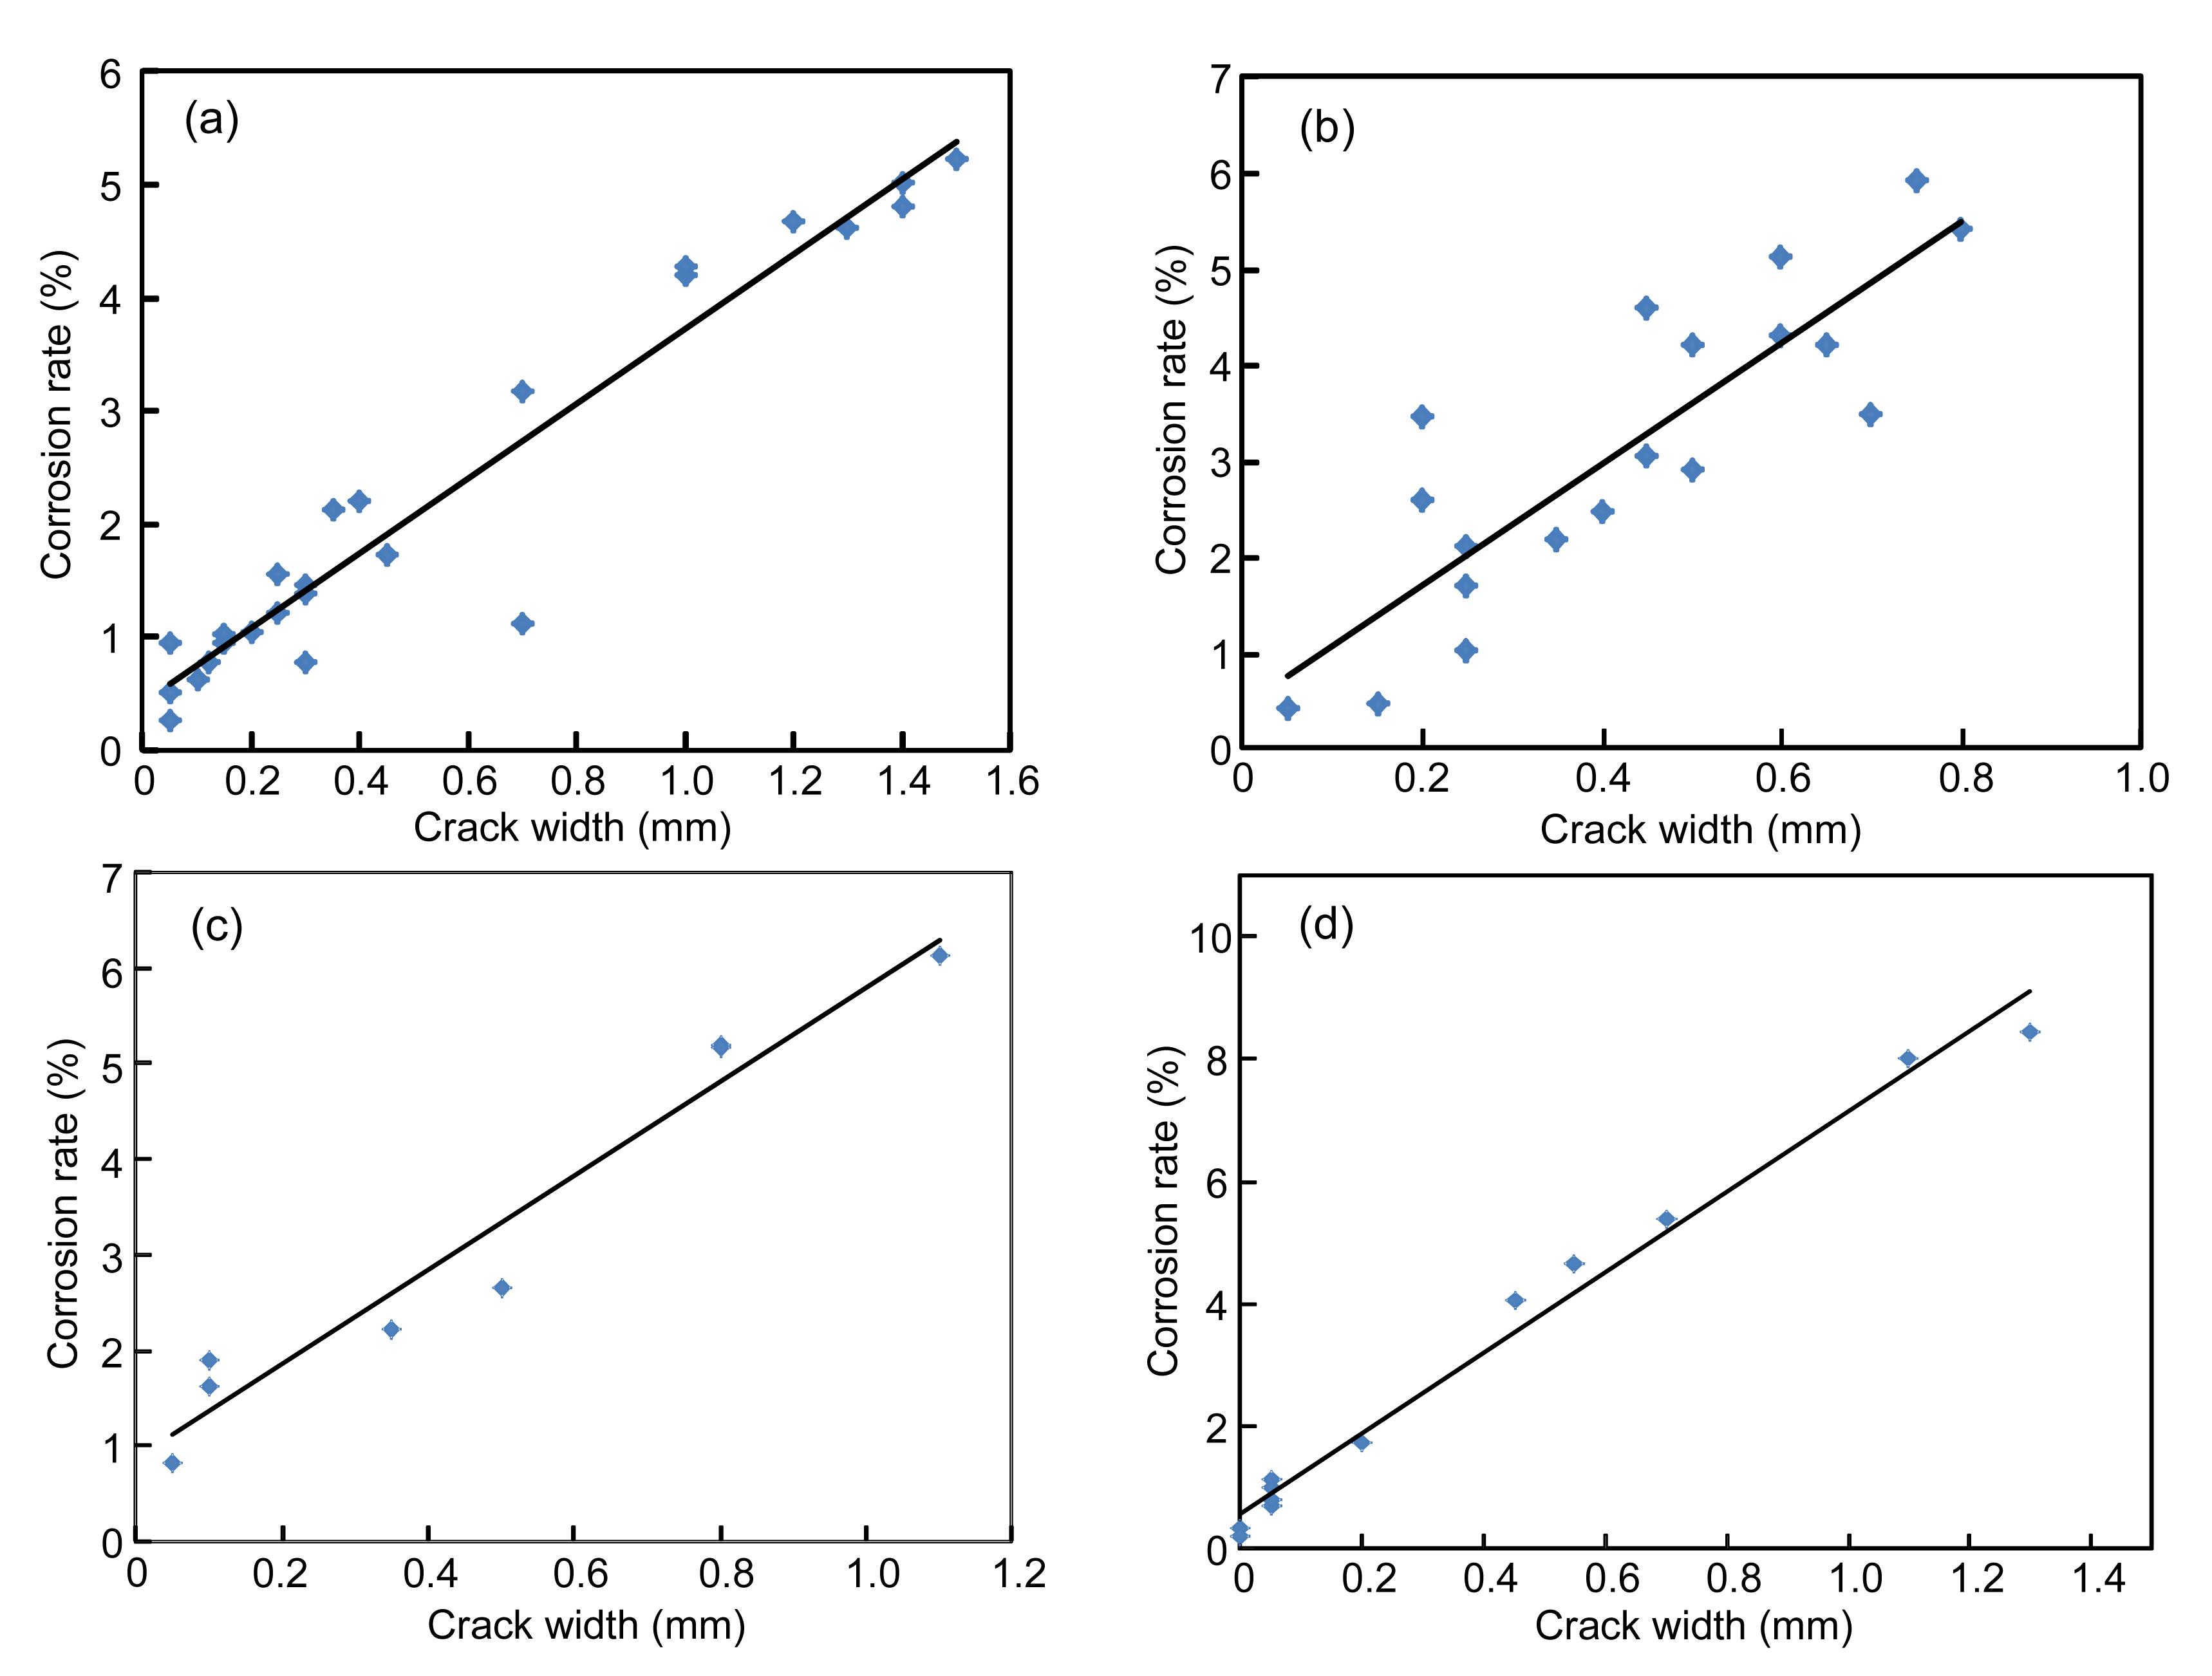
According to the results, the ratio of cover thickness and reinforcement diameter has the greatest impact on the test results. The relationship between crack width and corrosion rate is shown in Fig. 5. It is shown that the corrosion rate increases approximately linearly with the increase of the crack width which is consistent with Eq. (9).
Fig.5 ρ-w relationship of single point from test results (a) c/d=1.00; (b) c/d=1.56; (c) c/d=1.88; (d) c/d=2.19
Substituting the test results into Eq. (8), the simple direct relationship between ρ and w can be obtained:
,
,
,
.
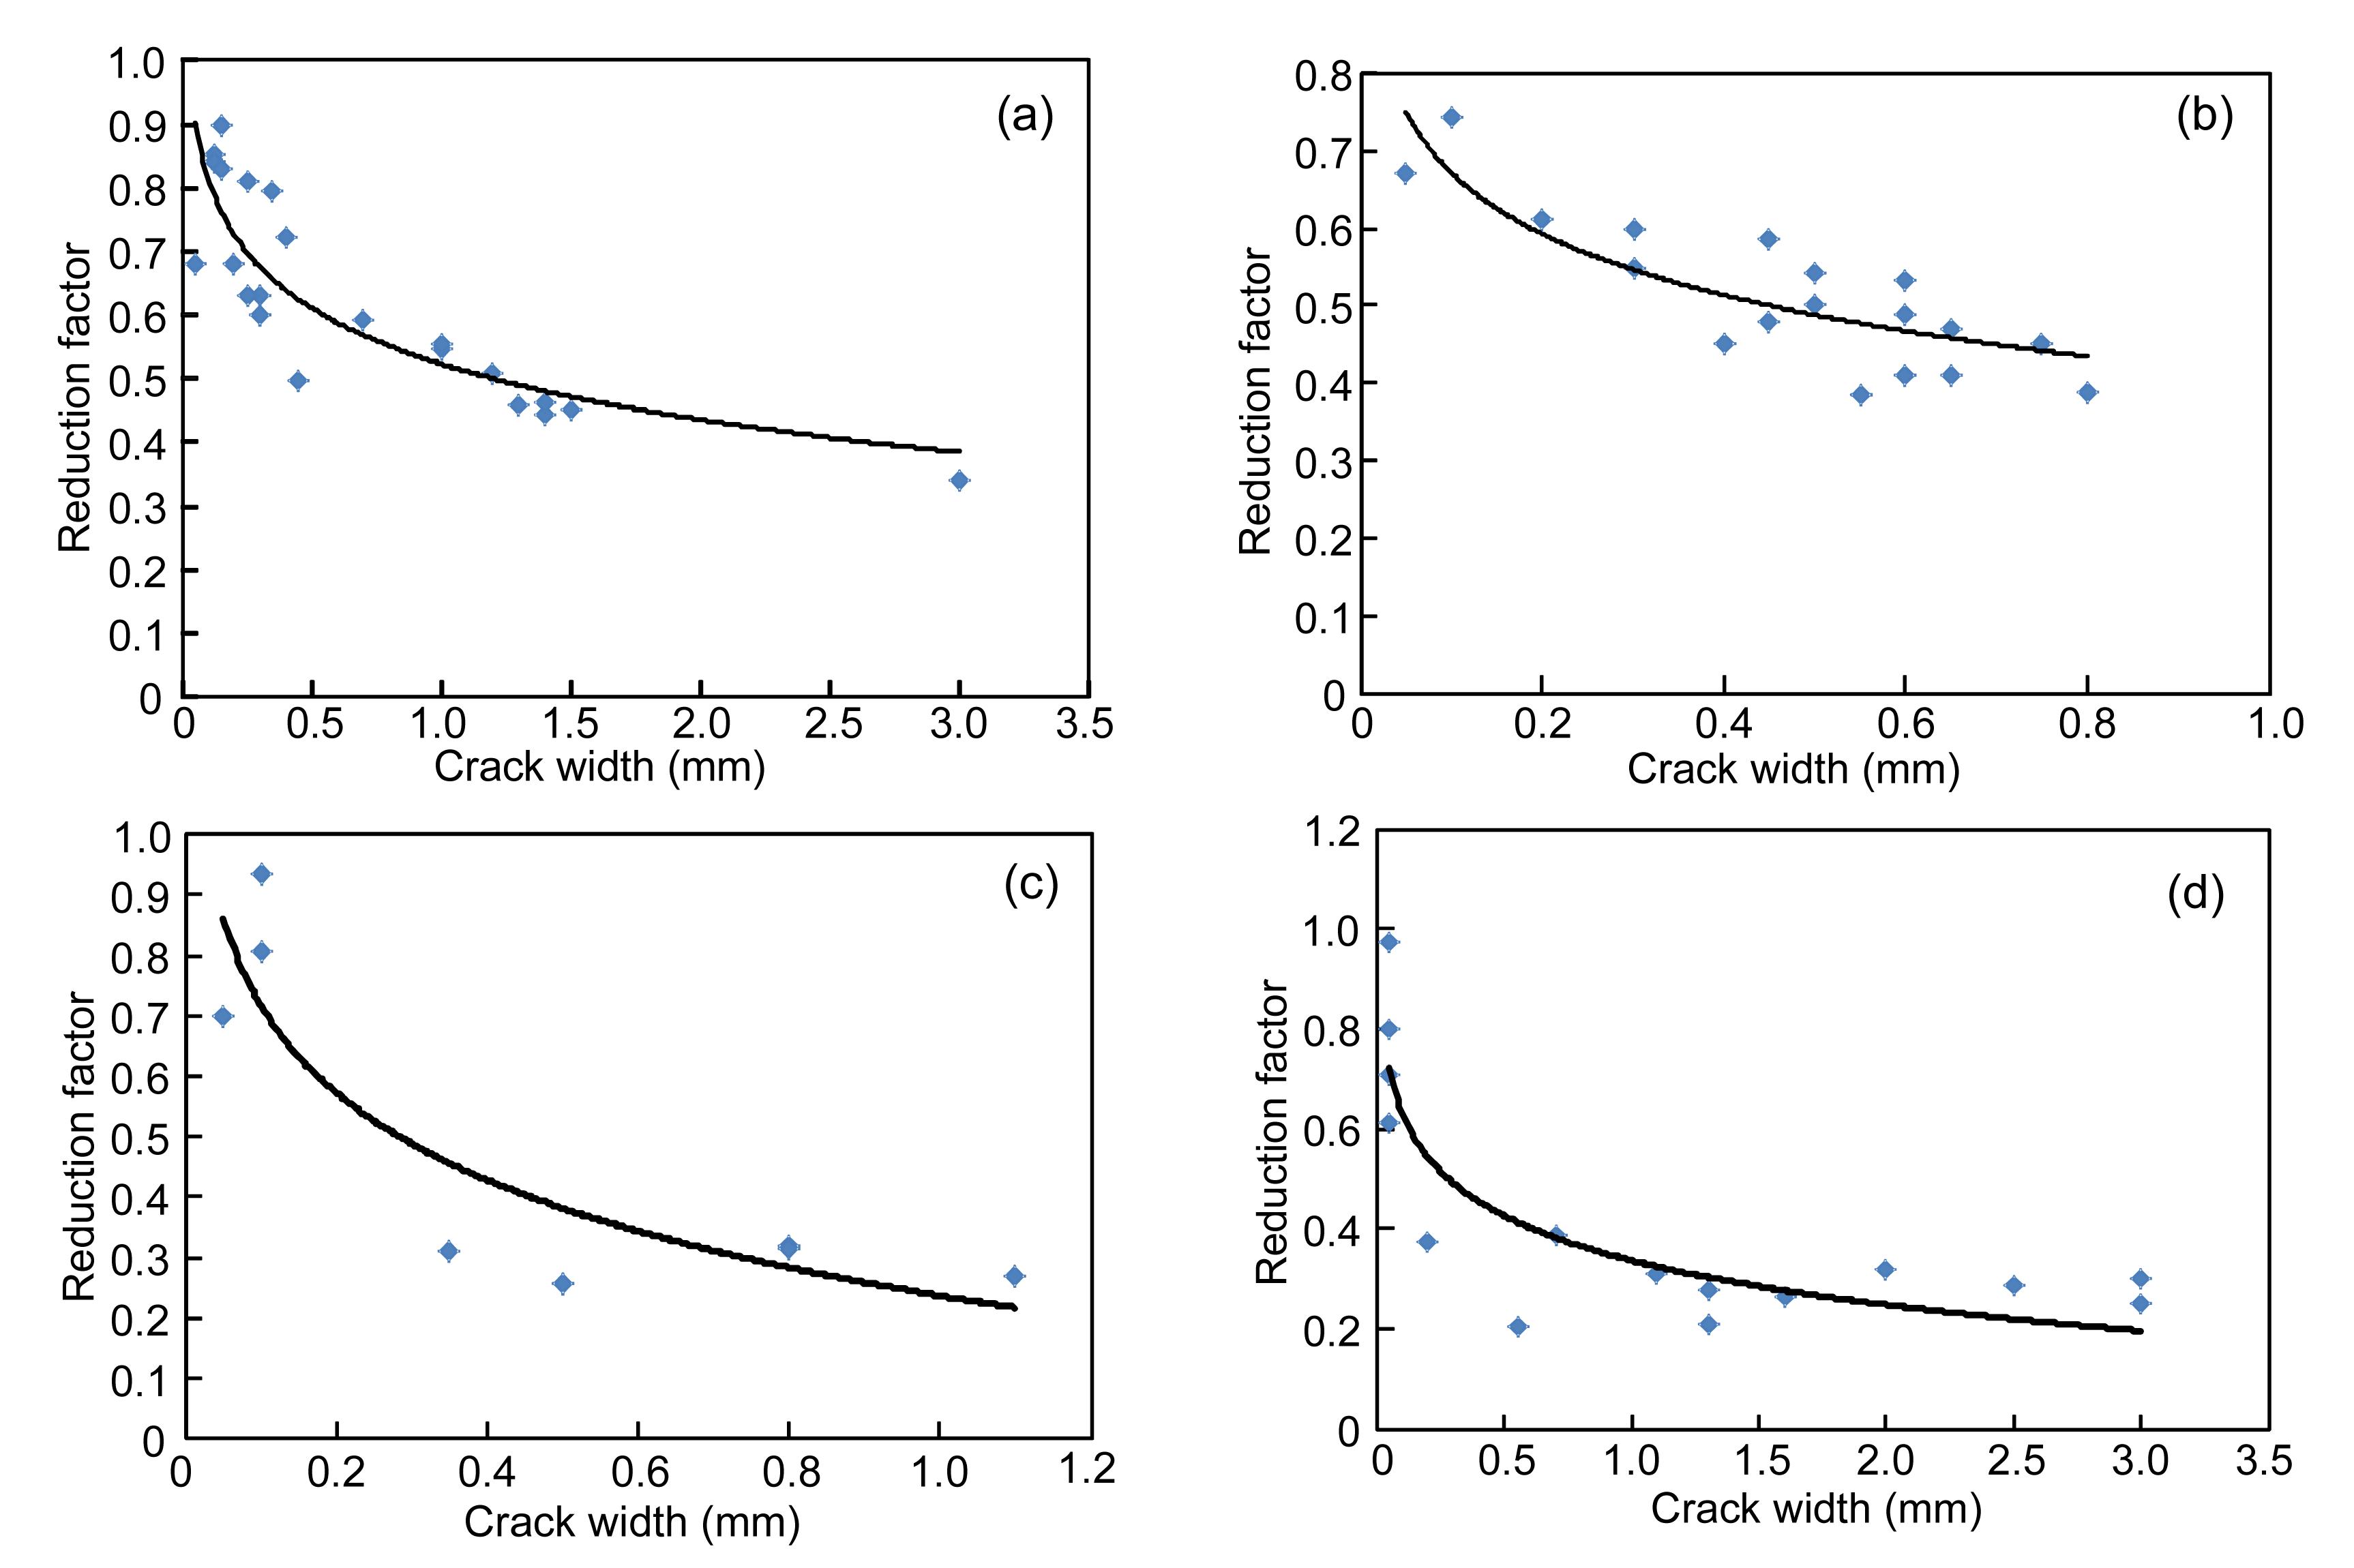
When c/d is not equal to any value above, the linear interpolation between two adjacent values should be adopted. Meanwhile, after substituting the test results into Eq. (10), the coefficient of rust volume expansion n is 1.45 (Kumiko et al., 1993), and the relationship between k and w is calculated according to test results as shown in Fig. 6.
Fig.6 Outflow reduction factor of rust calculated according to test results (a) c/d=1.00; (b) c/d=1.56; (c) c/d=1.88; (d) c/d=2.19
Corrosion is approximately uniform when the length of the steel bar is limited and, as can be seen from Fig. 6, as the crack width increases, the k values show a decreasing trend. The outflow reduction factor of rust, k, can be calculated as follows:
,
,
,
.
Although the function types of the Eq. (12) and Eq. (10) are different, Eq. (12) meets the accuracy requirements under normal conditions as a simplified fitting formula. When the crack width increases to a certain extent, as 3.0 mm, especially when steel bar is exposed to the open air or concrete cover peels off, Eq. (11) will no longer apply.
Different surroundings around the reinforcement have an impact on k, such as the underwater zone, splash zone, and atmospheric zone. When the reinforcement is in the splash zone, the wave wash easily drives the rust out, holding k at a lower level. When the reinforced concrete is exposed to the atmosphere, it is difficult for rust to flow out on account of the relative dryness of concrete exposed above the water, so the k value is larger. While the reinforced concrete is exposed in the underwater zone, k under hydrostatic immersion has a value between the aforementioned two.
4. Accelerated corrosion test of beams
4.1. Test beams configuration
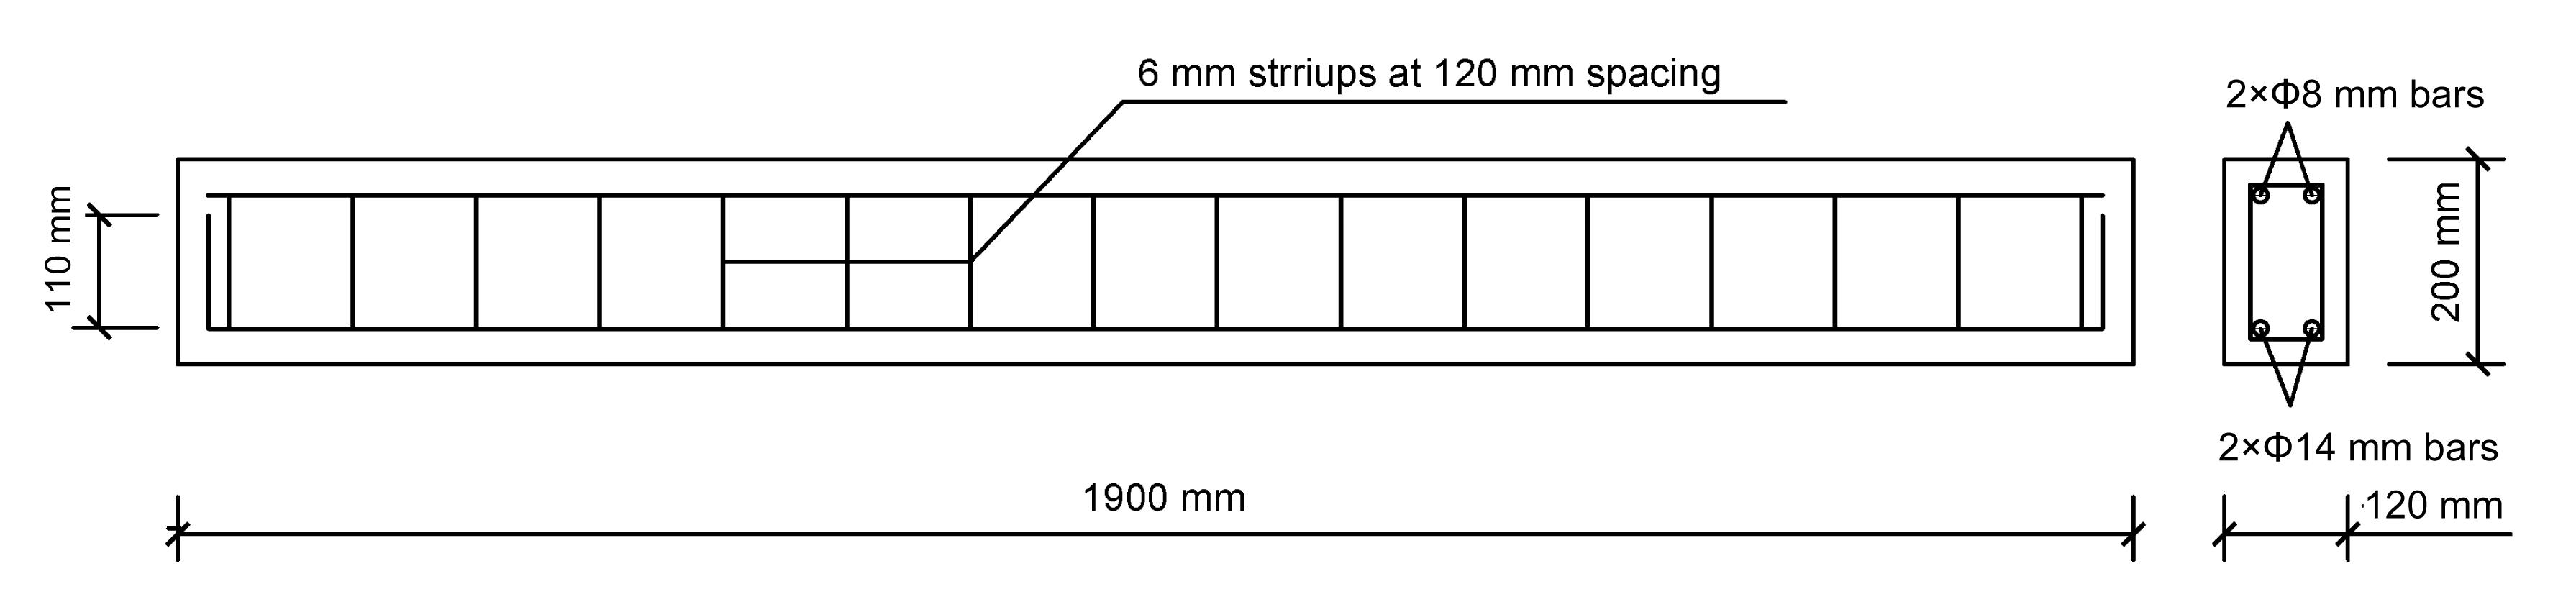
To verify the calculation methods above, seven reinforced concrete beams with C35, denoted as B-1–B-7, are produced as shown in Fig. 7. The reinforcement diameter d is 14 mm, and the concrete cover thickness c is 30 mm. The two bars in the bottom of each beam were weighed before lashing reinforcement. Stirrups were insulated to avoid sharing current, as shown in Fig. 8, and each bottom bar was wired outside the beam, as shown in Fig. 9.
Fig.7 Reinforcement plan for reinforcement concretes
Fig.8 Insulating stirrup from the bar
Fig.9 Pre-wired cable of the bar
4.2. Accelerated corrosion
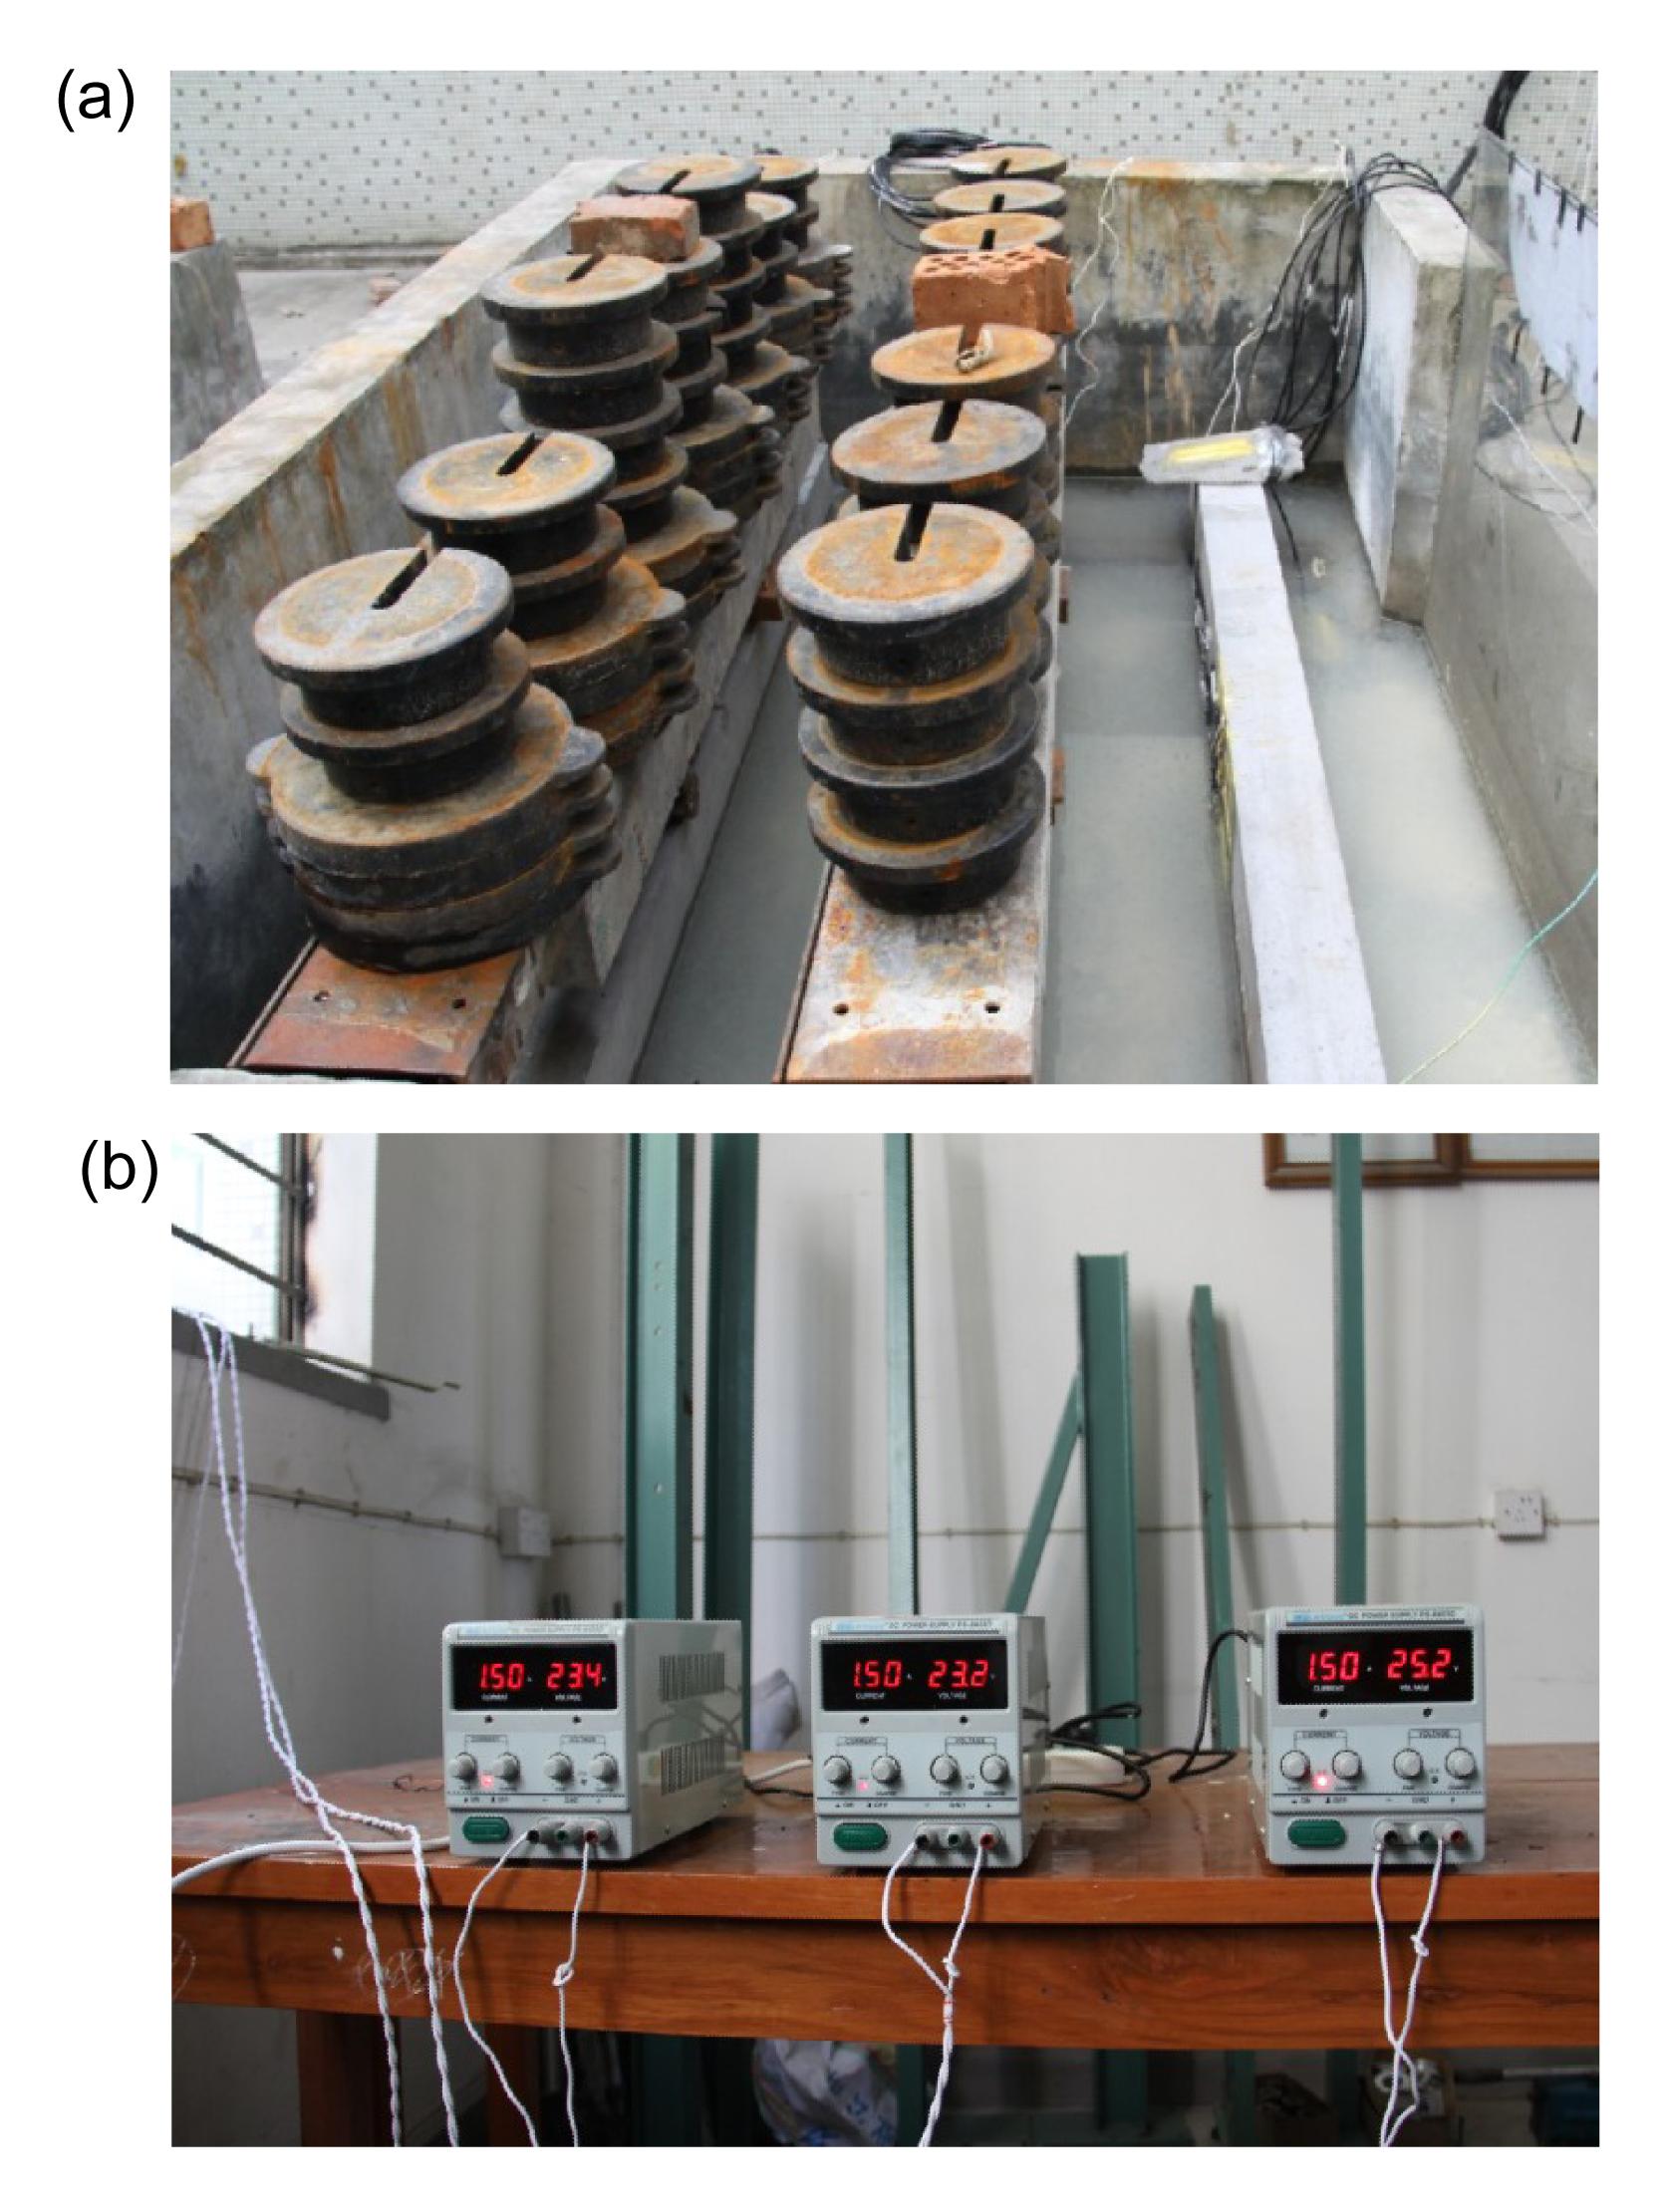
All the seven beams were immersed in 5% (in volume) NaCl solution for 3 d. Based on Faraday’s law, longitudinal bars in the bottom of each beam were corroded after electrolyte accelerated corrosion test with a current intensity of 1.5 A. All the specimens were corroded in batches, with the duration from 7 d to 13 d. Simultaneously with the accelerated corrosion progress, specimens were subjected to consecutive loading, as 0%, 50%, and 70% cracking load of beam, to simulate the actual conditions of the beams. The beam is subjected to bending by consecutive loading, as shown in Fig. 10.
Fig.10 Electrolyte accelerated corrosion test (a) Accelerated corrosion under load; (b) DC power supply
4.3. Test results
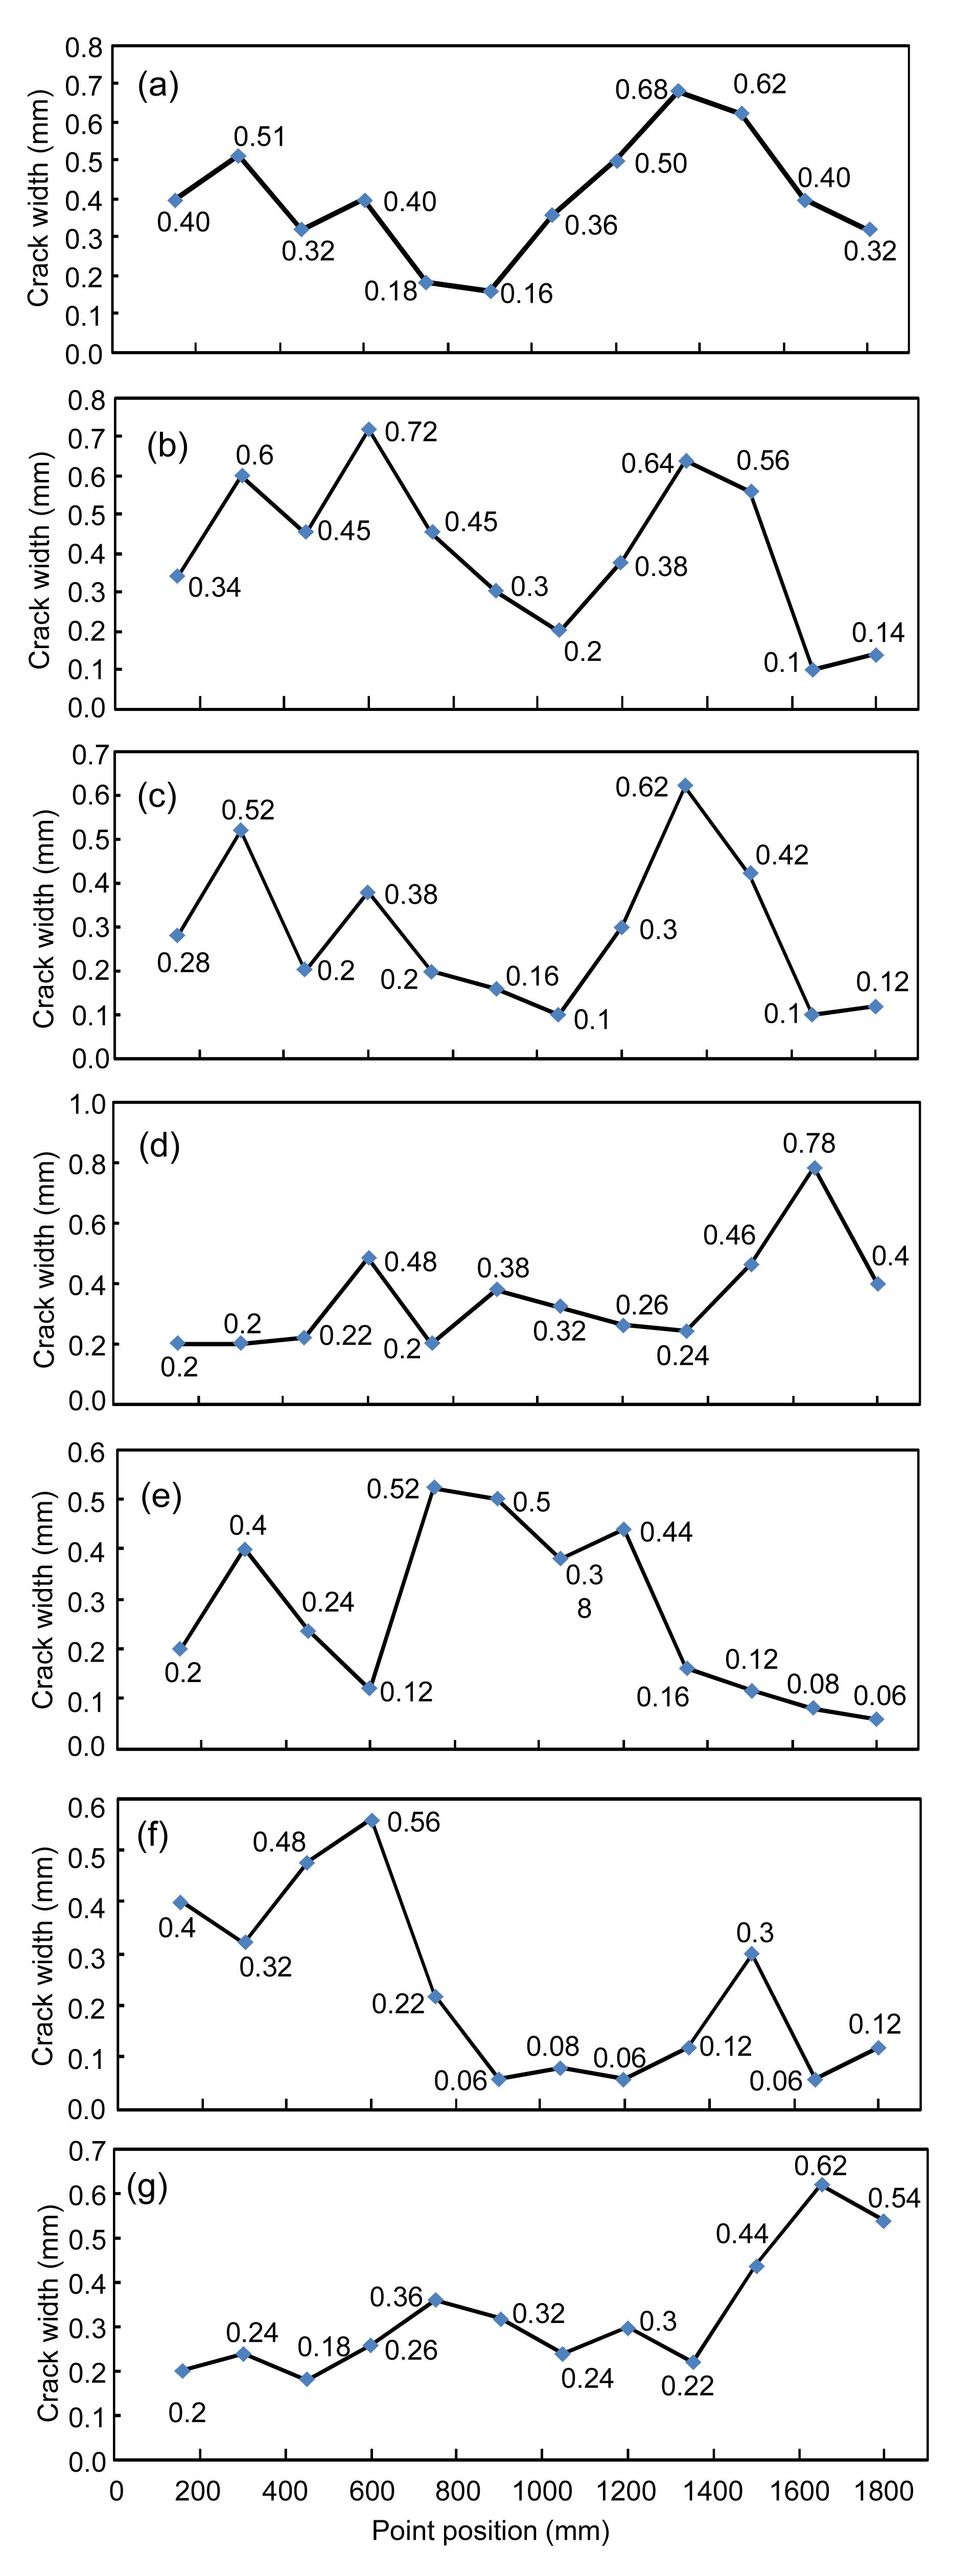
The beams were dried in air after removal from the pool. The results showed that, on the side face or underside of each beam, there is one corrosive cracking corresponding to each reinforcement. We arranged a measuring point for every 150 mm along the beam from the one end of the beam to measure the crack width by using crack width gauge. Fig. 11 shows the measuring points corresponding to those crack widths on the side face or extreme tensile face.
The results showed that, with the measuring point spacing of 150 mm, the crack width measured values are random, and there is no obvious relationship between the maximum crack width and its location. If necessary, the measurement can be set to a smaller spacing in order to obtain more accurate results.
Fig.11 Distribution curves of measuring points based on crack width (a) B-1; (b) B-2; (c) B-3; (d) B-4; (e) B-5; (f) B-6; (g) B-7
4.4. Calculation method validation
Based on the principles mentioned in the previous section, three measuring points are selected as dangerous points for each beam, with s=150 mm. Accordingly the locations of the measuring points, lli and lri are substituted into Eqs. (1), (2) and (3) to obtain the revised values for crack width wi'.
There are two methods for calculating the maximum mass loss of steel, which can be respectively defined as a direct or an indirect method:
Direct method: with substitution of wi' into Eq. (11);
Indirect method: with substitution of wi into Eq. (12) to obtain ki, and then with substitution of revised wi' into Eq. (8), with n=1.45.
According to the two methods described above, the corrosion rates at dangerous points of all seven test beams are calculated. The corrosive reinforcements are taken out after the experiment, and the rust removed according to the standard ASTM G1-03 (2003) to obtain the average mass loss of reinforcement after weighing, and the corrosion rates are also calculated according to Alonso et al. (1998), as shown in Table 1.
Table 1
Comparison between calculated and average test values of corrosion rate
Malumbela et al. (2010) suggested that the ratio between the maximum and the average value of the corrosion rate under non-uniform corrosion is 1.2 to 1.9. The calculated maximum corrosion rate by the direct method is close to the measured average values as shown in Table 1. Therefore, it may be dangerous to use the direct method, since Eq. (11) is based on several cubic specimens whose corrosion conditions, especially the current density, were different from those for the seven beams. The direct method can only be correctly used to calculate the corrosion rate when the two kinds of experiments have the same rust expansion coefficient n. Therefore, the direct method does not make any sense in practical engineering. Again, the corrosion rate calculated by Alonso et al. (1998) is also lower when compared to the measured value. This must be for the same reason as the method suggested by Alonso et al. (1998) is another direct method.
It can be seen from Table 1 that the maximum calculated values of the corrosion rate by the indirect method are larger than the measured average values, and the ratio between the maximum value and the measured average value ranges from 1.4 to 2.4, which is similar to Malumbela et al. (2010). The indirect method calculates the outflow reduction factor k firstly, which is based on the crack width only. As long as an accurate n is taken, the corrosion rate calculated by the indirect method can be accurate. The expansion coefficient n, related to the composition of corrosion products, is a good basis for further research.
5. Conclusions
In this paper, the concept of a danger point was proposed, and the correction model of corrosive crack width by consideration of the mutual impacts between adjacent measuring points was firstly established. Secondly, the calculation model of steel bar corrosion rate for a single point was obtained by quantitative analysis and accelerated corrosion tests on more than 70 reinforced cubic members. A linear relationship between crack width and corrosion rate was found, with the slope based on the particular test. Simplified calculating methods defined as direct and indirect methods were respectively suggested combining the correction model of crack width and the corrosion calculation model for a single point. Finally, an electrolyte accelerated corrosion test on seven reinforced concrete beams was carried out to verify these two methods. The experimental results indicate that the ratio between the maximum corrosion rate by the indirect method and the measured average value ranges from 1.4 to 2.4, which is of high accuracy and justifies further research along these lines in this area.
[1] Alonso, C., Andrade, C., Rodriguez, J., 1998. Factors controlling cracking of concrete affected reinforcement corrosion. Materials and Structures, 31(7):435-441.
[2] Andrade, C., Alonso, C., 2001. On-site measurements of corrosion rate of reinforcements. Construction and Building Materials, 15(2-3):141-145.
[3] ASTM G1-03, 2003. Standard Practice for Preparing, Cleaning, and Evaluating Corrosion Test Specimens. Annual Book of ASTM Standards, 03-02:17-26.
[4] Capozucca, R., 2008. Detection of damage due to corrosion in prestressed RC beams by static and dynamic tests. Construction and Building Materials, 22(5):738-746.
[5] Chen, D., Mahadevan, S., 2008. Chloride-induced reinforcement corrosion and concrete cracking simulation. Cement and Concrete Composites, 30(3):227-238.
[6] Elsener, B., 2005. Corrosion rate of steel in concrete-measurements beyond the Tafel law. Corrosion Science, 47(12):3019-3033.
[7] Hansen, E.J., Saouma, V.E., 1999. Numerical simulation of reinforced concrete deterioration: part II – steel corrosion and concrete cracking. ACI Materials Journal, 96(3):331-337.
[8] Hoseini, M., Bindiganavile, V., Banthia, N., 2009. The effect of mechanical stress on permeability of concrete: a review. Cement and Concrete Composites, 31(4):213-220.
[9] Kumiko, S., Ssdhir, M., Kenichi, M., 1993. Corrosion products of reinforcing bars embedded in concrete. Corrosion Science, 35(5-8):1543-1549.
[10] Malumbela, G., Alexander, M., Pilate, M., 2010. Interaction between corrosion crack width and steel loss in RC beams corroded under load. Cement and Concrete Research, 40(9):1419-1428.
[11] Montemor, M.F., Simões, A.M.P., Ferreira, M.G.S., 2003. Chloride-induced corrosion on reinforcing steel: from the fundamentals to the monitoring techniques. Cement and Concrete Composites, 25(4-5):491-502.
[12] Pantazopoulou, S.J., Papoulia, K.D., 2001. Modeling cover-cracking due to reinforcement corrosion in RC structures. Journal of Engineering Mechanics, 127(4):342-351.
[14] Rhazi, J., Laurens, S., Ballivy, G., 2000. Insights on the GPR non destructive testing method of bridge decks. , Special Session on Non Destructive Detection of Corrosion in Reinforced Concrete, ACI Meeting, Toronto, Canada, :
[15] Thoft-Christensen, P., 2000. Modeling of the deterioration of reinforced concrete structures. , Proceedings of IFIP Conference on Reliability and Optimization of Structural Systems, Ann Arbor, Michigan, USA, 15-16. :15-16.
[16] Val, D.V., Chernin, L., Stewart, M.G., 2009. Experimental and numerical investigation of corrosion-induced cover cracking in reinforced concrete structures. Journal of Structural Engineering, 135(4):376-385.
[17] Vidal, T., Castel, A., Francois, R., 2004. Analyzing crack width to predict corrosion in reinforced concrete. Cement and Concrete Research, 34(1):165-174.
[18] Zhang, R., Castel, A., Franois, R., 2010. Concrete cover cracking with reinforcement corrosion of RC beam during chloride-induced corrosion process. Cement and Concrete Research, 40(3):415-425.
Open peer comments: Debate/Discuss/Question/Opinion


Open peer comments: Debate/Discuss/Question/Opinion
<1>