1. Introduction
Products of
Ginkgo biloba leaf extracts are used routinely in prescription drugs and dietary supplements in many countries. They play an important role in treating cardiovascular diseases and neurological disorders (Diamond et al.,
2000). Many dosage forms of
G. biloba leaf extracts have been documented in Chinese Pharmacopoeia (Chinese Pharmacopoeia Commission,
2010), such as tablets, capsules, and dripping pills.
Ginkgo biloba tablets (GBTs) have been used for the clinical treatment of many conditions and diseases, such as stroke (Loh et al.,
2006; Zhang et al.,
2012), Alzheimer’s disease (Stackman et al.,
2003), and cardiac angina (Xu and Xu,
2011).
Flavonols and terpene lactones are considered to be the main bioactive compounds in GBTs (Deng and Zito,
2003). Bilobalide (BB), ginkgolide A (GA), ginkgolide B (GB), ginkgolide C (GC), quercetin (QCT), kaempferol (KMF), and isorhamnetin (ISR) are the main compounds for quality control (QC) of GBTs. Flavonols in
G. biloba leaf extracts have been proven to have scavenging free radical effects (Ellnain-Wojtaszek et al.,
2003), and terpene lactones are platelet-activating factor (PAF) antagonists (Korth et al.,
1988). Du et al. (
2013) studied the biological effects of bioactive compounds in GBTs and showed that the flavonols, mainly including QCT, KMF, and ISR, have remarkable antioxidant effects, and terpene lactones have anti-platelet aggregation activity.
Recent studies have used various methods to determine the components of
G. biloba extracts. Chen et al. (
2010) and Hu et al. (
2010) developed a high-performance liquid chromatography (HPLC)-ultra violet (UV) method to study the pharmacokinetics of QCT, KMF, and ISR in rat plasma. However, these studies could identify only the flavonol components. The HPLC-UV method is also not sensitive enough to apply to pharmacokinetic studies at clinical equivalent doses. Liquid chromatography-mass spectrometry (LC-MS) is an effective solution for complex matrix samples and is often used to study pharmacokinetics because of its high sensitivity and specificity. Xie et al. (
2008) and Jin et al. (
2011) successfully used an HPLC-tandem mass spectrometry (MS/MS) method to study the pharmacokinetics of terpene lactones. However, most methods usually focus only on flavonoid compounds or terpene lactones separately. Zhao et al. (
2008) and Wu et al. (
2013) reported that HPLC-MS/MS can be applied to the simultaneous determination of flavonoids and terpene lactones
in vivo.
To depict the pharmacokinetic profiles of the main bioactive ingredients comprehensively, it is very important to develop a rapid and sensitive analytical method to quantify multiple components of GBTs in biological matrices. In this study, we aimed to develop an ultra-performance liquid chromatography (UPLC)-MS/MS method to quantify seven bioactive compounds simultaneously in rat plasma to evaluate their pharmacokinetic properties after a single oral administration of GBTs.
2. Materials and methods
2.1. Materials and reagents
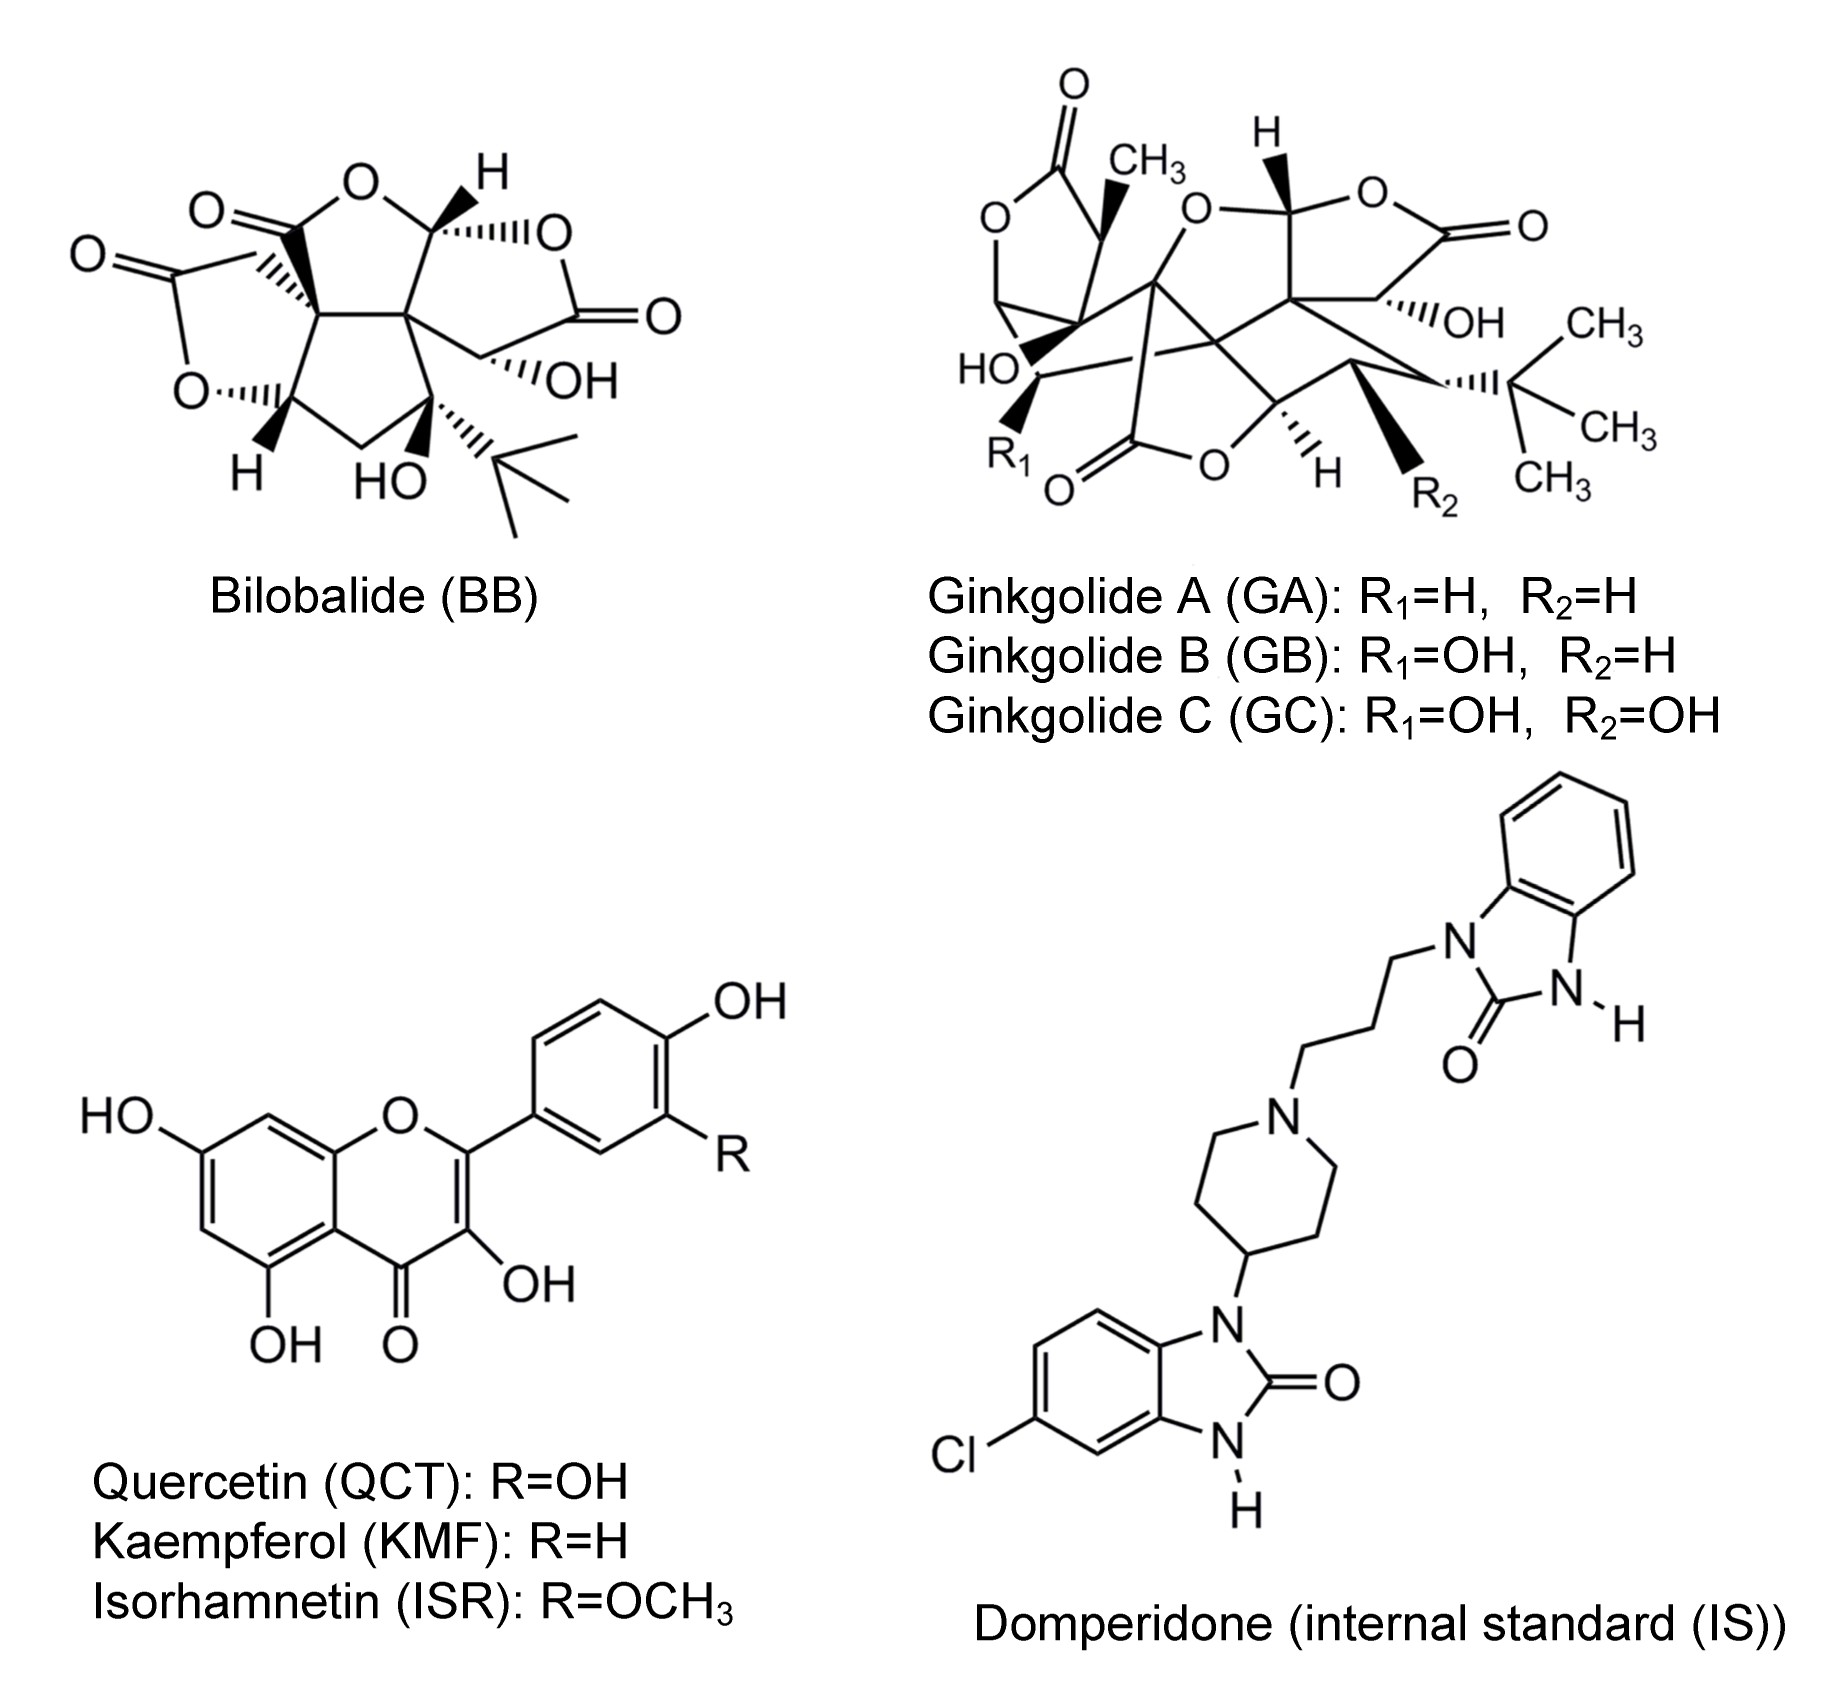
BB (purity 100.0%, 110865-200605), GA (purity 95.4%, 110862-200305), GB (purity 99.9%, 110863-201209), GC (purity 97.1%, 110864-200906), QCT (purity 97.4%, 100081-200907), KMF (purity 99.0%, 110861-201209), ISR (purity 93.2%, 110860-201109), and internal standard (IS) domperidone (purity 100.0%, 100304-201103) were all purchased from the National Institute for the Control of Pharmaceutical and Biological Products, Beijing, China. The chemical structures of all analytes and the IS are shown in Fig.
1.
Fig.1
Chemical structures of bilobalide (BB), ginkgolide A (GA), ginkgolide B (GB), ginkgolide C (GC), quercetin (QCT), kaempferol (KMF), isorhamnetin (ISR), and internal standard (IS) domperidone
GBTs were supplied by Jiangsu Kanion Pharmaceutical Co., Ltd. (Lianyungang, China). The major components of each tablet were quantified by HPLC-evaporative light scattering detector (ELSD) for terpene lactones and HPLC-UV for flavonols (Table
1). Methanol and acetonitrile (MS grade) was supplied by Fisher Co., Inc. (USA) and formic acid (MS grade) by Sigma-Aldrich (USA). Deionized water was prepared using an ultrapure water system and further purified by the Millipore Simplicity® UV ultrapure water system (Germany). All other reagents were of analytical grade.
Table 1
Contents of the major components in each Ginkgo biloba tablet (GBT) and dosage administered to each rat
| Component |
Content* (mg) |
Dosage administered (mg/kg) |
| Bilobalide |
2.22±0.003 |
3.33 |
| Ginkgolide A |
1.59±0.14 |
2.39 |
| Ginkgolide B |
0.41±0.04 |
0.62 |
| Ginkgolide C |
0.69±0.04 |
1.04 |
| Quercetin |
3.20±0.11 |
4.80 |
| Kaempferol |
3.68±0.08 |
5.52 |
| Isorhamnetin |
1.41±0.04 |
2.12 |
*Data are presented as mean±SD (n=3)
The terpene lactones and flavonols in GBT were quantitated by HPLC-ELSD and HPLC-UV, respectively
2.2. UPLC-ESI-MS/MS conditions
A Waters® Xevo™ TQ UPLC-MS/MS chromatographic system (USA) was used, interfaced with a triple quadruple mass spectrometer and coupled with electrospray ionization (ESI). The analytes were separated on an Acquity BEH C18 column (2.1 mm×100 mm, 1.7 μm). The mobile phase was acetonitrile (A) and 0.1% formic acid in water (B). The gradient conditions of the mobile phase were: 0–0.5 min, A, held at 5%; 0.5–1.0 min, A, 5%–70%; 1.0–2.5 min, A, held at 70%; 2.5–3.5 min, A, 70%–30%; all at a flow rate of 0.4 ml/min and returned to the initial condition (acetonitrile-water 5:95, at a flow rate 0.4 ml/min) for a 4-min re-equilibration. The column temperature was maintained at 40 °C and the injection volume was 3 μl.
During the UPLC-ESI-MS/MS analysis, the negative ion mode was used with selected multiple reaction monitoring (MRM) for the quantitative analysis. The optimal MRM transitions for the analytes to quantify were determined as follows: the mass-to-charge ratio (
m/
z) for BB was 325.00→182.85, GA 407.21→350.91, GB 422.93→366.96, GC 438.99→382.92, QCT 300.85→150.85, KMF 285.12→142.97, ISR 314.77→299.88, and IS 423.63→166.74. Nitrogen was used as the collision gas. The nebulizer, cone, and de-solvation gas flows were set at 7.0 bar (1 bar=0.1 MPa), 150 L/h, and 800 L/h, respectively. The de-solvation temperature was set at 400 °C. Dwell time was set to 40 ms for each transition. The capillary voltage was set at 2.5 kV. Compound parameters are shown in Table
2.
Table 2
Optimum mass spectrometry conditions for the analytes in GBTs and the internal standard (IS)
| Analyte |
Scan type |
Ionization mode |
Precursor ion |
Product ion |
Cone (V) |
Collision (V) |
| BB |
Multiple reaction monitoring |
Negative |
325.00 |
182.85 |
30 |
20 |
| GA |
Multiple reaction monitoring |
Negative |
407.21 |
350.91 |
54 |
14 |
| GB |
Multiple reaction monitoring |
Negative |
422.93 |
366.96 |
22 |
16 |
| GC |
Multiple reaction monitoring |
Negative |
438.99 |
382.92 |
30 |
16 |
| QCT |
Multiple reaction monitoring |
Negative |
300.85 |
150.85 |
54 |
18 |
| KMF |
Multiple reaction monitoring |
Negative |
285.12 |
142.97 |
76 |
20 |
| ISR |
Multiple reaction monitoring |
Negative |
314.77 |
299.88 |
68 |
20 |
| IS |
Multiple reaction monitoring |
Negative |
423.63 |
166.74 |
2 |
36 |
BB: bilobalide; GA: ginkgolide A; GB: ginkgolide B; GC: ginkgolide C; QCT: quercetin; KMF: kaempferol; ISR: isorhamnetin
2.3. Animals
Sprague-Dawley male rats (SPF (Beijing) Laboratory Animal Technology Co., Ltd., China) weighing (300±10) g were used. All experiments were carried out according to the guidelines of the Animal Care and Use Committee of Beijing University of Chinese Medicine, China. Before the experiment, all rats were acclimatized to the conditions of the laboratory over one week.
2.4. Plasma sample preparation
A liquid-liquid extraction method was used to extract all the plasma samples. To an aliquot of 100 μl of plasma, the same volume of 4 mol/L hydrochloric acid was added and vortexed for 3 min. The mixture was then hydrolyzed in a water bath at 80 °C for 30 min; afterwards, 1.0 ml acetidin was added to the hydrolyzed and cooled sample, followed by vortexing for 3 min. After centrifugation at 10 000 r/min for 10 min, the 800 μl supernatant was transferred to a clean centrifuge tube and evaporated to dryness under a gentle stream of nitrogen. The residue was reconstituted in 100 μl methanol, followed by centrifugation at 10 000 r/m for 10 min; finally, an aliquot of 3 μl of the solution was injected into the UPLC-MS/MS system for analysis.
2.5. Preparation of reference solutions and samples for QC
Reference compounds were accurately weighed and dissolved in methanol to produce stock solutions. The concentrations of BB, GA, GB, GC, QCT, KMF, and ISR were 102, 96.0, 93.0, 69.0, 73.0, 26.0, and 27.0 μg/ml, respectively. Seven different concentrations of a standard working solution of all analytes were obtained by diluting the solutions with methanol. All solutions were stored at 4 °C and then brought back to room temperature before use. A calibration standard at the seven different concentrations was obtained by spiking 100 μl of the standard working solutions and 50 μl of the IS solution (20 ng/ml) with 100 μl blank rat plasma. For method validation, samples for QC were prepared in the same way.
2.6. Method validation
2.6.1. Selectivity and specificity
Chromatograms of the IS at the lowest limit of quantification (LLOQ), blank rat plasma from six sources, blank plasma spiked with the analytes, and plasma samples after oral administration were compared to investigate the specificity and selectivity of the method.
2.6.2. Calibration curve
For the seven different standard samples, the concentrations were: 5, 12.5, 25, 50, 100, 250, 500 ng/ml for BB; 5, 12.5, 25, 50, 100, 250, 500 ng/ml for GA; 2.5, 6.25, 12.5, 25, 50, 125, 250 ng/ml for GB; 1, 2.5, 5, 10, 20, 50, 100 ng/ml for GC; 1, 2.5, 5, 10, 20, 50, 100 ng/ml for QCT; 1, 2.5, 5, 10, 20, 50, 100 ng/ml for KMF; and, 1, 2.5, 5, 10, 20, 50, 100 ng/ml for ISR (
n=3). These sample preparation procedures were used to extract and analyze the samples. Plots of the peak area ratios of BB, GA, GB, GC, QCT, KMF, and ISR to IS (
Y) vs. the concentrations of BB, GA, GB, GC, QCT, KMF, and ISR (
X, in ng/ml) using linear regression, were used to confirm the calculation curves.
2.6.3. Recovery and matrix effect
The extraction recoveries (ERs) of BB, GA, GB, GC, QCT, KMF, and ISR from plasma were determined at three different concentrations of BB (12.5, 50, 250 ng/ml), GA (12.5, 50, 250 ng/ml), GB (6.25, 25.0, 125 ng/ml), GC (2.5, 10, 50 ng/ml), QCT (2.5, 10, 50 ng/ml ), KMF (2.5, 10, 50 ng/ml), and ISR (2.5, 10, 50 ng/ml), respectively. The samples were then extracted and analyzed by the same procedure. To determine the recovery of analytes, the mean peak areas (
n=5) of the extracted samples and the corresponding concentrations of the analyte neat standard solutions were compared. The matrix effect was calculated by comparing the mean peak areas of prepared samples with the mean peak areas of the neat standard solutions.
2.6.4. Precision and accuracy
Precision and accuracy were assessed on three consecutive days by using mixtures containing low, medium, or high concentrations of the QC samples. Comparisons of the calculated average measured concentrations using calibration curves with added concentrations were used to determine accuracy, expressed as the relative standard deviation (RSD).
2.6.5. Stability
For testing the stability of the analytes in rat plasma, the same concentrations of the following stored and freshly prepared samples were compared. Analysis of the extracted samples, stored for 4 h maintained at room temperature, was used to determine their short-term stability. To determine the stability of samples in the autosampler, the extracted samples were analyzed after being left in the autosampler at 10 °C for 8 h. Freeze and thaw stability was determined by subjecting the QC samples to three cycles of freezing at −20 °C for 12 h and thawing at room temperature for 2 h.
2.7. Pharmacokinetic studies
Five male rats were orally administered a single dose of GBTs. The rats were given samples equivalent to 3.33, 2.39, 0.62, 1.04, 4.80, 5.52, and 2.12 mg/kg of BB, GA, GB, GC, QCT, KMF, and ISR, respectively (Table
1). After dosing for 0, 0.166, 0.5, 0.75, 1, 1.5, 2, 4, 6, 8, 12, 24, 36, and 48 h, blood samples were collected in heparinized tubes to quantify the drug concentrations. The blood samples were centrifuged at 10 000 r/min for 10 min, and then the supernatants were collected in tightly sealed plastic tubes (sodium citrate anticoagulation) and kept frozen at −20 °C until analyzed. The plasma concentrations of BB, GA, GB, GC, QCT, KMF, and ISR were expressed as mean±standard deviation (SD), and the mean concentration-time curve was plotted. Non-compartmental pharmacokinetic parameters were computed using the software Kinetica 4.4.
3. Results and discussion
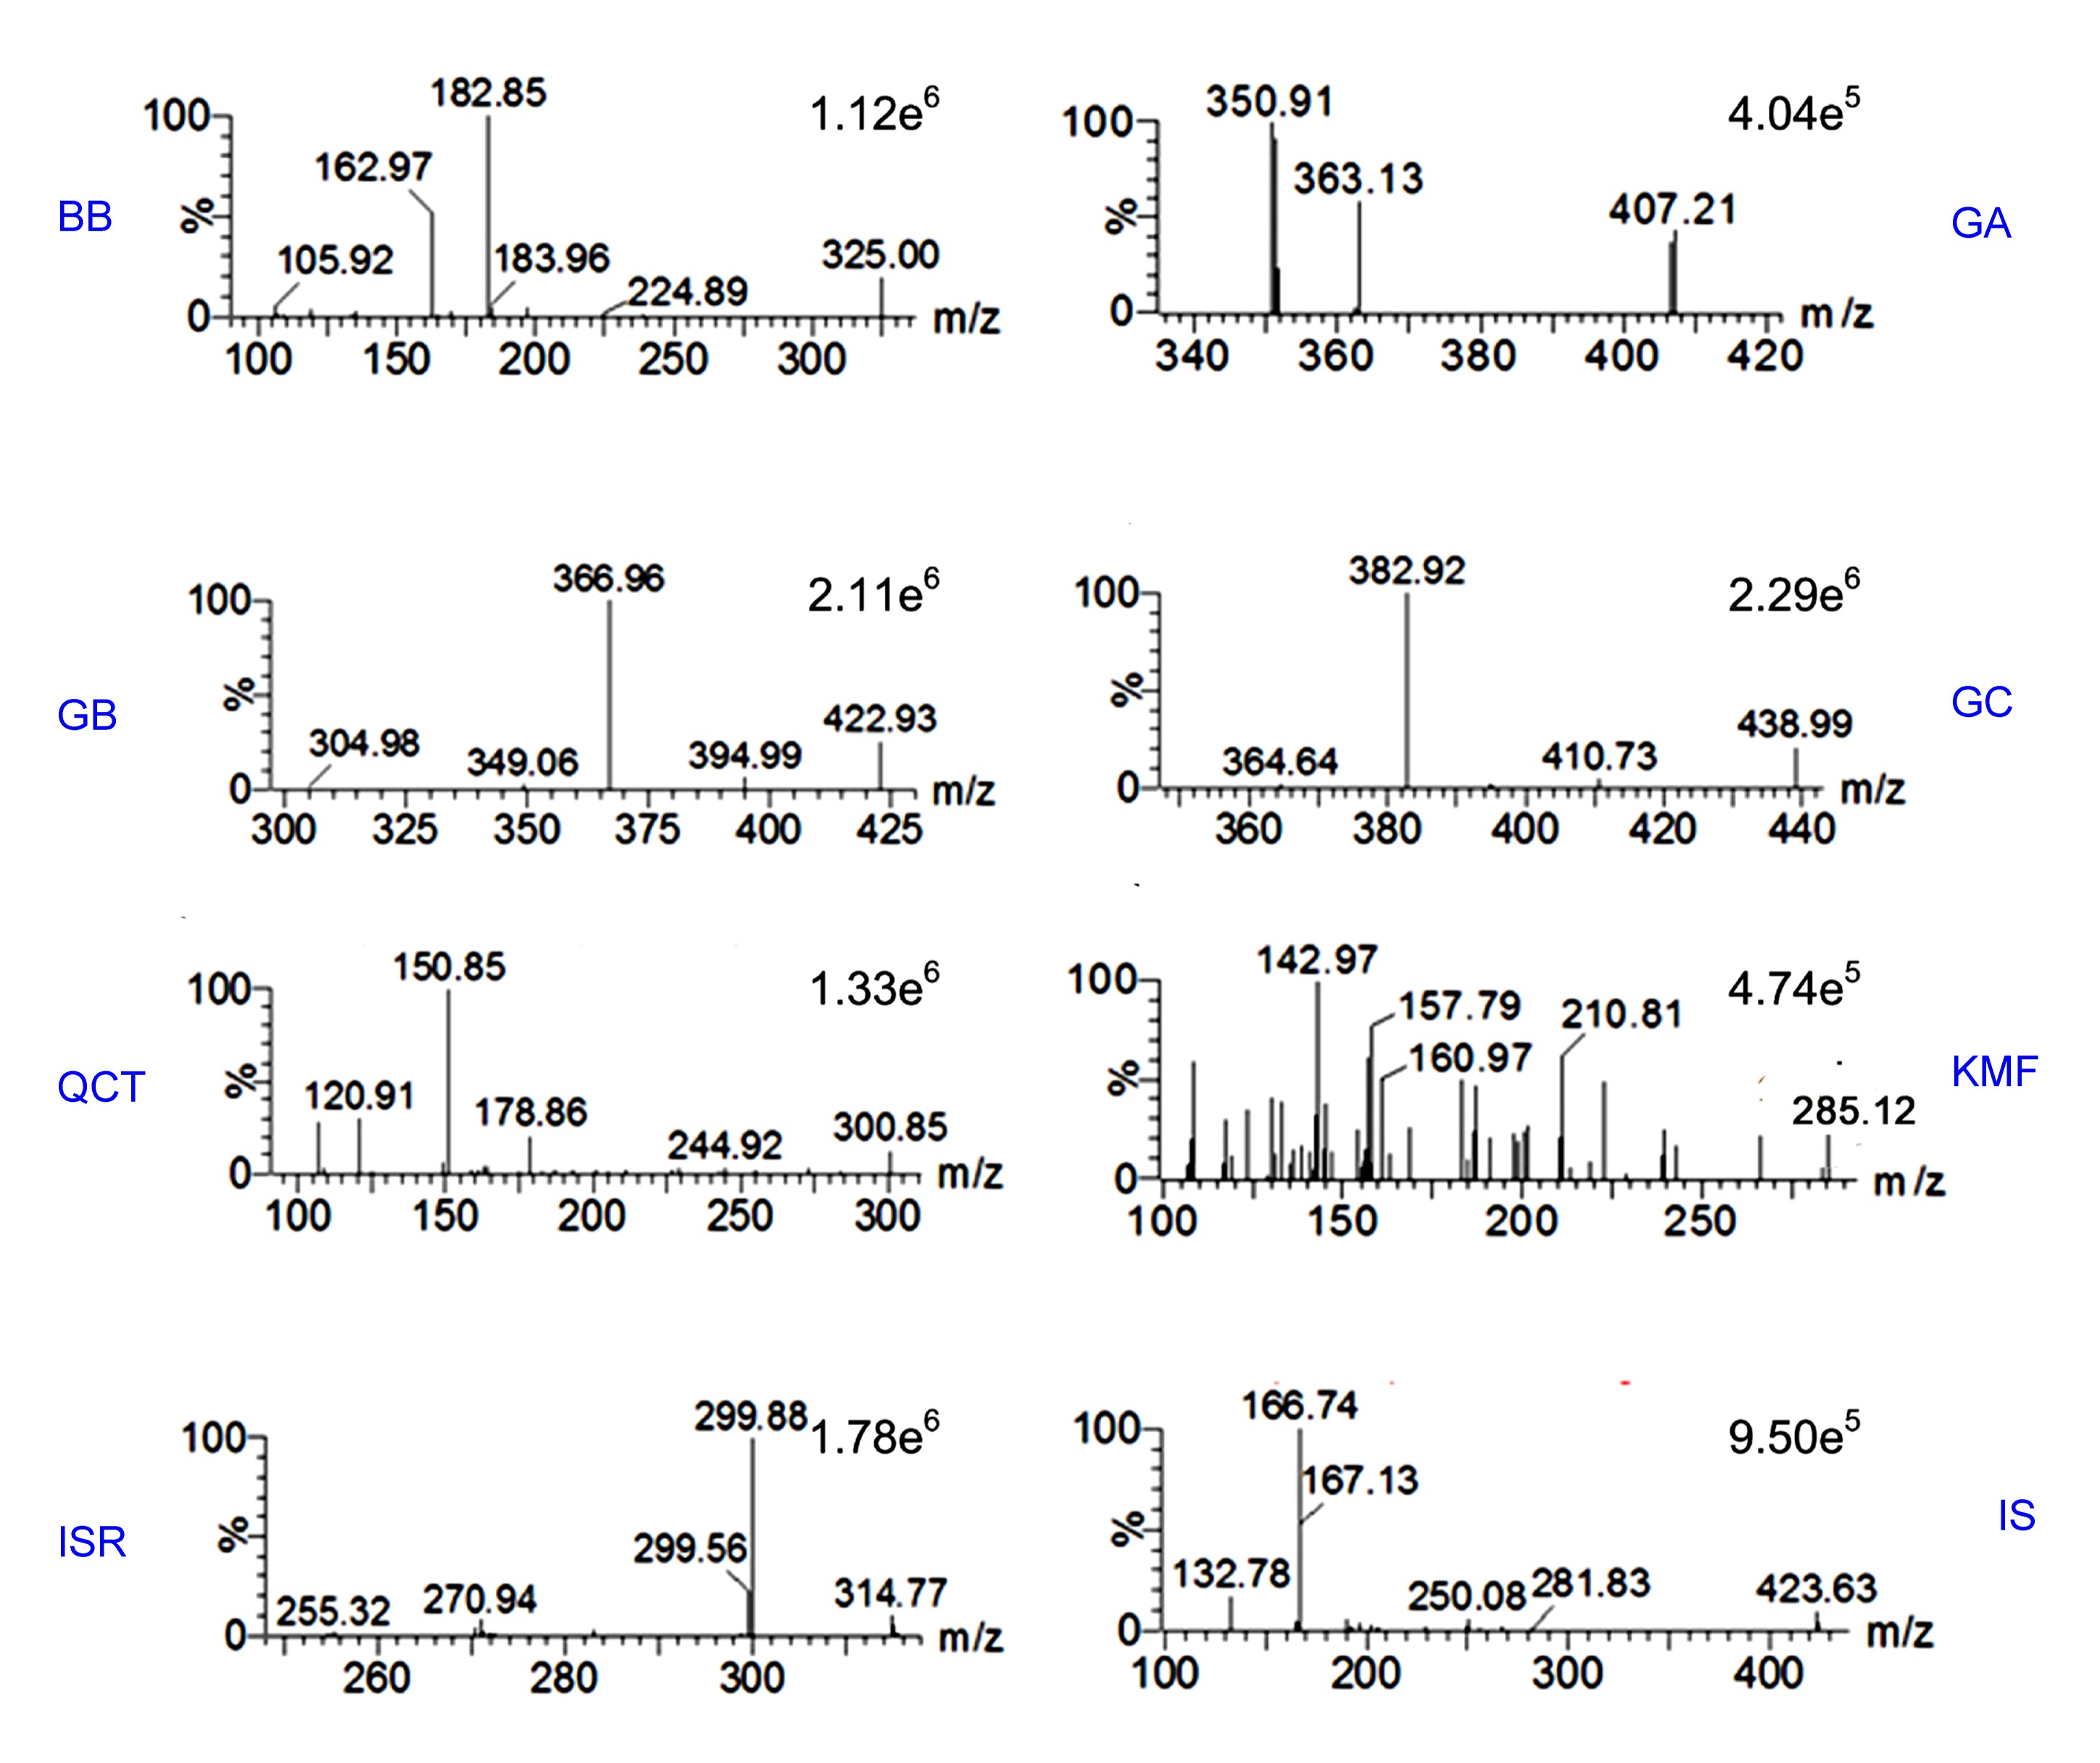
3.1. UPLC-MS/MS conditions and sample preparation optimization
To optimize the mass spectra conditions, abundant deprotonated molecules of the seven components that formed the base peak of each mass spectrum were observed from parent scans. According to the recent literature, the negative mode was suitable to ionize the seven components (Zhao et al.,
2008; Wu et al.,
2013). The instrument parameters were optimized to detect parent and daughter ions. So the parent ions [M–H]
−,
m/
z 325.00 for BB, 407.21 for GA, 422.93 for GB, and 438.99 for GC, were subjected to collision. The most abundant fragments were then selected to be daughter ions (Fig.
2). The mass transition patterns,
m/
z 325.00→182.85, 407.21→350.91, 422.93→366.96, 438.99→382.92, 300.85→150.85, 285.12→142.97, and 314.77→299.88, were selected to monitor BB, GA, GB, GC, QCT, KMF, and ISR, respectively. In the same way, an MS/MS channel of
m/
z 423.63→166.74 was chosen to monitor the IS.
Fig.2
Daughter ion mass spectra of the analytes in GBTs and the internal standard (IS)
BB: bilobalide; GA: ginkgolide A; GB: ginkgolide B; GC: ginkgolide C; QCT: quercetin; KMF: kaempferol; ISR: isorhamnetin
To optimize sample preparation, protein precipitation and liquid-liquid extraction methods were tested in our study. Using protein precipitation by methanol and acetonitrile, the recovery of four ginkgolides was not satisfactory. Therefore, we tested a liquid-liquid extraction method and acetidin was proved suitable for extracting all analytes from rat plasma. Chandra et al. (
2011) reported that ginkgo flavonoids include flavonols and their glycosides. Some studies have shown that flavonoid glycosides can be absorbed in the intestine by bacteria to facilitate absorption (Bokkenheuser et al.,
1987; Kim et al.,
1998; Wu et al.,
2013). However, other studies have shown that flavonoids exist as aglycones, glucuronic acid conjugates, and sulfonic acid conjugates in plasma (Manach et al.,
1996; Yodogawa et al.,
2003; Silberberg et al.,
2005). So the plasma samples should be acid hydrolytic to transform conjugates to aglycones.
3.2. Validation of the assay
3.2.1. Selectivity and specificity
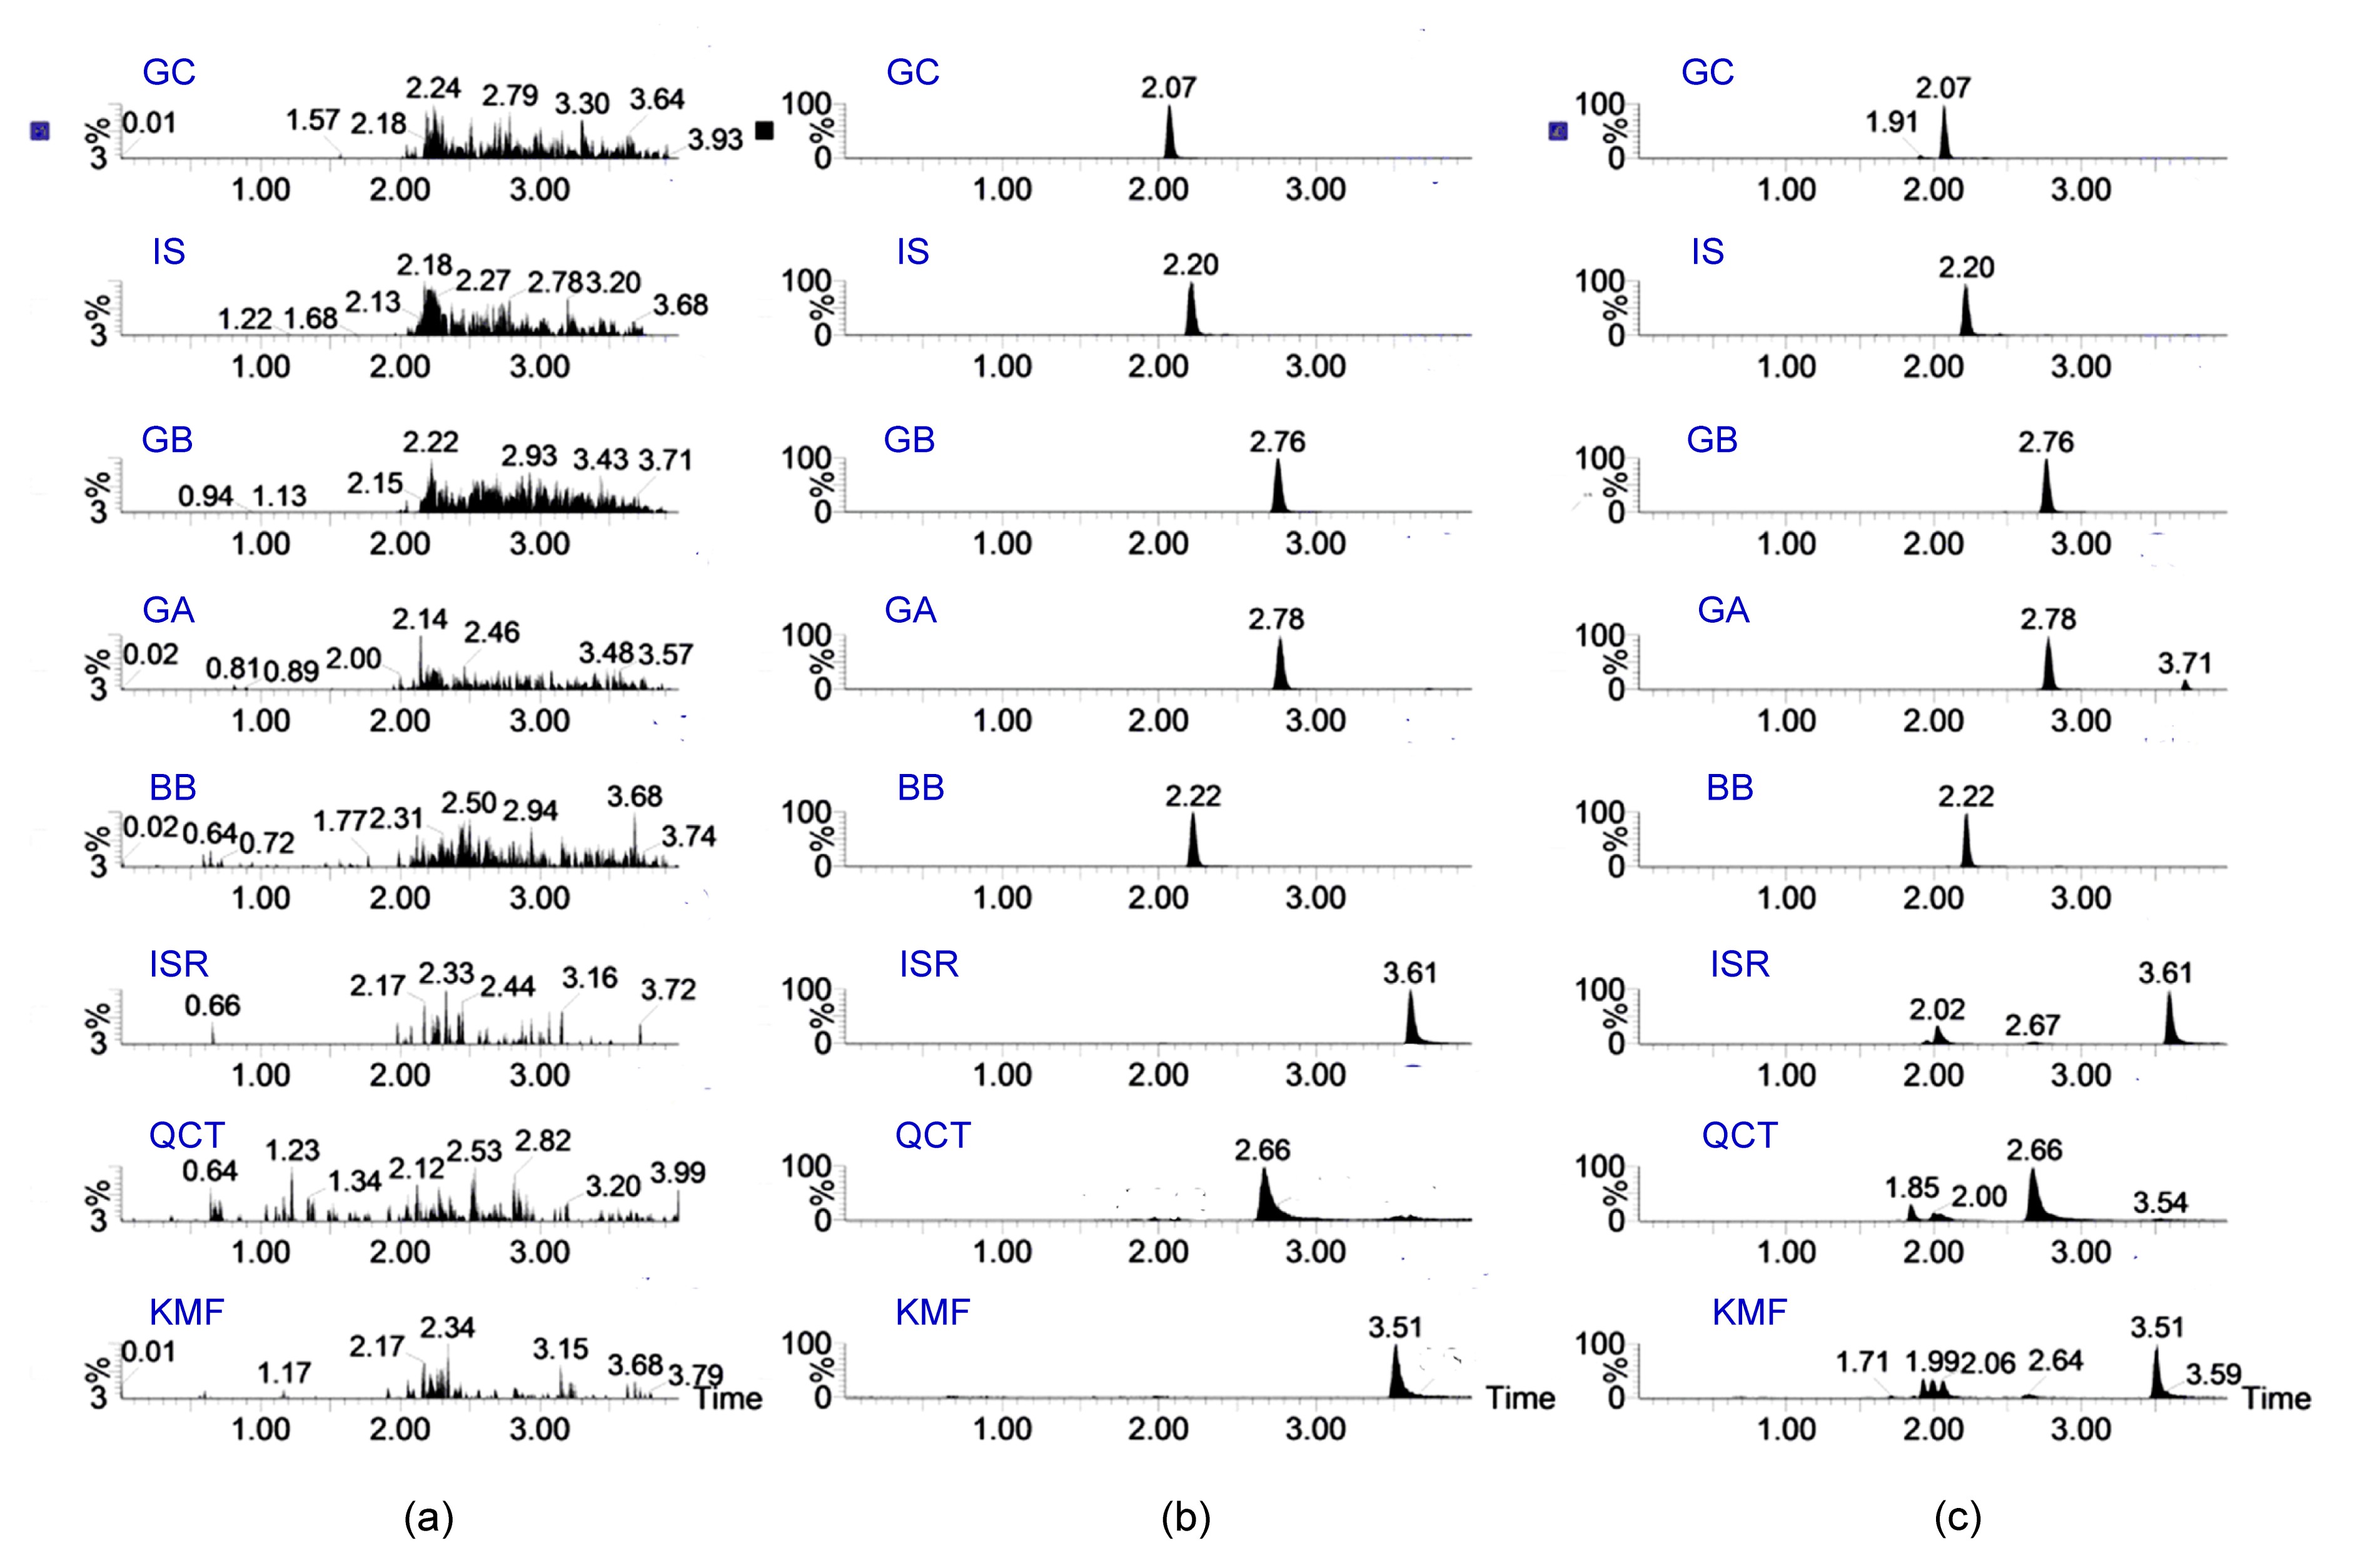
Under the UPLC-MS/MS conditions, a specific voltage at the optimum value was set to obtain the best sensitivity and specificity for each analyte (Fig.
3). No obvious endogenous interference was observed and a good separation of the analytes was achieved. The chromatographic peaks were at the retention time of 2.07, 2.20, 2.76, 2.78, 2.22, 3.61, 2.66, and 3.51 min for GC, IS, GB, GA, BB, ISR, QCT, and KMF, respectively.
Fig.3
Representative multiple reaction monitoring (MRM) chromatograms of the analytes and the internal standard (IS)
(a) Blank plasma sample; (b) Blank plasma sample spiked with the analytes at LLOQ and IS; (c) Plasma sample of orally administrated rat at 6 h post dose. GC: ginkgolide C; GB: ginkgolide B; GA: ginkgolide A; BB: bilobalide; ISR: isorhamnetin; QCT: quercetin; KMF: kaempferol
3.2.2. Linearities of calibration curves and the lowest limit of quantification (LLOQ)
The method was linear over the concentration range of 5–500 ng/ml for BB, 5–500 ng/ml for GA, 2.5–250 ng/ml for GB, 1–100 ng/ml for GC, 1.0–100 ng/ml for QCT, 1–100 ng/ml for KMF, and 1–100 ng/ml for ISR. The mean values of the linear regression equations of the analytes are listed in Table
3. The LLOQ was defined as the lowest concentration on the calibration curve with acceptable precision and accuracy.
Table 3
Linearities, the lowest limits of quantification (LLOQs), and the lowest limits of detection (LLODs) for analytes of GBTs in rat plasma (n=3)
| Analyte |
Retention time (min) |
Linear range (ng/ml) |
Linear equation |
R
2
|
LLOQ (ng/ml) |
LLOD (ng/ml) |
| BB |
2.22 |
5–500 |
Y=3.1341X−39.786 |
0.996 |
5 |
0.018 |
| GA |
2.78 |
5–500 |
Y=0.2459X−3.0339 |
0.9969 |
5 |
0.032 |
| GB |
2.76 |
2.5–250 |
Y=8.7944X−21.578 |
0.9945 |
2.5 |
0.018 |
| GC |
2.07 |
1–100 |
Y=8.0653X+12.650 |
0.9997 |
1 |
0.023 |
| QCT |
2.66 |
1–100 |
Y=1.9149X+3.2370 |
0.9934 |
1 |
0.360 |
| KMF |
3.51 |
1–100 |
Y=0.2868X+0.8961 |
0.9984 |
1 |
0.270 |
| ISR |
3.61 |
1–100 |
Y=9.8024X−5.6094 |
0.9982 |
1 |
0.017 |
BB: bilobalide; GA: ginkgolide A; GB: ginkgolide B; GC: ginkgolide C; QCT: quercetin; KMF: kaempferol; ISR: isorhamnetin
3.2.3. Matrix effect and recovery
The matrix effect in different mobile phases was investigated during method development. Using an electrolyte-free mobile phase, a significant matrix effect was observed. A mobile phase modified with 0.1% HCOOH minimized the matrix effects, but flavonols were still affected slightly. We then adjusted the eluent gradient, and a smaller matrix effect was observed (Table
4). This phenomenon may due to the co-eluting of residual matrix components interfering with the ionization of the target analyte (Dams et al.,
2003). Zhao et al. (
2008) reported that inclusion of ammonium formate (0.2 mmol/L) in the mobile phase generated beneficial LC-electrolyte effects, including increased ESI efficiency and capacity. While 0.1% HCOOH in the mobile phase was found to improve the peak shape of the analytes, ammonium formate had no significant effect on the analytes in our study. Thus, 0.1% HCOOH was chosen as the mobile phase.
Table 4
Extraction recovery and matrix effect for the analytes of GBTs in rat plasma
| Analyte |
Concentration added (ng/ml) |
Matrix effect
|
Extraction recovery
|
| Value* (%) |
RSD (%) |
Value* (%) |
RSD (%) |
| GC |
2.5 |
103.94±9.63 |
8.25 |
79.87±6.59 |
9.26 |
|
10 |
96.50±5.08 |
4.24 |
77.26±3.27 |
5.26 |
|
50 |
95.27±4.61 |
4.84 |
68.29±8.99 |
8.08 |
| BB |
12.5 |
102.97±10.14 |
9.84 |
76.67±4.13 |
5.39 |
|
50 |
97.33±6.98 |
7.17 |
75.68±4.03 |
5.32 |
|
250 |
97.53±6.19 |
6.34 |
71.01±1.98 |
2.79 |
| QCT |
2.5 |
102.13±7.55 |
7.39 |
84.42±8.51 |
10.08 |
|
10 |
99.01±8.61 |
8.7 |
80.17±2.12 |
2.64 |
|
50 |
101.63±14.85 |
14.61 |
74.38±10.57 |
14.21 |
| GB |
6.25 |
101.51±12.26 |
12.08 |
77.32±4.82 |
6.23 |
|
25 |
104.49±10.99 |
10.52 |
75.17±4.33 |
5.76 |
|
125 |
102.35±13.92 |
13.6 |
79.84±2.27 |
2.85 |
| GA |
12.5 |
94.69±9.38 |
9.9 |
71.94±3.72 |
5.18 |
|
50 |
94.91±10.81 |
11.39 |
72.36±5.16 |
7.14 |
|
250 |
94.40±11.11 |
11.77 |
75.32±0.98 |
1.31 |
| KMF |
2.5 |
97.07±8.02 |
8.26 |
71.33±2.52 |
3.53 |
|
10 |
100.87±6.48 |
6.42 |
68.11±2.92 |
4.29 |
|
50 |
93.89±3.40 |
3.62 |
70.46±2.81 |
3.99 |
| ISR |
2.5 |
94.70±4.98 |
5.26 |
83.03±4.57 |
5.50 |
|
10 |
96.04±5.14 |
5.35 |
83.03±4.57 |
5.50 |
|
50 |
90.94±4.17 |
4.59 |
83.17±3.24 |
3.89 |
*Data are presented as mean±SD (n=5)
GC: ginkgolide C; BB: bilobalide; QCT: quercetin; GB: ginkgolide B; GA: ginkgolide A; KMF: kaempferol; ISR: isorhamnetin; RSD: relative standard deviation
3.2.4. Precision and accuracy
The intra-day precision and accuracy were determined by the replicate analyses of QC samples (n=5) at three concentrations during the three separate days. One replicate of the QC samples at each of three concentrations from three separate validation batches was used to evaluate the inter-day precision. The intra-day precision and accuracy of the method were determined by analyzing QC samples (n=5) at three concentrations on the same day, and inter-day precision and accuracy by analyzing QC samples (n=5) at three concentrations on each of three validation days. The results are summarized in Table
5. The intra-day precision was within 10.13% and the inter-day precision value was within 9.82%. The assay mean accuracy was 93.20%-107.23% of the nominal values.
Table 5
Precision and accuracy for the analytes in rat plasma
| Analyte |
Conc. added (ng/ml) |
Inter-day
|
Intra-day
|
| Conc. found (ng/ml) |
Accuracy (%) |
RSD (%) |
Conc. found (ng/ml) |
Accuracy (%) |
RSD (%) |
| GC |
2.5 |
2.35±0.19 |
94.14 |
8.12 |
2.39±0.16 |
95.45 |
6.83 |
|
10 |
10.74±0.42 |
107.41 |
3.95 |
10.15±0.82 |
101.52 |
8.11 |
|
50 |
53.85±2.50 |
107.70 |
4.64 |
51.01±3.41 |
102.52 |
6.68 |
| BB |
12.5 |
11.86±1.16 |
94.84 |
9.82 |
11.65±0.88 |
93.20 |
7.58 |
|
50 |
50.57±1.59 |
101.15 |
3.14 |
51.54±3.60 |
103.08 |
6.99 |
|
250 |
259.44±14.54 |
103.77 |
5.60 |
256.17±15.69 |
102.47 |
6.13 |
| QCT |
2.5 |
2.44±0.21 |
97.78 |
8.72 |
2.57±0.26 |
102.77 |
10.13 |
|
10 |
10.22±0.77 |
102.46 |
7.49 |
10.02±0.81 |
100.22 |
8.05 |
|
50 |
52.24±5.24 |
104.13 |
9.66 |
50.84±4.96 |
101.68 |
9.75 |
| GB |
6.25 |
5.84±0.36 |
93.45 |
6.15 |
6.05±0.35 |
96.77 |
5.86 |
|
25 |
24.14±0.56 |
96.54 |
2.33 |
25.51±1.87 |
102.04 |
7.32 |
|
125 |
128.53±4.81 |
102.83 |
3.74 |
127.34±7.20 |
101.87 |
5.65 |
| GA |
12.5 |
12.55±0.71 |
100.41 |
5.67 |
11.88±1.02 |
95.06 |
8.69 |
|
50 |
45.93±1.94 |
91.86 |
4.22 |
48.89±4.71 |
97.77 |
9.64 |
|
250 |
238.99±11.23 |
95.59 |
4.70 |
243.44±14.08 |
97.38 |
5.78 |
| KMF |
2.5 |
2.64±0.16 |
105.49 |
5.89 |
2.68±0.13 |
107.23 |
5.02 |
|
10 |
8.77±0.37 |
87.72 |
4.22 |
9.74±0.95 |
97.36 |
9.79 |
|
50 |
48.66±2.85 |
97.32 |
5.85 |
48.91±3.95 |
97.83 |
8.07 |
| ISR |
2.5 |
2.43±0.20 |
97.67 |
8.35 |
2.49±0.25 |
99.57 |
9.86 |
|
10 |
8.77±0.30 |
87.67 |
3.44 |
9.42±0.78 |
94.22 |
8.27 |
|
50 |
54.18±1.71 |
108.37 |
3.16 |
50.15±4.59 |
100.30 |
9.15 |
The values for the concentration found are expressed as mean±SD, five replicates per day for three days. GC: ginkgolide C; BB: bilobalide; QCT: quercetin; GB: ginkgolide B; GA: ginkgolide A; KMF: kaempferol; ISR: isorhamnetin; RSD: relative standard deviation
3.2.5. Stability
During the short-term and autosampler stability assays, all analytes were stable. None of the analytes in rat plasma was significantly affected after being subjected to three freezing and thawing cycles. The RSD values for long-term stability were less than 11.11% (Table
6). The results showed that all analytes were stable in the above conditions.
Table 6
Stability of the analytes in rat plasma
| Analyte |
Conc. added (ng/ml) |
Short-term stability
|
Autosampler stability
|
Freeze-thaw stability (three cycles)
|
Four-week stability
|
| Conc. found (%) |
RSD (%) |
Conc. found (%) |
RSD (%) |
Conc. found (%) |
RSD (%) |
Conc. found (%) |
RSD (%) |
| GC |
2.5 |
98.42±5.67 |
5.76 |
95.28±9.00 |
9.45 |
97.15±10.03 |
10.32 |
98.10±7.21 |
7.35 |
|
10 |
101.02±4.35 |
4.31 |
104.95±2.84 |
2.71 |
102.94±3.48 |
3.38 |
103.76±8.29 |
7.99 |
|
50 |
103.40±9.78 |
9.46 |
97.40±5.16 |
5.29 |
98.37±4.81 |
4.89 |
97.57±3.42 |
3.51 |
| BB |
12.5 |
87.60±4.52 |
5.16 |
84.59±10.79 |
12.76 |
90.10±5.27 |
5.85 |
105.67±10.12 |
9.58 |
|
50 |
97.56±4.66 |
4.78 |
122.30±2.19 |
1.79 |
109.64±5.00 |
4.56 |
96.74±9.01 |
9.31 |
|
250 |
105.12±10.24 |
9.74 |
100.84±5.90 |
5.85 |
102.29±5.30 |
5.18 |
97.11±10.08 |
10.38 |
| QCT |
2.5 |
101.65±3.41 |
3.35 |
104.43±7.73 |
7.40 |
98.72±6.81 |
6.90 |
101.31±11.09 |
10.95 |
|
10 |
104.42±4.56 |
4.37 |
113.21±7.98 |
7.05 |
101.21±8.75 |
8.65 |
97.10±7.23 |
7.45 |
|
50 |
101.74±7.88 |
7.75 |
98.97±9.05 |
9.14 |
105.31±7.64 |
7.25 |
102.35±8.22 |
8.03 |
| GB |
6.25 |
93.72±5.67 |
6.05 |
105.71±3.57 |
3.37 |
105.20±9.27 |
8.81 |
98.70±8.34 |
8.45 |
|
25 |
98.67±6.78 |
6.87 |
114.43±1.55 |
1.35 |
104.52±5.65 |
5.41 |
100.78±5.48 |
5.44 |
|
125 |
104.14±7.99 |
7.67 |
108.76±5.10 |
4.69 |
110.19±3.39 |
3.07 |
95.77±5.63 |
5.88 |
| GA |
12.5 |
106.24±10.34 |
9.73 |
79.73±5.88 |
7.37 |
89.05±4.91 |
5.51 |
97.70±6.80 |
6.96 |
|
50 |
109.12±4.01 |
3.67 |
118.25±3.20 |
2.71 |
103.68±6.47 |
6.24 |
101.21±5.84 |
5.77 |
|
250 |
90.31±6.74 |
7.46 |
89.14±3.13 |
3.52 |
90.97±2.98 |
3.28 |
98.81±4.45 |
4.50 |
| KMF |
2.5 |
107.34±5.43 |
5.06 |
96.83±9.89 |
10.21 |
96.55±7.32 |
7.58 |
97.99±7.22 |
7.37 |
|
10 |
100.72±2.45 |
2.43 |
98.73±4.82 |
4.88 |
104.93±7.54 |
7.19 |
102.31±6.78 |
6.63 |
|
50 |
98.97±3.21 |
3.24 |
102.3±7.15 |
6.99 |
99.74±8.71 |
8.73 |
108.98±12.11 |
11.11 |
| ISR |
2.5 |
104.54±4.54 |
4.34 |
87.98±5.75 |
6.54 |
89.74±5.25 |
5.85 |
101.16±9.12 |
9.02 |
|
10 |
101.23±6.77 |
6.69 |
112.32±5.78 |
5.15 |
101.72±5.67 |
5.57 |
103.45±7.76 |
7.50 |
|
50 |
98.78±7.68 |
7.77 |
100.44±6.91 |
6.88 |
105.50±9.78 |
9.27 |
98.79±6.34 |
6.42 |
The values for the concentration found are expressed as mean±SD, n=3. GC: ginkgolide C; BB: bilobalide; QCT: quercetin; GB: ginkgolide B; GA: ginkgolide A; KMF: kaempferol; ISR: isorhamnetin; RSD: relative standard deviation
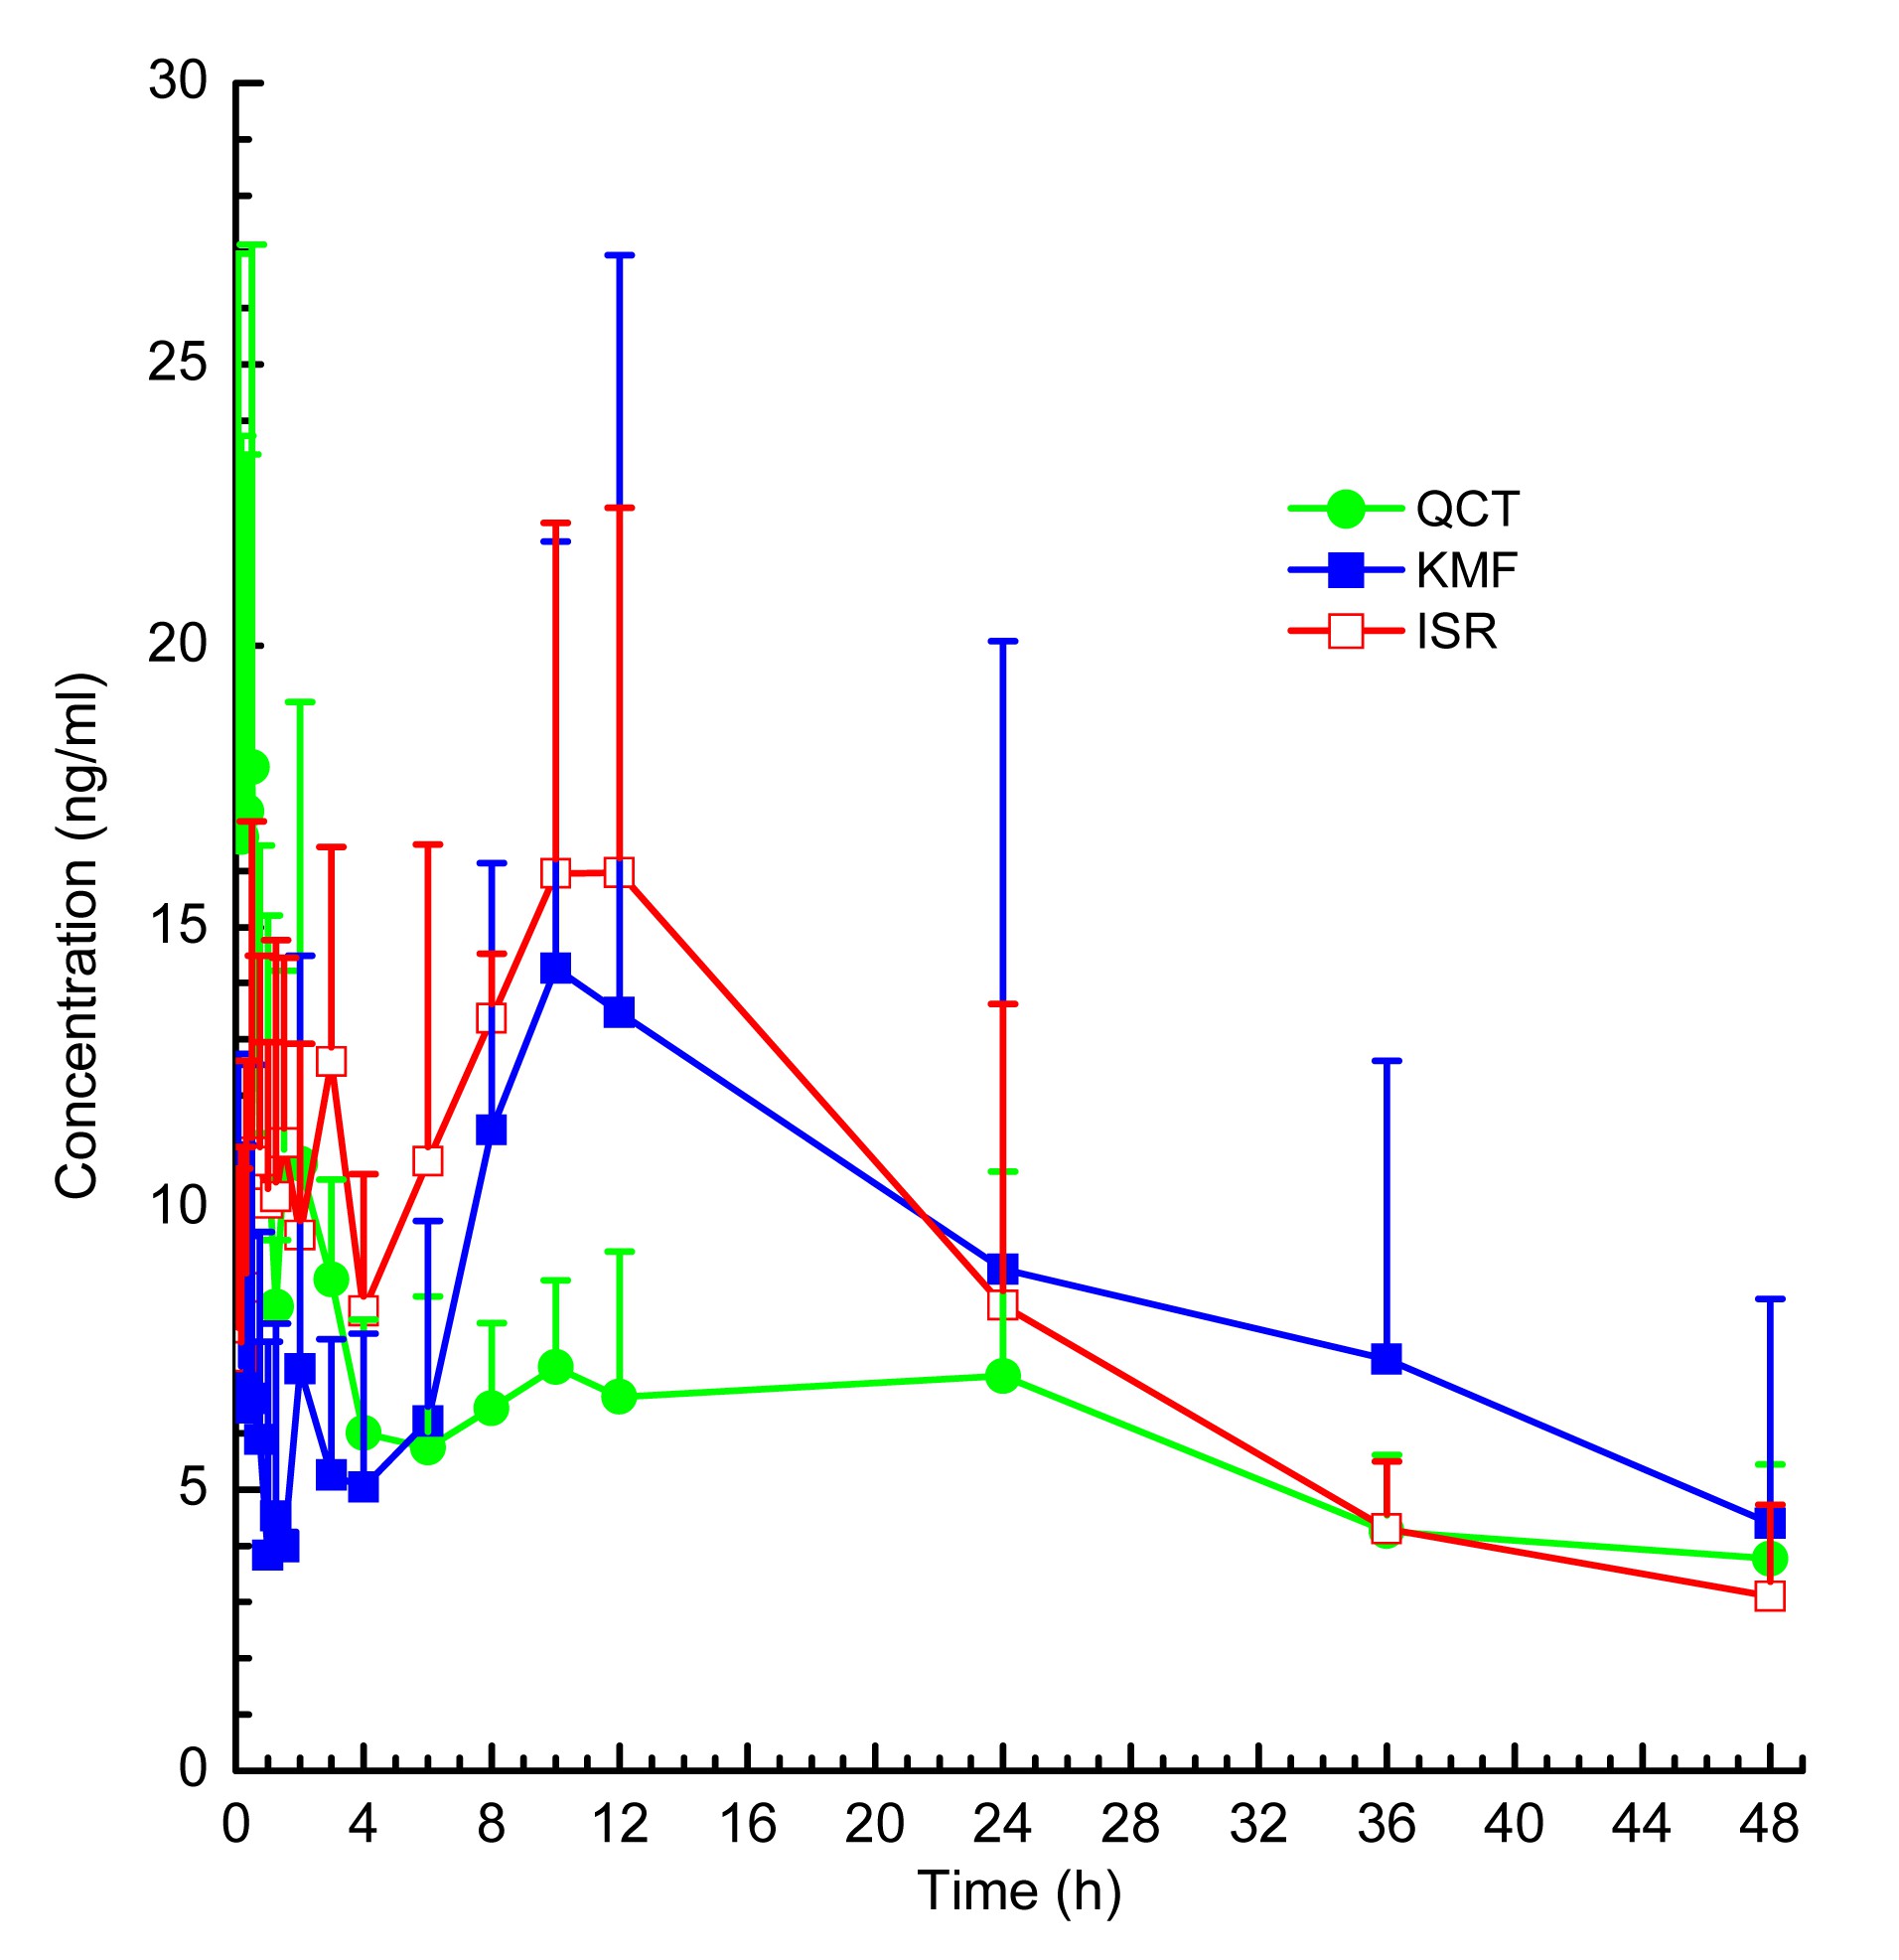
3.3. Pharmacokinetics studies
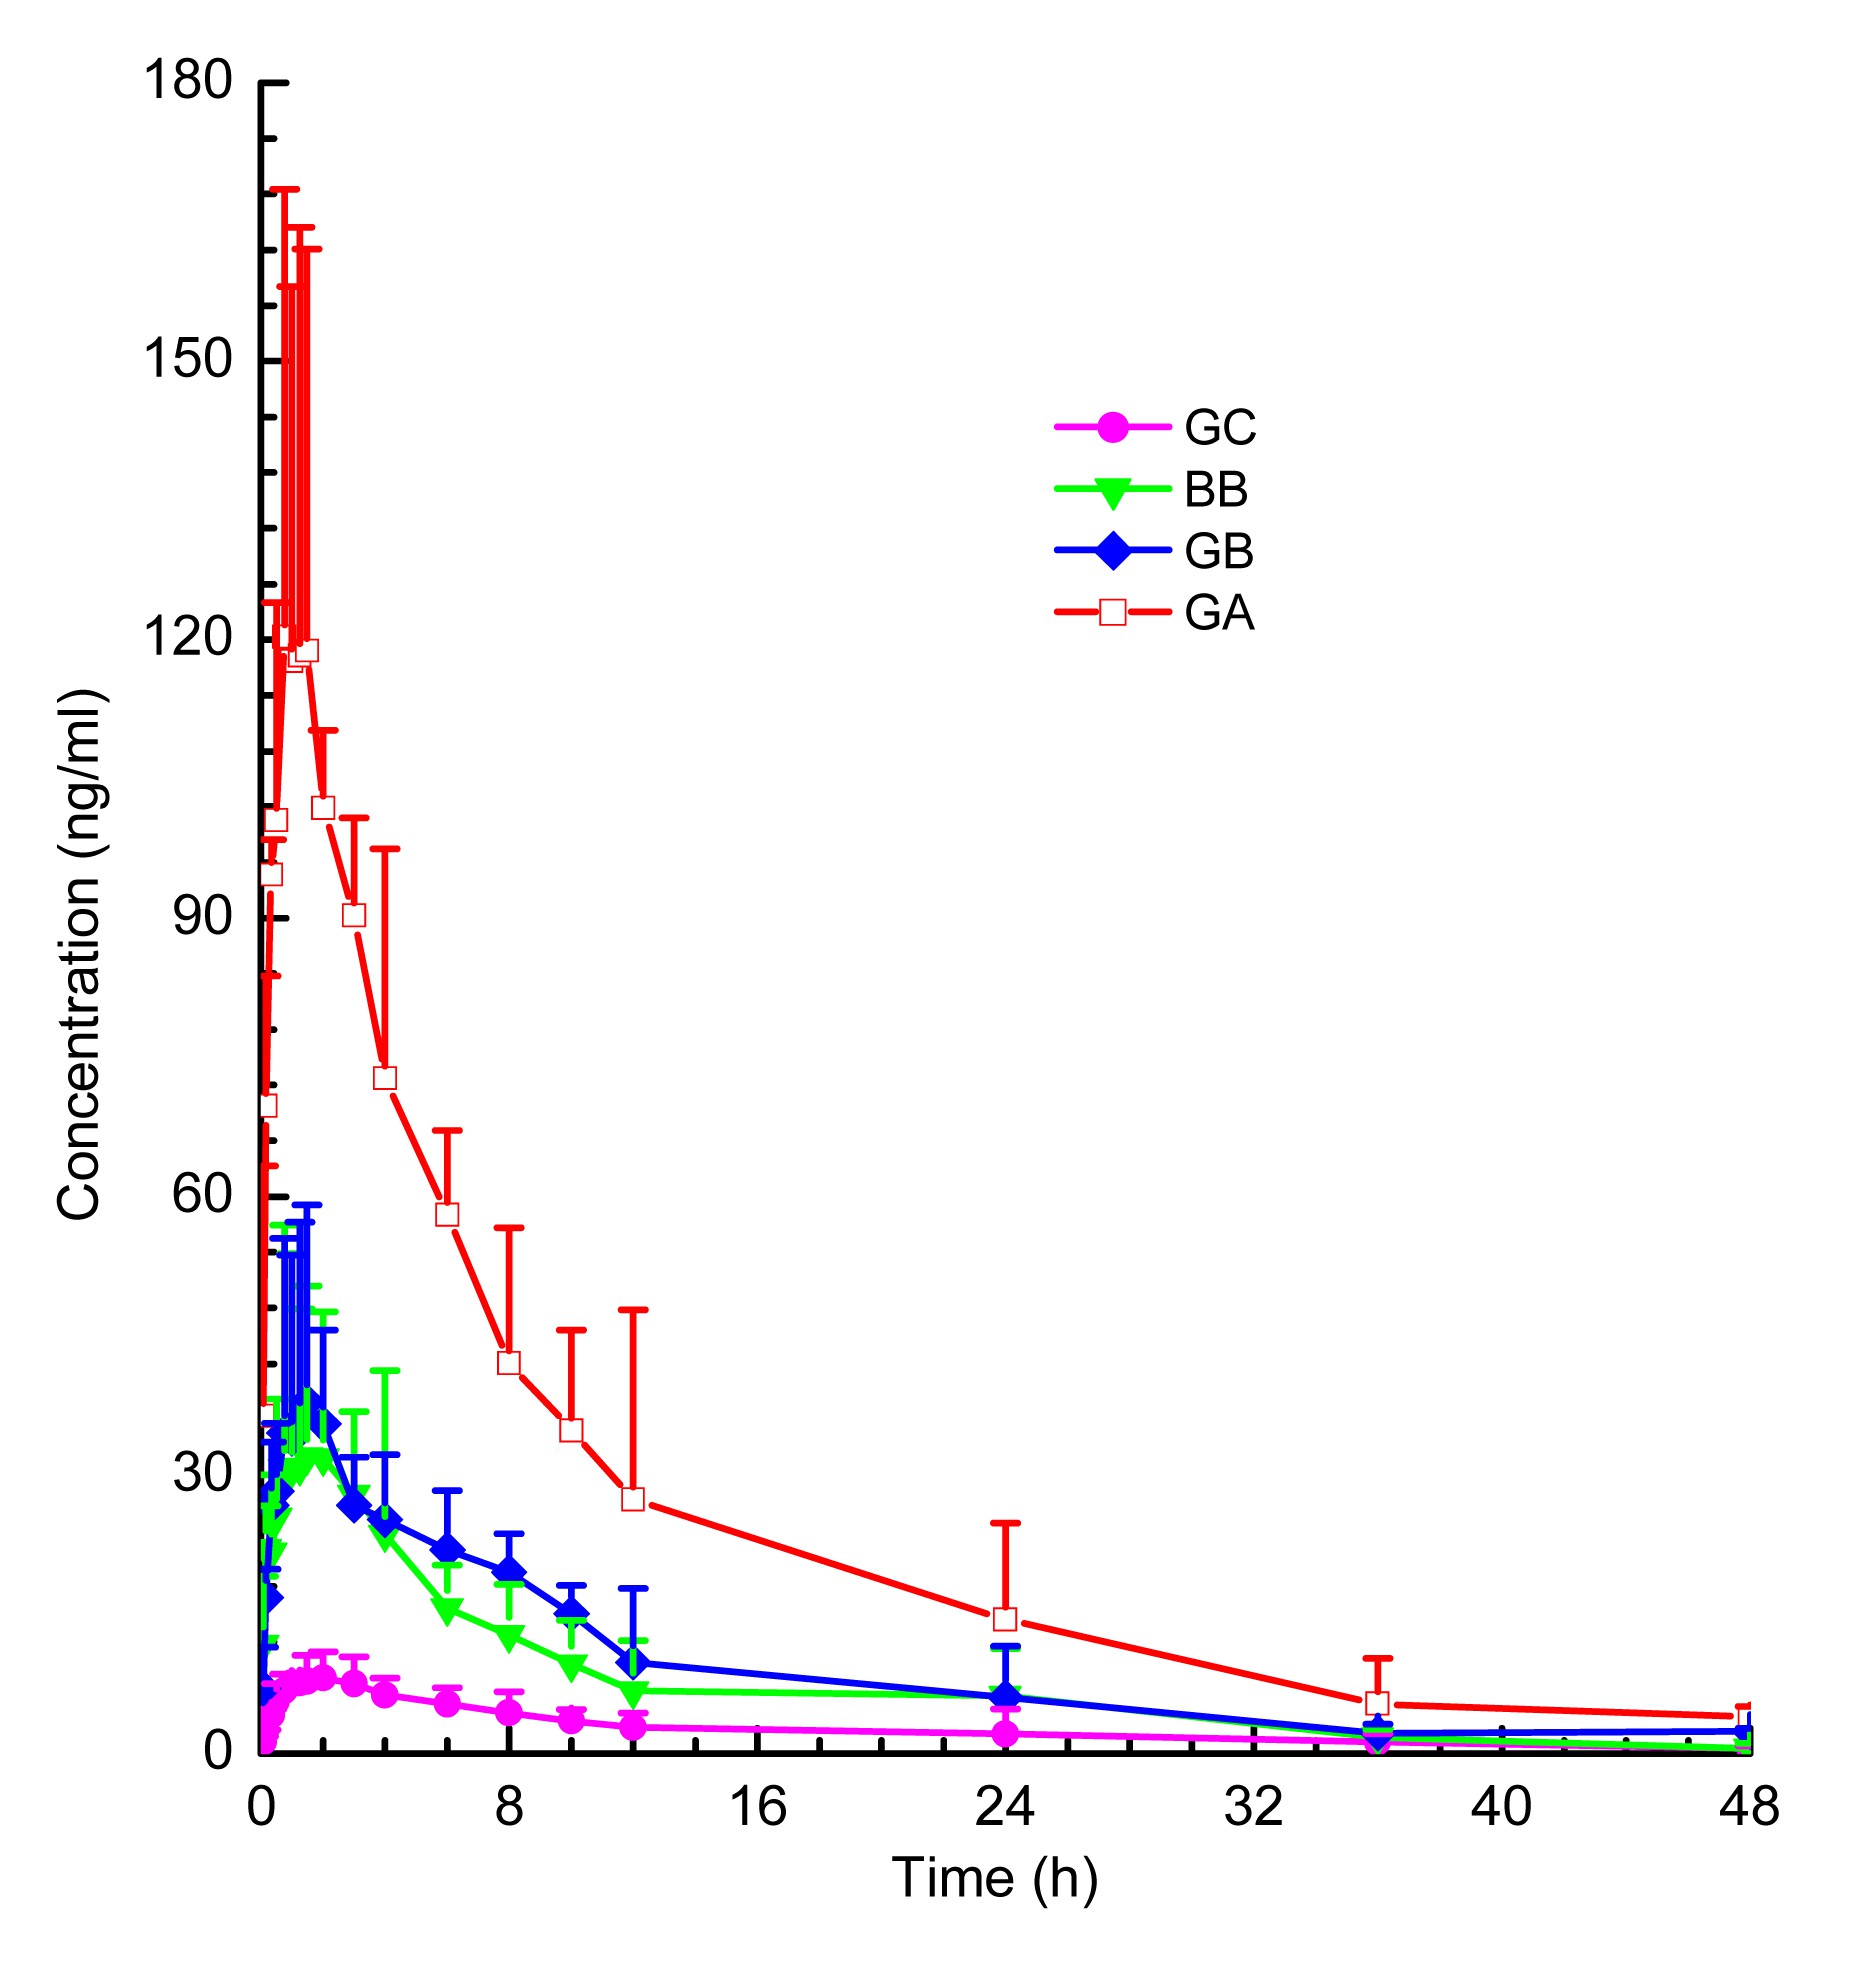
The UPLC-ESI-MS/MS method was successfully applied to the pharmacokinetic study of GA, BB, GB, GC, QCT, KMF, and ISR in rat plasma after oral administration of GBTs. The mean plasma concentration-time profiles of the terpene lactones and the flavonols in rats after a single oral dose of GBTs are shown in Figs.
4 and
5, respectively. The pharmacokinetic parameters are shown in Tables
7 and
8. Note that there were marked differences between the pharmacokinetic behavior of terpene lactones and flavonols. After oral administration of GBTs, terpene lactones were eliminated faster than flavonols. This is consistent with Chen et al. (
2013). Moreover, the flavonols presented double peaks in curves of mean plasma concentration. This phenomenon was also reported previously and indicates that these components might have enterohepatic recirculation (Tang et al.,
2009; Chen et al.,
2010).
Fig.4
Plasma concentration-time profiles of bilobalide (BB), ginkgolide A (GA), ginkgolide B (GB), and ginkgolide C (GC) in rats after a single oral dose of GBTs
Data are presented as mean±SD, n=5
Fig.5
Plasma concentration-time profiles of quercetin (QCT), kaempferol (KMF), and isorhamnetin (ISR) in rats after a single oral dose of GBTs
Data are presented as mean±SD, n=5
Table 7
Pharmacokinetic parameters of BB, GA, GB, and GC following a single oral administration of GBTs to rats
| Analyte |
C
max (ng/ml) |
T
max (h) |
AUC0–t
(ng/(ml·h)) |
AUC0–INF (ng/(ml·h)) |
T
1/2 (h) |
MRT (h) |
| BB |
40.62±20.53 |
2.08±1.81 |
303.02±66.64 |
346.69±104.26 |
3.58±1.86 |
5.65±2.60 |
| GA |
130.10±39.73 |
1.15±0.42 |
1125.74±283.31 |
1243.46±386.35 |
3.66±1.20 |
7.15±3.46 |
| GB |
38.88±19.77 |
0.92±0.49 |
428.37±134.55 |
457.32±148.72 |
4.60±2.80 |
6.72±2.32 |
| GC |
9.36±1.85 |
3.20±1.89 |
132.44±63.55 |
140.48±61.59 |
5.48±0.86 |
8.52±1.50 |
Data are presented as mean±SD, n=5. BB: bilobalide; GA: ginkgolide A; GB: ginkgolide B; GC: ginkgolide C; C
max: peak concentration; T
max: peak time; AUC0–t
: area under the curve from 0 h to t h; AUC0–INF: area under the curve from 0 h to infinite; T
1/2: half-life; MRT: mean residence time
Table 8
Pharmacokinetic parameters of QCT, KMF, and ISR following a single oral administration of GBTs to rats
| Analyte |
C
1max (ng/ml) |
C
2max (ng/ml) |
T
1max (h) |
T
2max (h) |
AUC0–t
(ng/(ml·h)) |
AUC0–INF (ng/(ml·h)) |
T
1/2 (h) |
MRT (h) |
| QCT |
26.40±5.74 |
13.45±6.60 |
0.22±0.19 |
11.50±11.54 |
285.04±78.20 |
444.80±174.77 |
26.74±9.38 |
45.48±11.10 |
| KMF |
12.26±2.37 |
14.81±7.54 |
0.18±0.18 |
9.00±8.49 |
297.22±209.13 |
552.27±283.01 |
14.23±3.38 |
29.70±6.19 |
| ISR |
11.55±4.93 |
21.04±8.40 |
0.25±0.23 |
12.00±11.02 |
704.86±328.49 |
978.37±465.73 |
22.46±2.00 |
37.29±5.18 |
Data are presented as mean±SD, n=5. QCT: quercetin; KMF: kaempferol; ISR: isorhamnetin; C
max: peak concentration; T
max: peak time; AUC0–t
: area under the curve from 0 h to t h; AUC0–INF: area under the curve from 0 h to infinite; T
1/2: half-life; MRT: mean residence time
4. Conclusions
In this study, a UPLC-ESI-MS/MS method was developed and validated for simultaneous quantification of plasma concentrations of BB, GA, GB, GC, QCT, KMF, and ISR. A simple and high recovery extraction method was carried out for sample pretreatment. Moreover, no interference was found between endogenous substances and the analytes. The developed method has proven to be very sensitive and reliable, and offers shorter analysis time over existing methods, with a single run taking only 4 min. In conclusion, the established UPLC-ESI-MS/MS method demonstrated good performance including specificity, linearity, detection and quantification limits, precision and accuracy, and was successfully used to quantify the seven bioactive compounds in rat plasma to support pharmacokinetic studies.
* Project supported by the National Basic Research Program (973) of China (No. 2012CB724001), the National Natural Science Foundation of China (No. 81473365), the Beijing Natural Science Foundation of China (No. 7132172), the Independent Project of Beijing University of Chinese Medicine (No. 2014-JYBZZ-XS-106), and the Innovative Research Team of Beijing University of Chinese Medicine (No. 2011-CXTD-13), ChinaCompliance with ethics guidelines Wen-ping WANG, Na LIU, Qian KANG, Pei-pei DU, Yi LAN, Bo-chen ZHAO, Yan-yan CHEN, Qing ZHANG, Hui LI, Ye-wen ZHANG, and Qing WU declare that they have no conflict of interest.References
[1] Bokkenheuser, V.D., Shackleton, C.H., Winter, J., 1987. Hydrolysis of dietary flavonoid glycosides by strains of intestinal bacteroides from humans.
Biochem J, 248(3):953-956.

[2] Chandra, A., Li, Y., Rana, J., 2011. Qualitative categorization of supplement grade
Ginkgo biloba leaf extracts for authenticity.
J Funct Foods, 3(2):107-114.

[3] Chen, Z.P., Sun, J., Chen, H.X., 2010. Comparative pharmacokinetics and bioavailability studies of quercetin, kaempferol and isorhamnetin after oral administration of
Ginkgo biloba extracts,
Ginkgo biloba extract phospholipid complexes and
Ginkgo biloba extract solid dispersions in rats.
Fitoterapia, 81(8):1045-1052.
[4] Chen, F., Li, L., Xu, F., 2013. Systemic and cerebral exposure to and pharmacokinetics of flavonols and terpene lactones after dosing standardized
Ginkgo biloba leaf extracts to rats via different routes of administration.
Br J Pharmacol, 170(2):440-457.
[5] Chinese Pharmacopoeia Commission, 2010. Chinese Pharmacopoeia. China Medical Science Press,Beijing :1079-1081.
[6] Dams, R., Huestis, M.A., Lambert, W.E., 2003. Matrix effect in bio-analysis of illicit drugs with LC-MS/MS: influence of ionization type, sample preparation, and biofluid.
J Am Soc Mass Spectr, 14(11):1290-1294.
[7] Deng, F., Zito, S.W., 2003. Development and validation of a gas chromatographic-mass spectrometric method for simultaneous identification and quantification of marker compounds including bilobalide, ginkgolides and flavonoids in
Ginkgo biloba L. extract and pharmaceutical preparations.
J Chromatogr A, 986(1):121-127.
[8] Diamond, B.J., Shiflett, S.C., Feiwel, N., 2000.
Ginkgo biloba extract: mechanisms and clinical indications.
Arch Phys Med Rehabil, 81(5):668-678.
[9] Du, P., Zhao, B., Wang, W., 2013. Studies on evaluation of sustained release tablets of extracts of
Ginkgo biloba releasing rate
in vitro by pharmacological indicatrix.
China J Chin Mat Med, (in Chinese),38(14):2292-2296.
[10] Ellnain-Wojtaszek, M., Kruczyński, Z., Kasprzak, J., 2003. Investigation of the free radical scavenging activity of
Ginkgo biloba L. leaves.
Fitoterapia, 74(1-2):1-6.
[11] Hu, J., Zhao, Y., Ma, C., 2010. Acid hydrolytic method for determination of
Ginkgo biloba total flavonoids in rat plasma by HPLC for pharmacokinetic studies.
Tsinghua Sci Technol, 15(4):452-459.
[12] Jin, M., Guo, Q., Sun, X., 2011. Pharmacokinetics of ginkgolides sustained-release tablet.
China J Chin Mat Med, (in Chinese),36(8):1011-1014.
[13] Kim, D.H., Jung, E.A., Sohng, I.S., 1998. Intestinal bacterial metabolism of flavonoids and its relation to some biological activities.
Arch Pharm Res, 21(1):17-23.
[14] Korth, R., Nunez, D., Bidault, J., 1988. Comparison of three PAF-acether receptor antagonist ginkgolides.
Eur J Pharmacol, 152(1-2):101-110.
[15] Loh, K.P., Low, L.S., Wong, W.H., 2006. A comparison study of cerebral protection using
Ginkgo biloba extract and losartan on stroked rats.
Neurosci Lett, 398(1-2):28-33.
[16] Manach, C., Texier, O., Rgrat, F., 1996. Dietary quercetin is recovered in rat plasma as conjugated derivatives of isorhamnetin and quercetin.
J Nutr Biochem, 7(7):375-380.
[17] Silberberg, M., Morand, C., Manach, C., 2005. Co-administration of quercetin and catechin in rats alters their absorption but not their metabolism.
Life Sci, 77(25):3156-3167.
[18] Stackman, R.W., Eckenstein, F., Frei, B., 2003. Prevention of age-related spatial memory deficits in a transgenic mouse model of Alzheimer’s disease by chronic
Ginkgo biloba treatment.
Exp Neurol, 184(1):510-520.
[19] Tang, D.Q., Yin, X.X., Zhang, Z.J., 2009. Gradient HPLC-DAD for the simultaneous determination of five flavonoids in plasma after intravenously administrated
Ginkgo biloba extract and its application in the study of pharmacokinetics in rats.
J Liquid Chromatogr Rel Technol, 32(14):2065-2079.
[20] Wu, C., Wang, Y., Zhang, J., 2013. Simultaneous determination of seven bioactive components of
Ginkgo biloba L. in dog plasma by HPLC-MS/MS and its application in relative bioavailability of the tincture extract of
Ginkgo biloba leaves.
Chin J New Drugs, (in Chinese),22(1):93-99.
[21] Xie, J., Ding, C., Ge, Q., 2008. Simultaneous determination of ginkgolides A, B, C and bilobalide in plasma by LC-MS/MS and its application to the pharmacokinetic study of
Ginkgo biloba extract in rats.
J Chromatogr B, 864(1-2):87-94.
[22] Xu, Y., Xu, K., 2011. Systematic review of ginkgo leaves tablet for angina.
Chin J Exp Trad Med Formulae, (in Chinese),17(16):288-293.
[23] Yodogawa, S., Arakawa, T., Sugihara, N., 2003. Glucurono- and sulfo-conjugation of kaempferol in rat liver subcellular preparations and cultured hepatocytes.
Biol Pharm Bull, 26(8):1120-1124.
[24] Zhang, Z., Peng, D., Zhu, H., 2012. Experimental evidence of
Ginkgo biloba extract EGB as a neuroprotective agent in ischemia stroke rats.
Brain Res Bull, 87(2-3):193-198.
[25] Zhao, Y., Sun, Y., Li, C., 2008. Simultaneous determination of Ginkgo flavonoids and terpenoids in plasma: ammonium formate in LC mobile phase enhancing electrospray ionization efficiency and capacity.
J Am Soc Mass Spectr, 19(3):445-449.

Open peer comments: Debate/Discuss/Question/Opinion
<1>