Jian Liu, Quan-bao Wang, Hai-tao Zhao, Ji-an Chen, Ye Qiu, Deng-ping Duan. Optimization design of the stratospheric airship’s power system based on the methodology of orthogonal experiment[J]. Journal of Zhejiang University Science A, 2013, 14(1): 38-46.
@article{title="Optimization design of the stratospheric airship’s power system based on the methodology of orthogonal experiment", author="Jian Liu, Quan-bao Wang, Hai-tao Zhao, Ji-an Chen, Ye Qiu, Deng-ping Duan", journal="Journal of Zhejiang University Science A", volume="14", number="1", pages="38-46", year="2013", publisher="Zhejiang University Press & Springer", doi="10.1631/jzus.A1200138" }
%0 Journal Article %T Optimization design of the stratospheric airship’s power system based on the methodology of orthogonal experiment %A Jian Liu %A Quan-bao Wang %A Hai-tao Zhao %A Ji-an Chen %A Ye Qiu %A Deng-ping Duan %J Journal of Zhejiang University SCIENCE A %V 14 %N 1 %P 38-46 %@ 1673-565X %D 2013 %I Zhejiang University Press & Springer %DOI 10.1631/jzus.A1200138
TY - JOUR T1 - Optimization design of the stratospheric airship’s power system based on the methodology of orthogonal experiment A1 - Jian Liu A1 - Quan-bao Wang A1 - Hai-tao Zhao A1 - Ji-an Chen A1 - Ye Qiu A1 - Deng-ping Duan J0 - Journal of Zhejiang University Science A VL - 14 IS - 1 SP - 38 EP - 46 %@ 1673-565X Y1 - 2013 PB - Zhejiang University Press & Springer ER - DOI - 10.1631/jzus.A1200138
Abstract: The optimization design of the power system is essential for stratospheric airships with paradoxical requirements of high reliability and low weight. The methodology of orthogonal experiment is presented to deal with the problem of the optimization design of the airship’s power system. Mathematical models of the solar array, regenerative fuel cell, and power management subsystem (PMS) are presented. The basic theory of the method of orthogonal experiment is discussed, and the selection of factors and levels of the experiment and the choice of the evaluation function are also revealed. The proposed methodology is validated in the optimization design of the power system of the ZhiYuan-2 stratospheric airship. Results show that the optimal configuration is easily obtained through this methodology. Furthermore, the optimal configuration and three sub-optimal configurations are in the Pareto frontier of the design space. Sensitivity analyses for the weight and reliability of the airship’s power system are presented.
Darkslateblue:Affiliate; Royal Blue:Author; Turquoise:Article
Article Content
1. Introduction
The stratospheric airship is an aerostat designed to fly at stratosphere, at nearly 20 km altitude. It has the ability of fixed-point suspension and can be maneuvered in wind speeds of 30 m/s. It can stay in the stratosphere for a long period of time. The stratospheric airship has many merits such as high cost-effectiveness, good mobility and viability, long endurance, and ease of update and maintenance. It can play a significant role in many fields, for example, the command and control of battlefield, data and communications relay, real-time tracking, surveillance and reconnaissance, border patrol, etc.
To meet the requirement of long endurance, a regenerative power system is usually applied in the stratospheric airship to generate the needed power. The power system is expected to be sufficiently strong and have no failures during operation. In other words, the power system must have high reliability. Furthermore, as the total net buoyancy of an airship is limited, the power system has the limitation of weight. High reliability usually means redundancy in the power system, which adds weight to the power system. It is contradictory to minimize weight while setting redundancy in the airship’s power system. Therefore, a critical aspect in the optimization design of the power system is how to satisfy both requirements of maximum reliability and minimum weight.
To date, a lot of effort has been taken on the design of the airship’s power system (Naito et al., 1999; Lee et al., 2009; Okaya et al., 2011; Smith et al., 2011). Several types of the airship’s power systems were discussed for their topology and theory. These works also provided weight parameters of given components and parts in the power system. However, none of these studies analyzed the reliability of the power system. Other effort has been made on the reliability of two subsystems of the airship’s power system, namely the solar array and regenerative fuel cell. Among the research of the reliability of the solar array, most attention was paid to the intrinsic reliability issues of thin-film solar cells and their probable physical causes (Alam et al., 2010; James, 2010) and the method of reliability evaluation of the solar array (Frulla, 2002; Gautam and Kaushika, 2002). As to the reliability of the regenerative fuel cell, a lot of effort was taken on reliability models (Tanrioven and Alam, 2006; Mangoni et al., 2007), measures of improving reliability (Kimble and Hoberecht, 2003) and the reliability results of fuel cell tests (Bents, 2008). To the author’s knowledge, no work deals with the optimization design of the power system.
The purpose of this paper is to propose an optimization design method for the power system of the stratosphere airship. Reliability and weight models of the power system are created based upon the configuration and redundancy of the power system. The methodology of orthogonal experiment is discussed. The ZhiYuan-2 (ZY-2) is used as a demonstration problem to show the capability of this reliability-based optimization method. The sensitivity analyses for the weight and the reliability of the airship’s power system are also presented.
2. Airship’s power system and its reliability and weight model
2.1. Airship’s power system
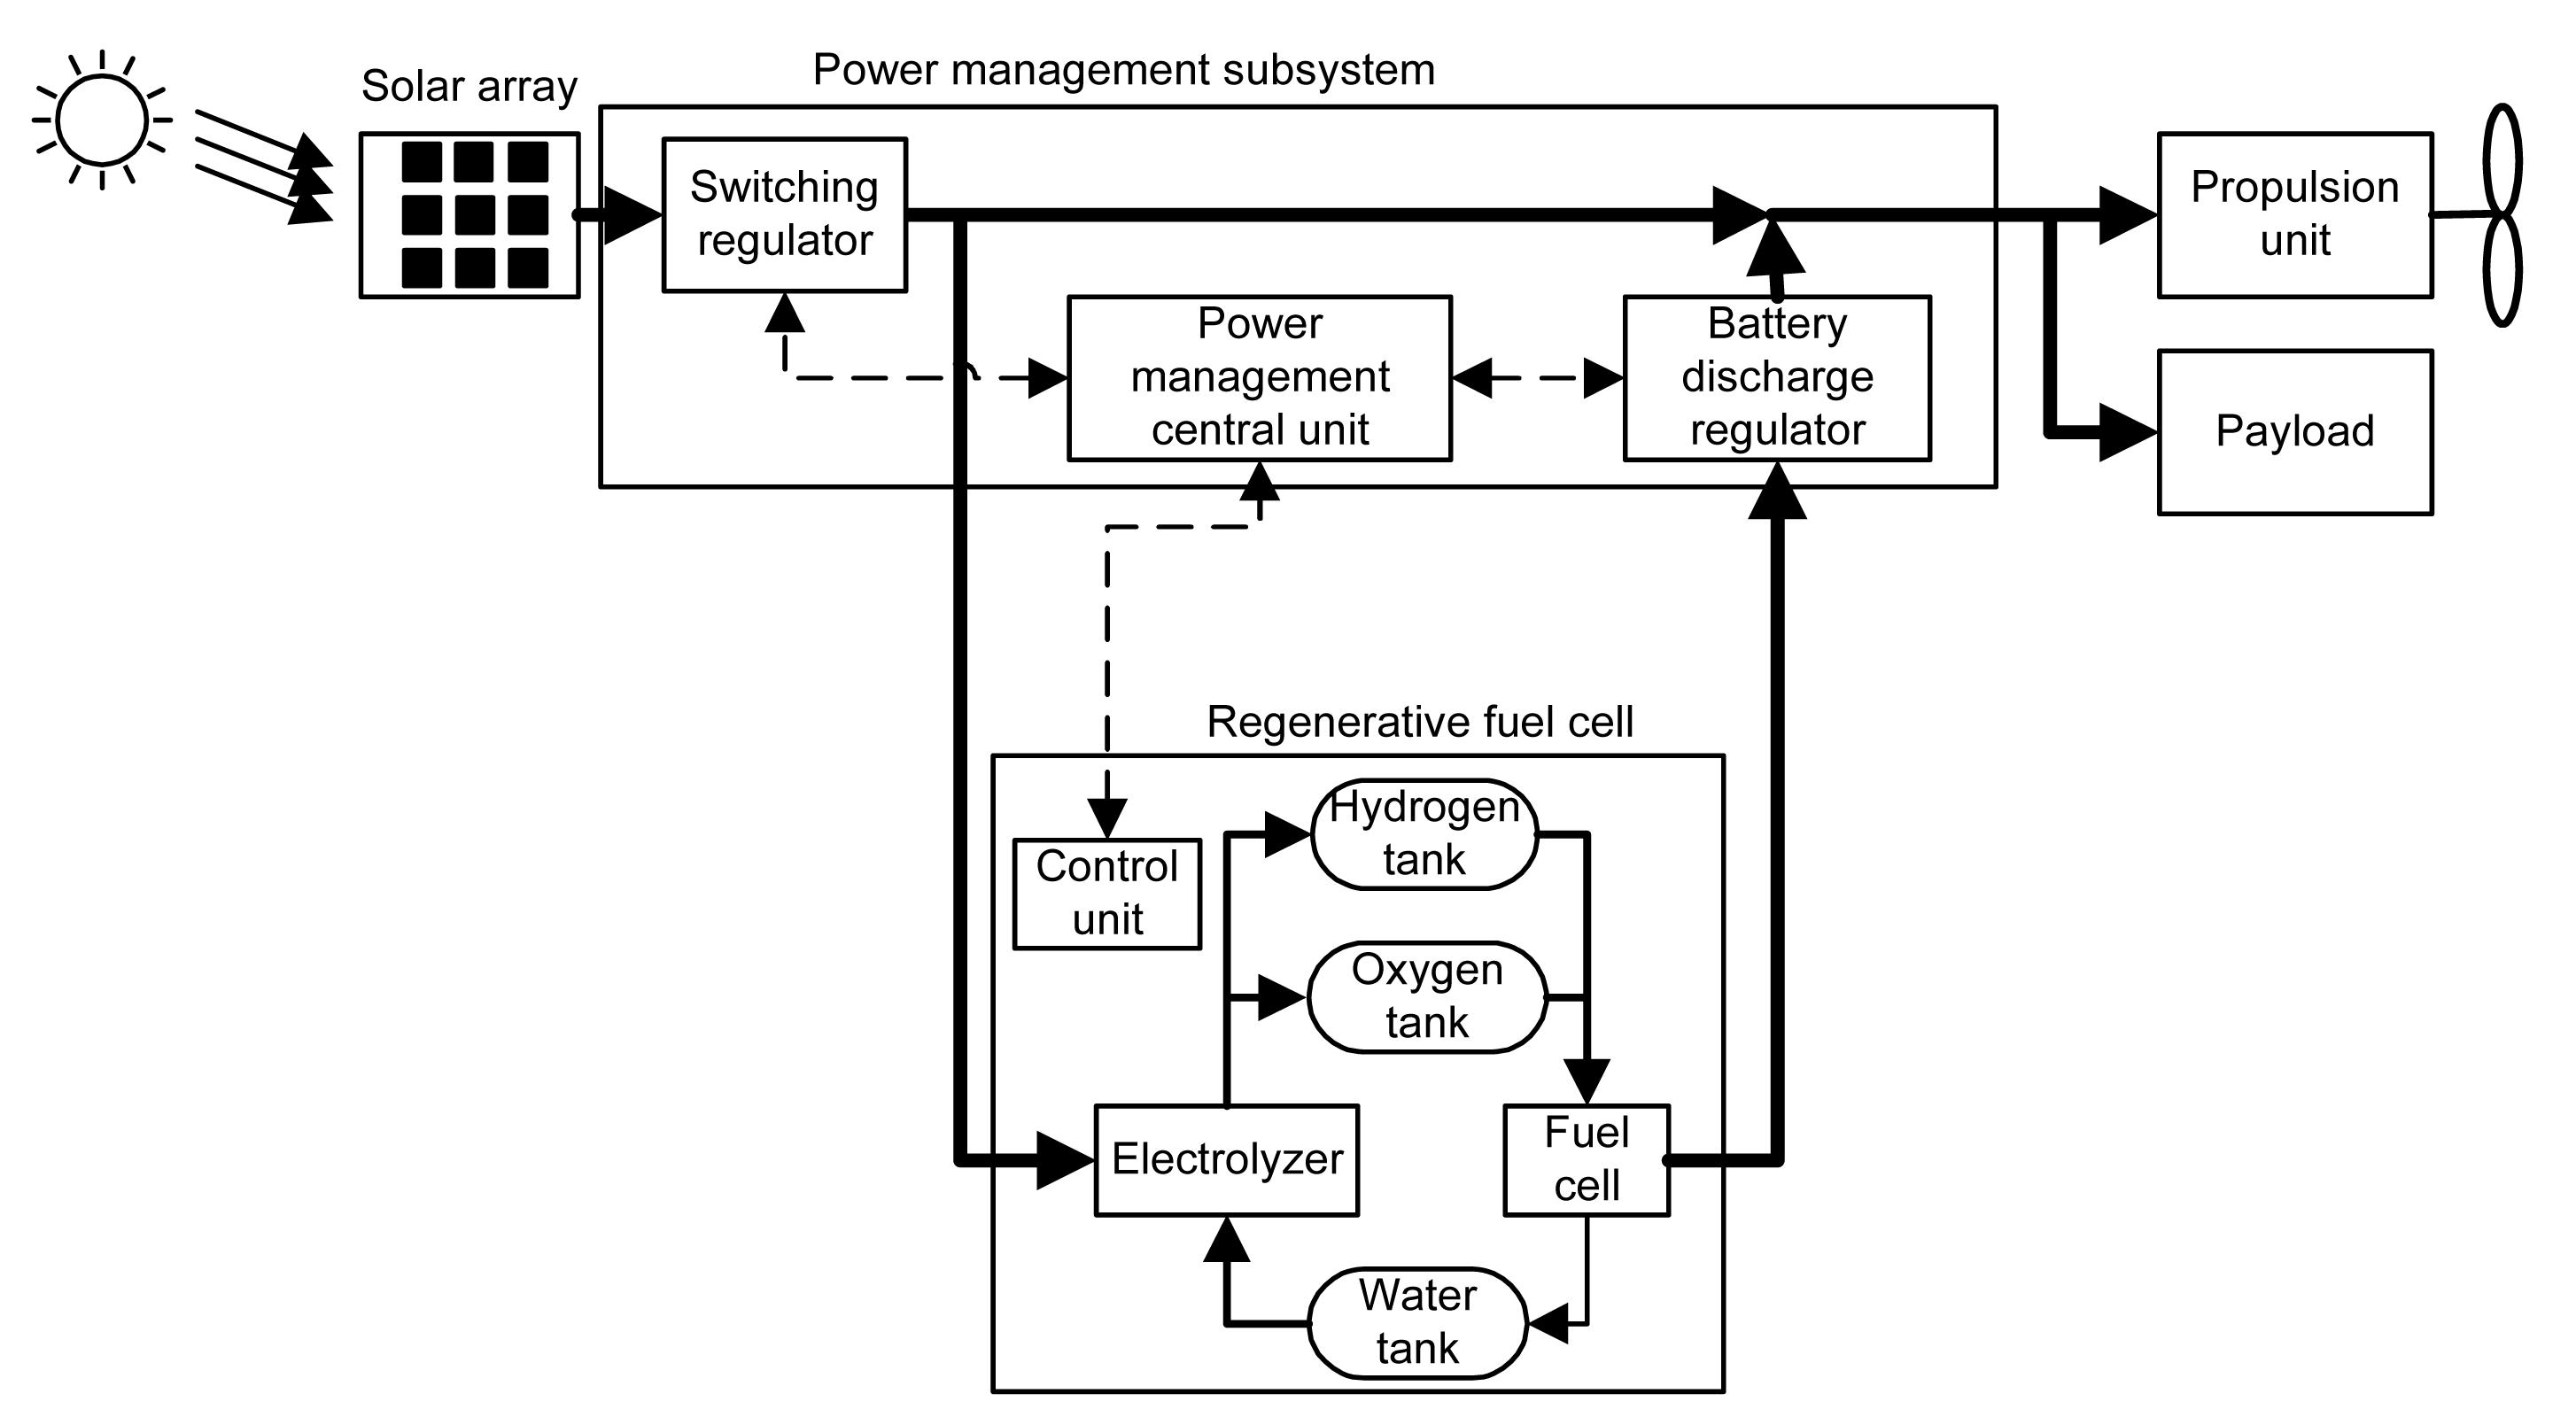
The power system of an airship consists of all of the components that collect, generate, and store energy and convert that energy into useable power. A baseline power system is a photovoltaic/regenerative fuel cell system. The typical power system is shown in Fig. 1. It includes the thin-film solar array (SA), the regenerative hydrogen-oxygen fuel cell (RFC), and the power management subsystem (PMS).
Fig.1 Regenerative power system and propulsion system
The thin-film solar cell array, which lies on the surface of the airship, converts the solar energy into the electrical energy in the daytime. The electrical energy is regulated by the PMS and distributed to electronic equipment in the airship. The superfluous energy is stored in the fuel cell to supplement the energy released in the night. When there is no solar energy in the nighttime, the fuel cell discharges its energy and the PMS converts the energy to the electrical energy used by payloads of the airship.
The PMS consists of a switching regulator (SR), a battery discharging regulator (BDR), and a power management central unit (PMCU). The output voltage of the solar cell array is regulated by the SR. BDR performs as a DC/DC converter when transforming the fuel cell’s voltage to the bus’s voltage. PMCU supervises and coordinates the running state of the SR, RFC and BDR to maintain the continuous operation of the power system.
2.2. Reliability and weight model of solar array (SA)
To generate the electrical power required by the payloads of the airship, solar cells are usually firstly connected in series to form a string to obtain the desired voltage and then the individual strings are connected in parallel to form an array to produce the desired current. For the convenience of analysis, it is assumed that there are m solar cells in one string and n+k strings in one solar array, where n represents the quantity of minimum strings and k represents the quantity of redundant strings in the solar array.
The weight model of SA is given as
,
where ASA is the area of SA, σSC is the specific weight of SA, and mSC1 is the additional weight of SA for fixing and power transmission.
The area of SA is calculated on the condition of the required power pneed as shown in Eq. (2) (Colozza, 2003; Wang et al., 2009a; 2009b). The required power is determined by the power of all payloads ptotal, the output efficiency of the discharging unit ηdischarge, the efficiency of the electrolyzer ηelectrolyzer, the output efficiency of the fuel cell ηFC, and the duration of the night tnight.
.
The reliability of one solar cell string RSC is
,
where RC, RW, and RD are the reliability of one solar cell, the wire, and the separate diode, respectively.
As one solar cell string usually connects in series with one solar shunt regulator circuit, the reliability of the solar array should be considered with the reliability of the solar shunt regulator circuit. It will be shown in the subsection 2.4.1.
2.3. Reliability and weight model of regenerative hydrogen-oxygen fuel cell (RFC)
RFC includes two subsystems: the fuel cell and the elctrolyzer. It consists of a fuel cell stack, an electrolyzer unit, reactant tanks, valves, regulators, filters, pipes, sensors and a controller. To minimize the complexity of the development and keep good maintainability, module rating technique is usually used in the design of RFC (Martin et al., 1984). In this study, it is assumed that there are p+q modules in an RFC in which p modules are minimally required and q modules are redundancy. The formula for calculating the weight of RFC is shown as follows:
,
where σFC is the specific weight of fuel cell.
Assuming various parts of the RFC are independent of each other, the reliability block diagram is in series. If failure rates of all components are obtained, the formula for calculating the reliability of one RFC module is expressed as
,
where λi is the failure rate of the component i, r is the quantity of components in one RFC module, and t is the life time of the airship.
2.4. Reliability and weight model of power management subsystem (PMS)
2.4.1. Reliability and weight model of switching regulator (SR)
SR includes several shunt regulating circuits which provides a path from the supplied voltage to the ground to regulate the bus voltage. The quantity of shunt regulating circuits is equal to the quantity of solar cell strings. The weight of SR can be calculated by
,
where mi is the weight of the component i, l is the quantity of components in one SR circuit, and mSR1 is the additional weight for the fixing structure and electrical wires.
The reliability of a shunt regulating circuit of SR is shown as follows:
.
The method of parallel redundancy is usually applied in SR to improve the reliability. In this regard, the calculation of the weight is given in Eq. (8). It is assumed that the additional weight of SR which includes the weight of the supporting frame, wire and plug only increases 20% for the utilization of the existing spare space which partially saves the weight of the fixing structure and electrical wires.
.
The reliability model of a paralleled shunt regulating circuit is given by
.
As each shunt regulating circuit connects to one solar cell string, the total reliability of the solar array and the shunt regulator is
.
The total reliability of one shunt regulating circuit and one solar cell string is calculated by
2.4.2. Reliability and weight model of battery discharging regulator (BDR)
BDR performs the function of converting the RFC’s energy to bus energy. The quantity of BDR modules configured in the power management system is just equal to the quantity of RFC modules. The weight and reliability model of BDR is similar to the model of SR, i.e.,
,
,
where y is the quantity of components in one BDR module, and mBDR1 is the additional weight for the fixing structure and electrical wires.
BDR usually uses the method of parallel redundancy to improve reliability. Thus, the weight and reliability model of BDR is shown as follows. In Eq. (14), the additional weight of BDR increases 40% due to the utilization of the existing spare space which partially saves the weight of the fixing structure and electrical wires.
,
.
As one RFC module usually connects to one BDR, the total reliability of an RFC module and a BDR module can be calculated by Eq. (16). The total reliability of the entire RFC and BDR is given in Eq. (17).
,
.
2.4.3. Reliability and weight model of PMCU
In this study, it is assumed that a single PMCU has the fixed weight of mPMCU. The reliability of the PMCU is calculated as follows:
,
where z is the quantity of components in PMCU.
If PMCU is paralleled, it has the weight of 1.8mPMCU. The following equation should be used to calculate the reliability of PMCU:
.
2.5. Reliability and weight model of the power system
The formula of weight calculation for the power system is given in Eq. (20), which is the sum of the weights of SA, RFC, SR, BDR and PMCU.
.
The reliability of the power system can be calculated by
.
3. Methodology of orthogonal experiment
3.1. Outline of the methodology
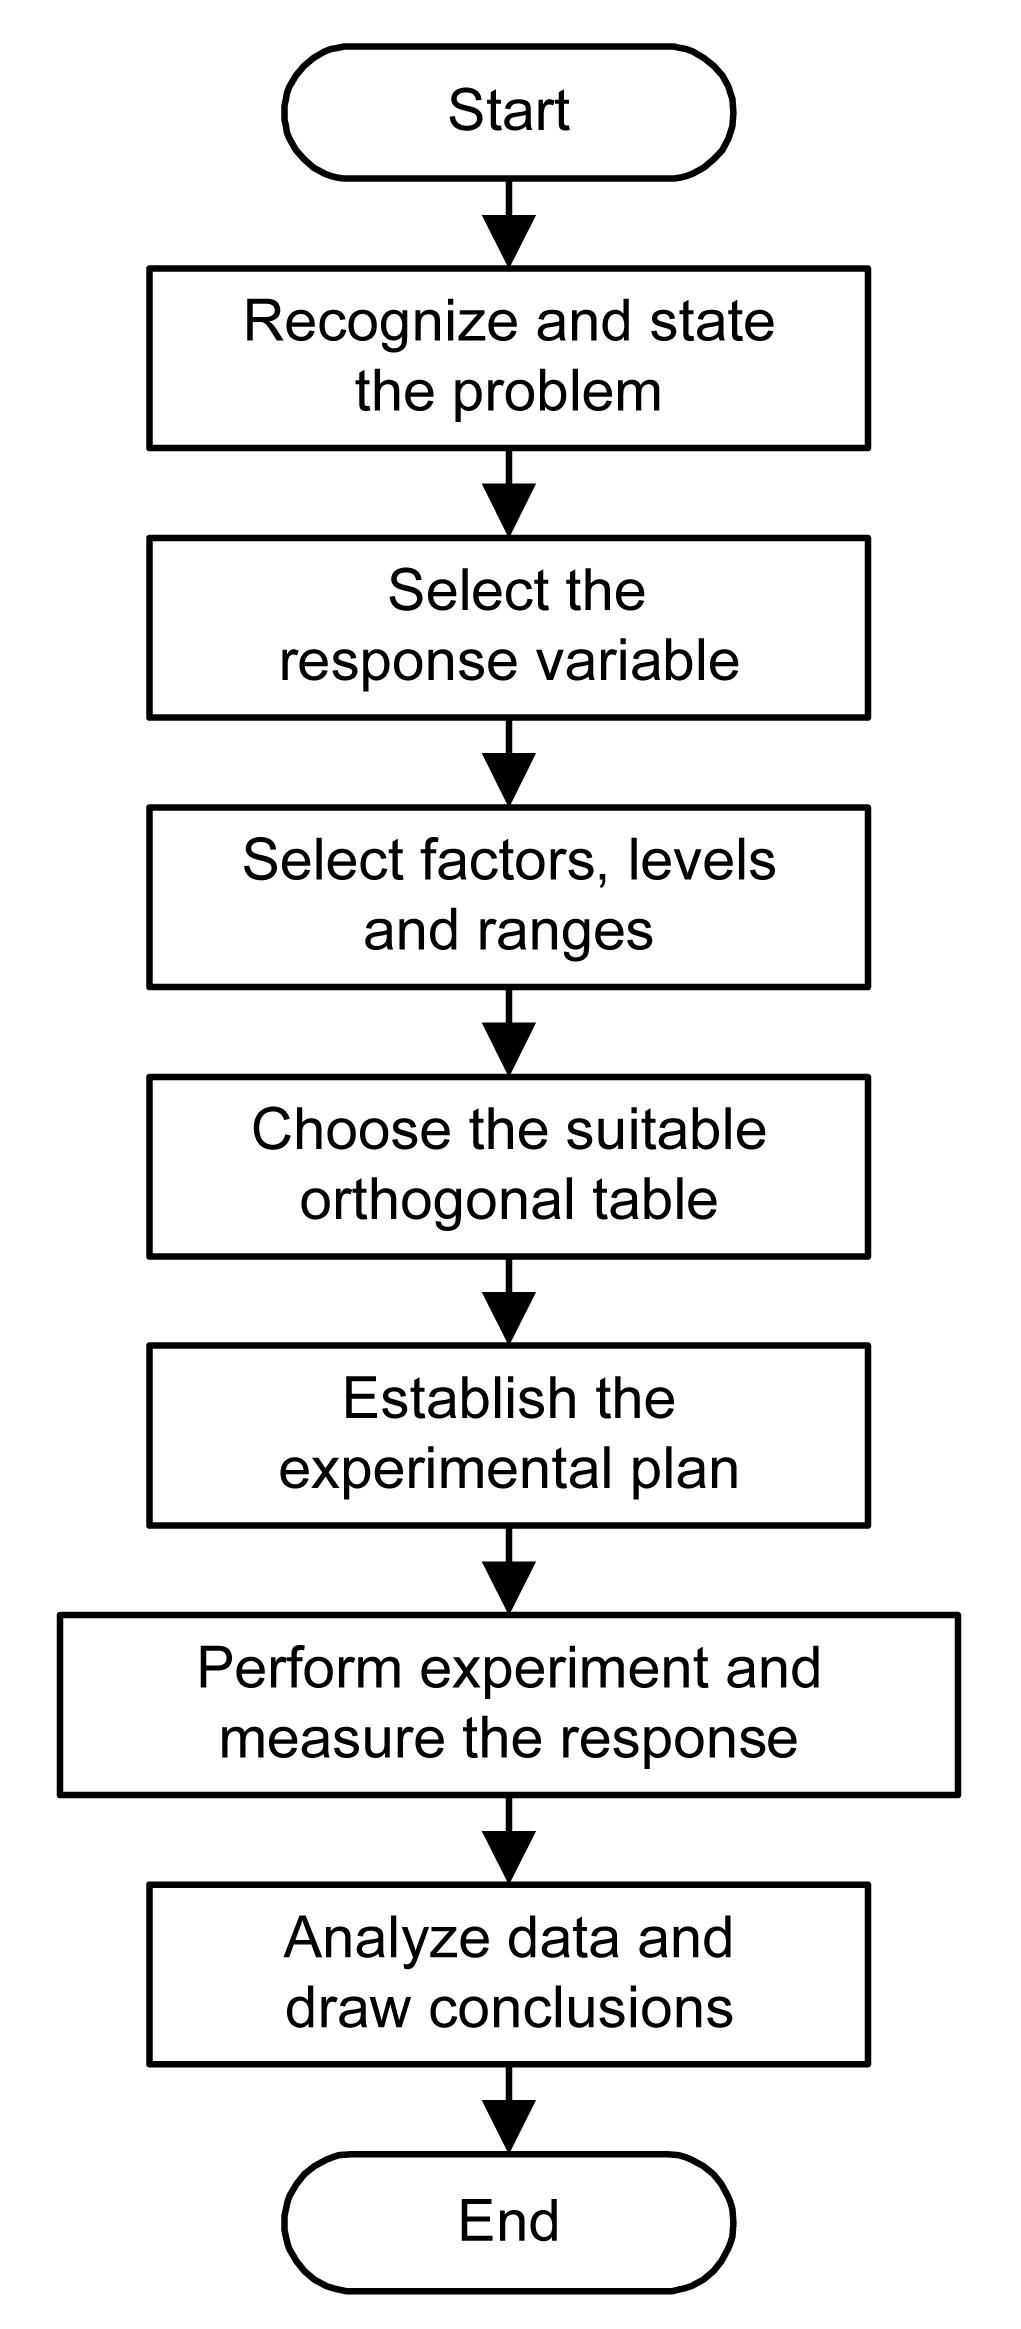
Based on the theory of probability and mathematical statistics, the methodology of orthogonal experiment (Montgomery, 2007; Ren, 2009) is suitable for solving the optimization problem with multi-factors and multi-response variables. The essentials in the methodology of orthogonal experiment are factors, levels, and responses. The factors are the elements which affect the response; the levels are the states of the factor. The change of the level of each factor can bring about the change of the response.
The flow chart of the methodology of orthogonal experiment is shown in Fig. 2. The third and fourth steps are important in practice. Once the factors are selected, the ranges over which these factors vary should be chosen and the specific levels at which the factors run will be made. The suitable orthogonal table or orthogonal array should be selected according to the levels of all factors which have been selected previously.
Fig.2 Flow chart of the methodology of orthogonal experiment
An orthogonal experiment contains a number of orthogonal trials which can be generated by the orthogonal array. The form of the orthogonal array is , where L is the symbol of orthogonal design, a is the number of levels in the orthogonal experiment, u represents the integer series which starts from 2, b is the number of the factors in the orthogonal experiment or the number of columns in the orthogonal array, and b=(au−1)/(a−1). The expression au represents the number of orthogonal trials in the orthogonal experiment or the number of rows in the orthogonal array.
For the orthogonal array of L64(89), it means that the orthogonal experiment has 8 levels, 9 factors, and 64 orthogonal trials. The fractional content of L64(89) is shown in Table 1.
Table 1
Fractional content of orthogonal array of L64(89)
Trial
Factor
1
2
3
4
5
6
7
8
9
1
1
1
1
1
1
1
1
1
1
2
1
2
2
2
2
2
2
2
2
3
1
3
3
3
3
3
3
3
3
4
1
4
4
4
4
4
4
4
4
5
1
5
5
5
5
5
5
5
5
6
1
6
6
6
6
6
6
6
6
7
1
7
7
7
7
7
7
7
7
8
1
8
8
8
8
8
8
8
8
9
2
1
2
5
7
8
4
6
3
…
…
…
…
…
…
…
…
…
…
62
8
6
3
7
1
8
5
2
4
63
8
7
2
6
4
5
8
3
1
64
8
8
1
5
3
6
7
4
2
In this study, two responses of weight and reliability of the power system are selected for the optimization problem. The step of performing the experiment and measuring the response is replaced by estimating the weight and reliability index through the mathematical model previously depicted in section 2.
3.2. Factors and levels of the power system
As mentioned above, there are three subsystems in the power system. With different redundant measures applied in each subsystem, the weight and reliability of every subsystem vary; so does the power system. The selected factors and levels are shown in Table 2.
Table 2
Factors and levels of the airship’s power system
Factor
Level
Quantity of redundant strings in SA
0, 1, 2, 3, 4, 5, 6, 7
Minimum quantity of required modules in RFC
1, 2, 3, 4, 5, 6, 7, 8
Quantity of redundant modules in RFC
0, 1, 2, 3, 4, 5, 6, 7
Redundant configuration of PMS
000, 001, 010, 011, 100, 101, 110, 111
To improve the reliability of SA, paralleled redundant cell strings are usually set. With the increase of redundant strings, the weight and reliability are also increased. Hence, the quantity of redundant strings is chosen as a factor. Eight levels, i.e., from zero to seven, are selected for analysis in which zero represents no redundancy.
With different rating modules, the minimum quantity of required modules in RFC is varied. When considering different combinations of the minimum quantity of required modules and the quantity of redundant modules, the weight and reliability of RFC are varied intricately. Thus, in RFC, the minimum quantity of required modules and the quantity of redundant modules are both chosen as factors. There are eight levels in the factor of the quantity of minimum required modules. Also, eight levels, i.e., from zero to seven, are chosen for the factor of the quantity of redundant modules. The number of each level in these two factors represents the quantity of modules.
The redundant configuration of PMS is chosen as a factor. There are eight levels, i.e., from ‘000’ to ‘111’, in a factor. The digit ‘0’ in each place means that there is no redundancy in SR, BDR, or PMCU and the digit ‘1’ means that redundancy is applied.
3.3. Analysis of the data
The method of comprehensive score is usually applied for evaluating the experimental data to find the optimal configuration of all factors. In this method, every response variable is given a weighted score according to its relative importance. The evaluation function for calculating the comprehensive score is given as
,
where represents the comprehensive score of the trial i, αk is the weighted score assigned for the response variable k, and ck is the transformation factor for the response variable k, which makes the values of all response variables in the same level. If αk is positive, the response variable k is expected to be larger. On the contrary, the response variable k is expected to be smaller when αk is negative.
In the optimization problem of the airship’s power system, low weight and high reliability are equally expected and share the same importance. Hence, αk assumes the same value of one for both responses. As shown in the next section, the reliability ranges from 0 to 1 while the weight ranges from 7800 to 33 000 kg. For a correct comparison of the two responses on the same level, the reliability should be magnified and the weight should be reduced. The evaluation function is given as
,
where yi1 and yi2 denote the response of reliability and weight, respectively.
4. Results
The proposed optimization method is used in the power system design of ZY-2 stratospheric airship. The ZY-2 airship is an aerostat designed to fly at an altitude of 20 000 m and latitude of 35° north. It has an ellipsoidal shape with a total length of nearly 164 m and a radius of nearly 25.4 m. The total mass of the airship is about 15 056.47 kg and the maximum weight of 9000 kg is allocated to the power system. The total power requirement is 120 kW. The detailed list of main parameters of the power system is shown in Table 3.
Table 3
Parameters of the airship’s power system
Parameter
Value
Solar array
Area density (kg/m2)
0.12
Efficiency
12%
RFC
Efficiency of fuel cell
65%
Efficiency of electrolyzer
85%
Specific weight (W/kg)
500
PMS
Efficiency of BDR
95%
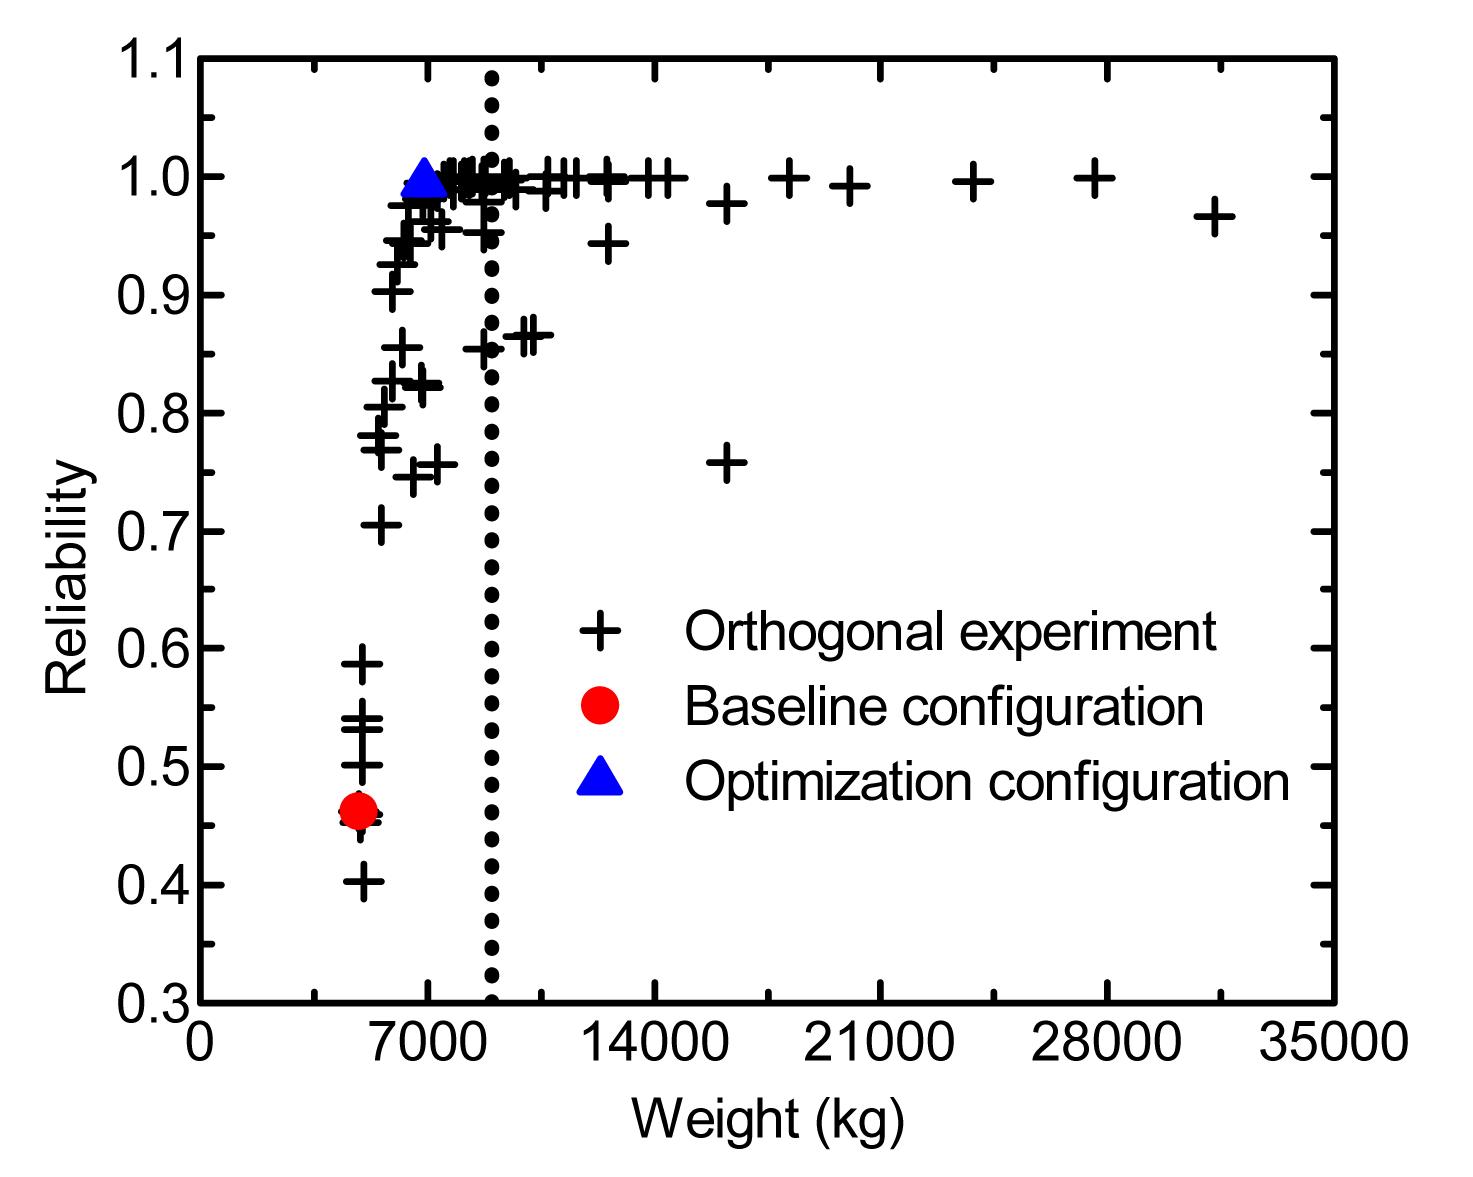
The orthogonal table L64(89) which consists of 64 experiments is chosen for experimental design. Results of all 64 configurations of the power system are shown in Fig. 3, where points in the left side of the dotted line are acceptable results. Table 4 gives the results of the baseline configuration, the optimal configuration and the other three sub-optimal configurations. The baseline configuration has the weight of 4897.36 kg and the reliability of 0.46198. The optimal configuration is illuminated with the rhombus. In this configuration, the reliability increases 115.3% which is up to 0.99495 while the weight only increases 41.23%, 6917 kg equivalently.
Fig.3 Orthogonal experimental results of the airship’s power system
Table 4
Optimization results of the power system configuration
Configuration
Redundant strings in SA
Required modules in RFC
Redundant modules in RFC
Redundancy in SR
Redundancy in BDR
Redundancy in PMCU
Weight (kg)
Reliability
Weighted score
Baseline
0
1
0
No
No
No
4897.36
0.46198
413.00
Optimization
3
8
4
Paralleled
Paralleled
No
6917.00
0.99495
895.74
Sub-optimization
No. 1
2
7
5
Paralleled
Paralleled
Paralleled
7713.42
0.99883
921.70
No. 2
6
6
4
No
Paralleled
Paralleled
7523.38
0.99596
920.73
No. 3
4
8
6
No
No
No
7807.95
0.99865
920.57
Fig. 4 shows the Pareto frontier of all 64 experiments. The Pareto frontier is the boundary created by finding all of the design configurations that have the maximum reliability for a specific weight. To the right of the Pareto frontier are all possible design configurations while the left side represents the infeasible area. The optimal configuration and three sub-optimal configurations are all situated in the Pareto frontier. It proves that the method of the orthogonal experiment is justified to be applied in the optimization design of the airship’s power system.
Fig.4 Pareto frontier of the power system
5. Sensitivity analyses
Some sensitivity analyses are performed on the weight and reliability of the airship’s power system to identify the leverage of various variables on the performance of airship’s power system. The results of these sensitivity analyses are discussed as follows.
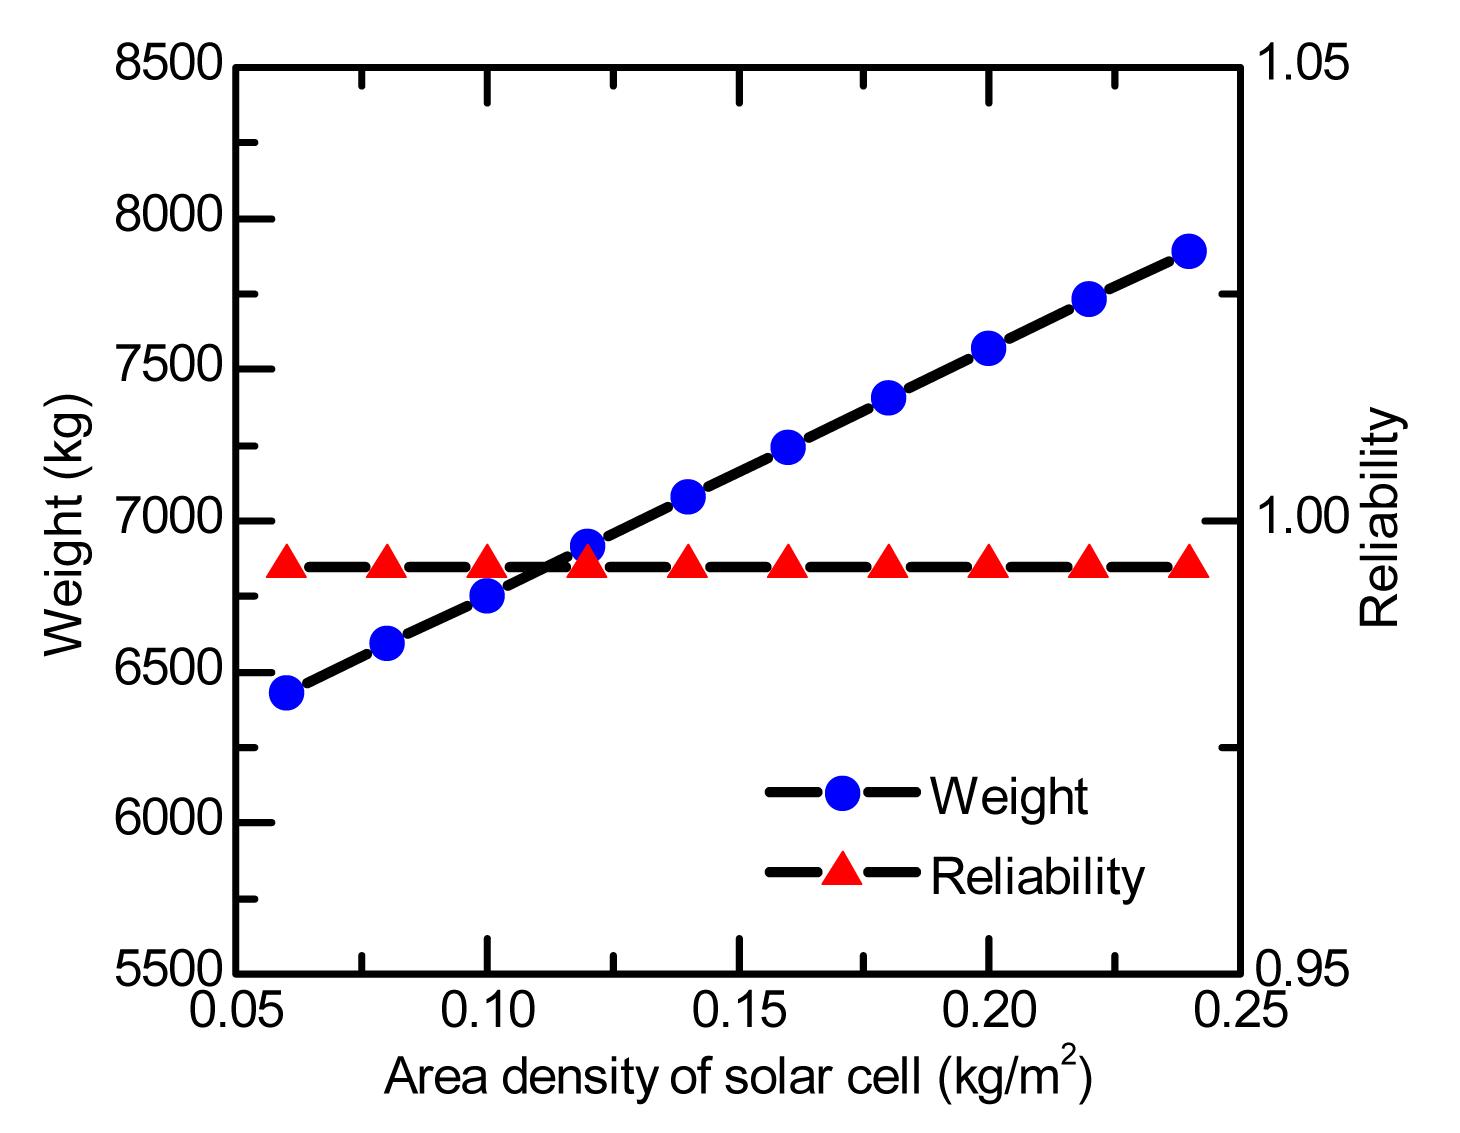
Fig. 5 shows that the weight of the airship’s power system increases linearly in proportion to the area density of the solar cell, while the reliability remains constant at 0.99470. As the area density of the solar cell increases from 0.06 to 0.24 kg/m2, the weight of the power system increases from 6428.93 to 7893.14 kg. The reason for the invariable reliability is that the variation of the area density of the solar cell does not influence the total strings or redundant strings of the solar array.
Fig.5 Effect of area density of solar cell on weight of the airship’s power system
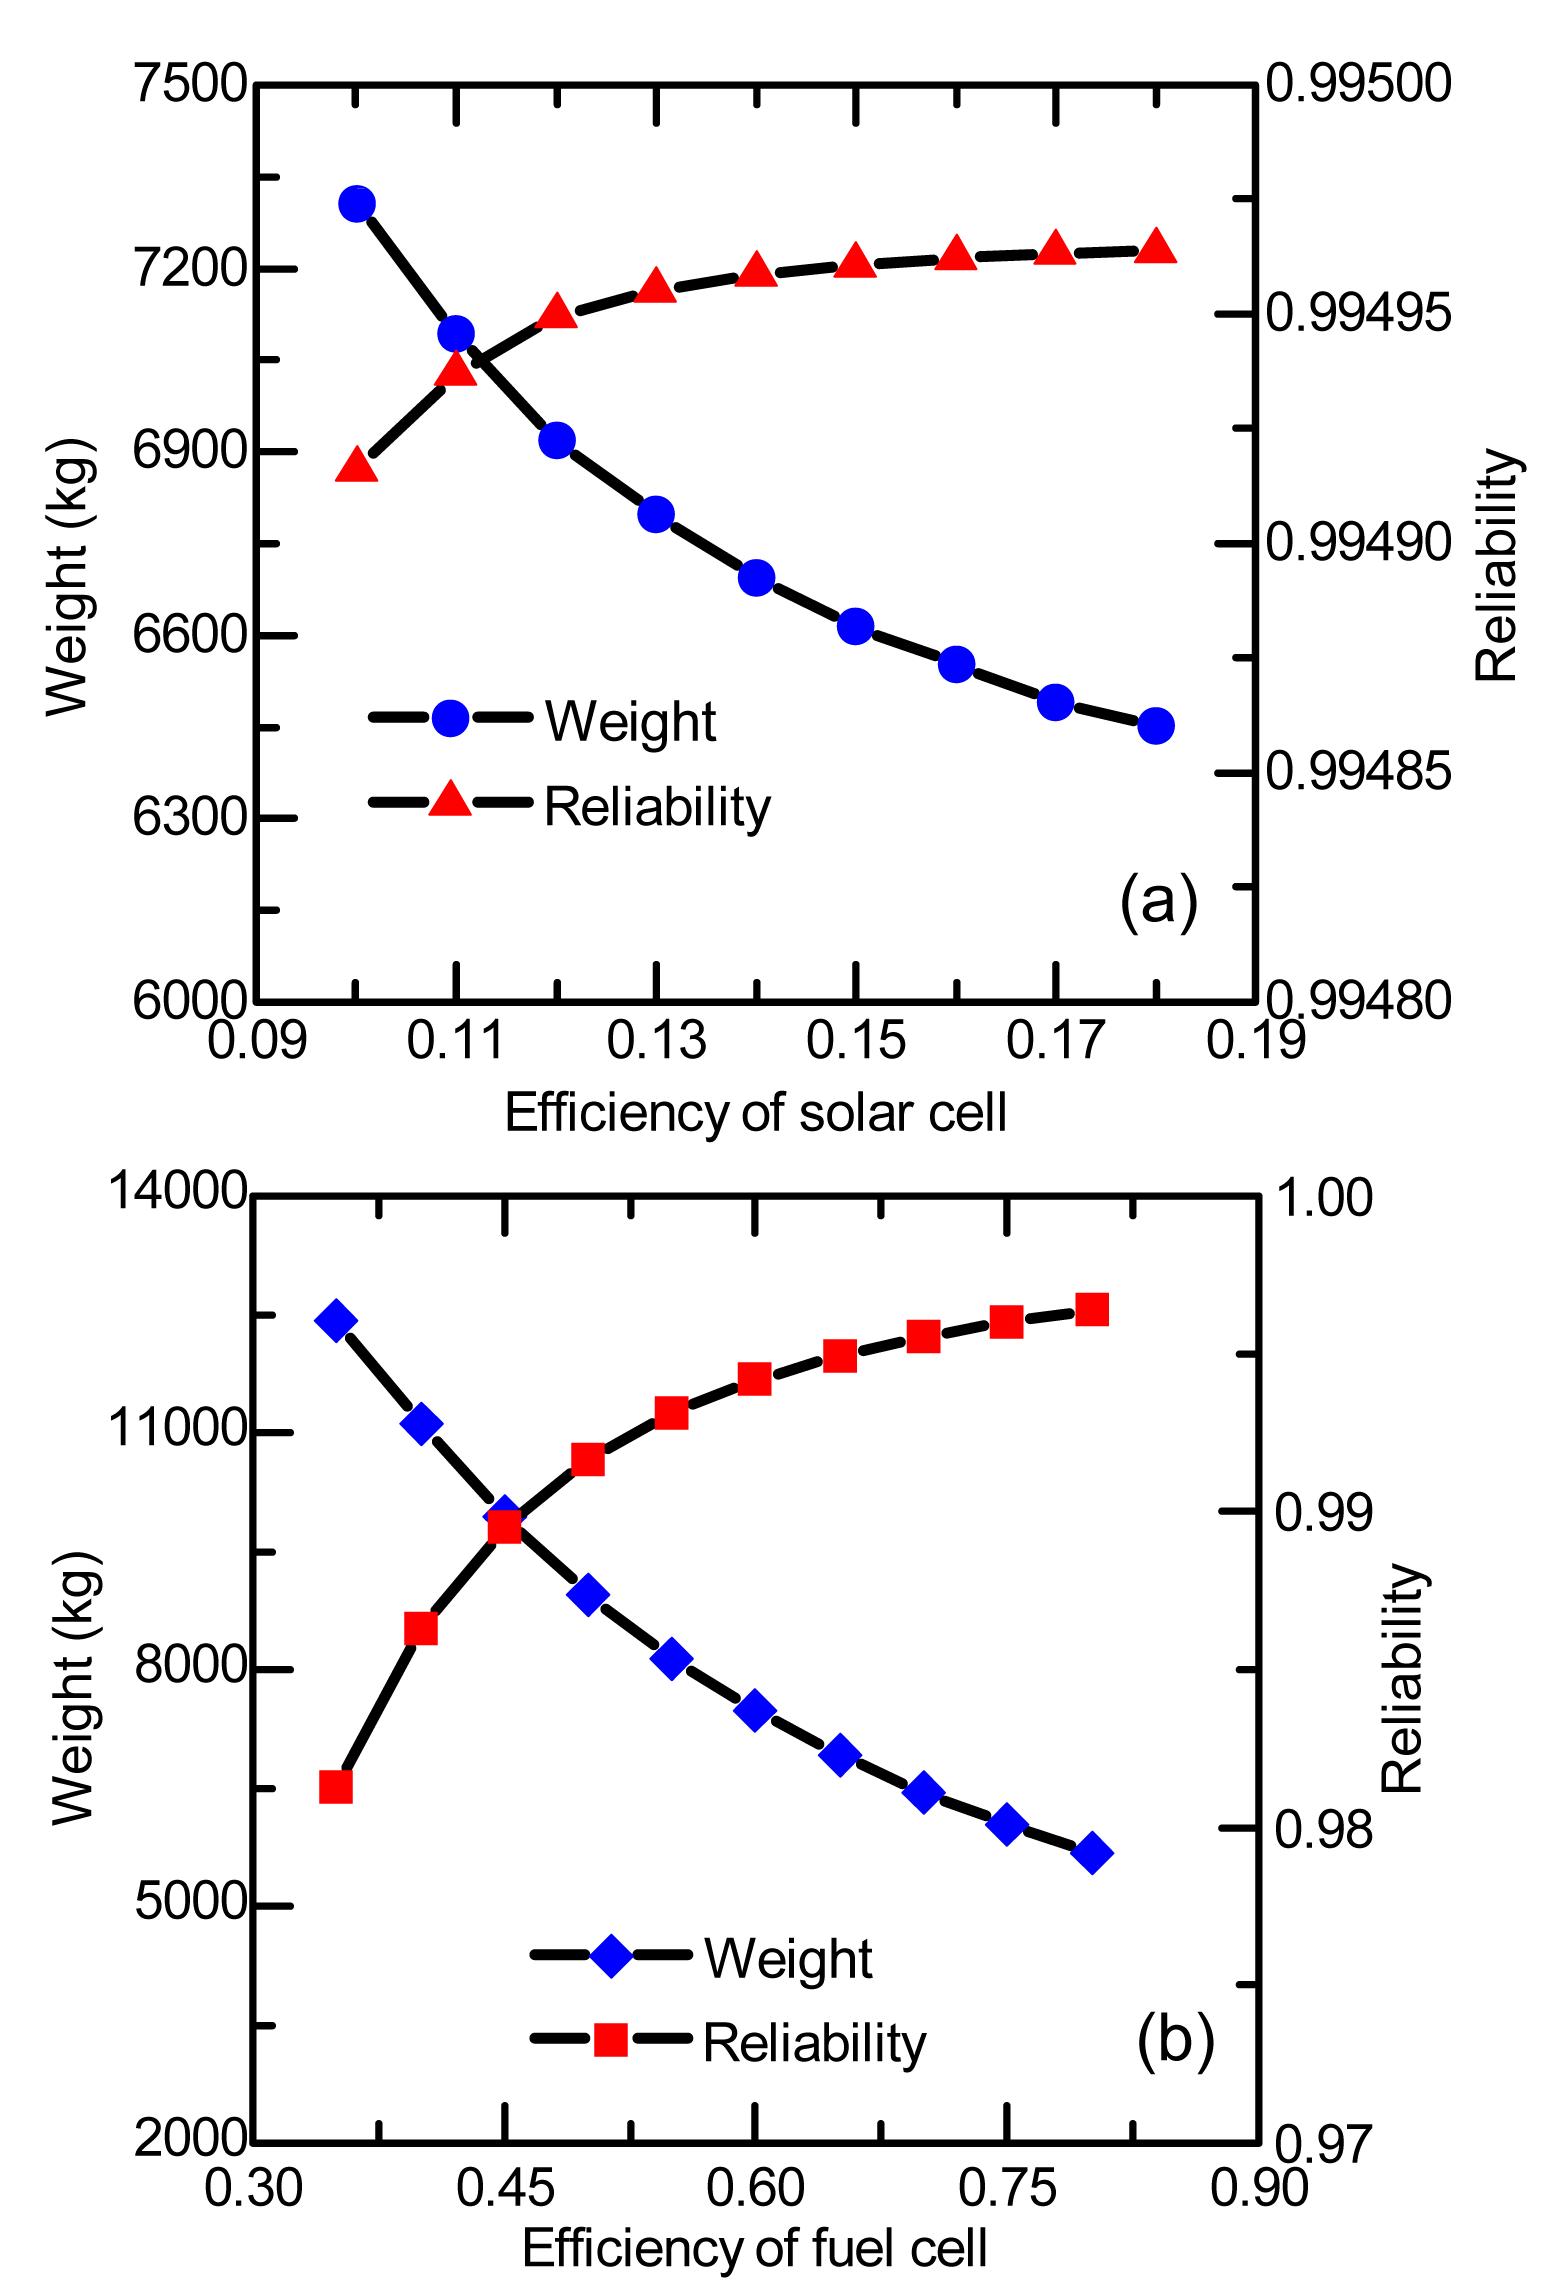
Fig. 6 shows the effect of the efficiency of solar cell and fuel cell on the weight of the airship’s power system. It is found that the weight of the airship’s power system decreases exponentially in inverse to the efficiency of the solar cell, while the reliability increases. As the efficiency of solar cell increases, the total strings or total area of SA decreases. The weight of the power system also decreases and the reliability increases. The relationships between weight, reliability and efficiency of the fuel cell of the airship’s power system are similar to those of the solar cell. As the efficiency of the fuel cell increases from 35% to 80%, the weight of power system decreases from 12 431.69 to 5684.95 kg, and the reliability increases from 0.98125 to 0.99637.
Fig.6 Effects of the efficiencies of solar cell (a) and fuel cell (b) on the weight of the airship’s power system
Fig. 7 shows that the weight of the airship’s power system decreases approximately linearly in proportion to the specific weight of RFC while the reliability remains constant at 0.99495. As the specific weight of the fuel cell increases from 350 to 650 W/kg, the weight of the power system decreases from 9338.27 to 5613.24 kg.
Fig.7 Effect of specific weight of RFC on the weight of the airship’s power system
6. Conclusions
The methodology of orthogonal experiment is used in the optimization design of the power system of the stratosphere airship. The mathematical models of the solar array, RFC and PMS are presented. To apply the method of orthogonal experiment, the selection of factors and levels of each factor and the choice of evaluation function are discussed.
The optimization design of the ZY-2 power system is used as a validation. Results show that the optimal configuration has an increase of 115.3% in reliability and 41.23% increase in weight. It also shows that the optimal configuration is the best solution for all combination of different configurations in the Pareto frontier. The results of optimal configuration and three sub-optimal configurations have verified the feasibility of the methodology of orthogonal experiment applied in the optimal design of the airship’s power system.
The sensitivity analyses for the weight and reliability of the airship’s power system on various variables are also performed. It shows that the weight of the airship’s power system increases linearly in proportion to the area density of the solar cell. The weight decreases inversely to the efficiency of the solar cell, the efficiency of the fuel cell and the specific weight of the RFC. The reliability of the power system remains constant when the area density of the solar cell or the specific weight of the RFC varies. The reliability increases as the efficiency of the solar cell or the efficiency of the fuel cell increases.
[1] Alam, M.A., Dongaonkar, S., Karthik, Y., 2010. Intrinsic Reliability of Amorphous Silicon Thin Film Solar Cells. , IEEE International Reliability Physics Symposium Proceedings, Garden Grove, CA, Canada, 312-317. :312-317.
[2] Bents, D.J., 2008. Lunar Regenerative Fuel Cell (RFC) Reliability Testing for Assured Mission Success. , NASA/TM-2009-215502, Glenn Research Center, Cleveland, Ohio, :
[3] Colozza, A., 2003. Initial Feasibility Assessment of a High Altitude Long Endurance Airship. , NASA/CR-2003-212724, Analex Corporation, Brook Park, Ohio, :
[4] Frulla, G., 2002. Preliminary reliability design of a solar-powered high-altitude very long endurance unmanned air vehicle. Proceedings of the Institution of Mechanical Engineers, Part G: Journal of Aerospace Engineering, 216(4):189-196.
[5] Gautam, N.K., Kaushika, N.D., 2002. Reliability evaluation of solar photovoltaic arrays. Solar Energy, 72(2):129-141.
[6] James, R., 2010. Thin-Film Photovoltaics: What Are the Reliability Issues and Where Do They Occur?. , IEEE International Reliability Physics Symposium Proceedings, Garden Grove, CA, Canada, 494-498. :494-498.
[7] Kimble, M., Hoberecht, M., 2003. Performance Evaluation of ElectroChem’s PEM Fuel Cell Power Plant for NASA’s 2nd Generation Reusable Launch Vehicle. , 1st International Energy Conversion Engineering Conference (IECEC), Portsmouth, Virginia, :
[8] Lee, M., Smith, S., Androulakakis, S., 2009. The High Altitude Lighter than Air Airship Efforts at the US Army Space and Missile Defense Command/Army Forces Strategic Command. , 18th AIAA Lighter-than-Air Systems Technology Conference, Seattle, Washington, :
[9] Mangoni, V., Pagano, M., Velotto, G., 2007. Fuel Cell Reliability Model Based on Uncertain Data. , International Conference on Clean Electrical Power, Capri, Italy, 730-735. :730-735.
[10] Martin, R.E., Garow, J., Michaels, K.B., 1984. Regenerative Fuel Cell Energy Storage System for a Low Earth Orbit Space Station. , NASA-CR-174802, NASA-Lewis Research Center, Cleveland, Ohio, :
[11] Montgomery, D.C., 2007. Design and Analysis of Experiments. Wiley,New York, USA :14-19.
[12] Naito, H., Eguchi, K., Hoshino, T., 1999. Design and Analysis of Solar Power System for SPF Airship Operations. , International Balloon Technology Conference, Norfolk, VA, :
[13] Okaya, S., Shinizaki, N., Sasa, S., 2011. R&D Status of RFC Technology for SPF Airship in Japan. , 9th Annual International Energy Conversion Engineering Conference, San Diego, California, :
[14] Ren, L.Q., 2009. Experimental Design and Optimization. (in Chinese), Science Press,Beijing, China :7-48.
[15] Smith, S., Fortneberry, M., Lee, M., 2011. HiSentinel80: Flight of a High Altitude Airship. , 11th AIAA Aviation Technology, Integration, and Operations (ATIO) Conference, Virginia Beach, VA, :
[16] Tanrioven, M., Alam, M.S., 2006. Reliability modeling and analysis of stand-alone PEM fuel cell power plants. Renewable Energy, 31(7):915-933.
[17] Wang, Q., Chen, J., Fu, G., Duan, D., 2009. An approach for shape optimization of stratosphere airships based on multidisciplinary design optimization. Journal of Zhejiang University: SCIENCE A, 10(11):1609-1616.
[18] Wang, Q., Chen, J., Fu, G., Duan, D., Zhao, H., 2009. A methodology for optimisation design and analysis of stratosphere airship. The Aeronautical Journal, 113(1146):533-540.
Open peer comments: Debate/Discuss/Question/Opinion


Open peer comments: Debate/Discuss/Question/Opinion
<1>