Yu-jun Cui, Trong Vinh Duong, Anh Minh Tang, Jean-Claude Dupla, Nicolas Calon, Alain Robinet. Investigation of the hydro-mechanical behaviour of fouled ballast[J]. Journal of Zhejiang University Science A, 2013, 14(4): 244-255.
@article{title="Investigation of the hydro-mechanical behaviour of fouled ballast", author="Yu-jun Cui, Trong Vinh Duong, Anh Minh Tang, Jean-Claude Dupla, Nicolas Calon, Alain Robinet", journal="Journal of Zhejiang University Science A", volume="14", number="4", pages="244-255", year="2013", publisher="Zhejiang University Press & Springer", doi="10.1631/jzus.A1200337" }
%0 Journal Article %T Investigation of the hydro-mechanical behaviour of fouled ballast %A Yu-jun Cui %A Trong Vinh Duong %A Anh Minh Tang %A Jean-Claude Dupla %A Nicolas Calon %A Alain Robinet %J Journal of Zhejiang University SCIENCE A %V 14 %N 4 %P 244-255 %@ 1673-565X %D 2013 %I Zhejiang University Press & Springer %DOI 10.1631/jzus.A1200337
TY - JOUR T1 - Investigation of the hydro-mechanical behaviour of fouled ballast A1 - Yu-jun Cui A1 - Trong Vinh Duong A1 - Anh Minh Tang A1 - Jean-Claude Dupla A1 - Nicolas Calon A1 - Alain Robinet J0 - Journal of Zhejiang University Science A VL - 14 IS - 4 SP - 244 EP - 255 %@ 1673-565X Y1 - 2013 PB - Zhejiang University Press & Springer ER - DOI - 10.1631/jzus.A1200337
Abstract: In this study, a fouled ballast taken from the site of Sénissiat, France, was investigated. For the hydraulic behaviour, a large-scale cell was developed allowing drainage and evaporation tests to be carried out with monitoring of both suction and volumetric water content at various positions of the sample. It was observed that the hydraulic conductivity of fouled ballast is decreasing with suction increase, as for common unsaturated soils. The effect of fines content was found to be negligible. For the mechanical behaviour, both monotonic and cyclic triaxial tests were carried out using a large-scale triaxial cell. Various water contents were considered. The results were interpreted in terms of shear strength and permanent axial strain. It appeared that the water content is an important factor to be accounted for since any increase of water content or degree of saturation significantly decreases the shear strength and increases the permanent strain. constitutive modelling has been attempted based on the experimental results. The model in its current state is capable of describing the effects of stress level, cycle number and water content.
Darkslateblue:Affiliate; Royal Blue:Author; Turquoise:Article
Article Content
1. Introduction
In France, most railway tracks are ballasted and the whole network is composed of new lines for high speed trains and ancient lines for other categories. In the case of new lines, a sub-layer of gravel is placed between ballast and sub-grained. This sub-layer has the main functions of (1) ensuring the relatively uniform force transmission to the sub-structure, (2) ensuring the grain size transition from ballast to sub-structure, (3) protecting sub-structure from excessive water infiltration and (4) protecting the sub-structure against frost. This design has been proven to be successful when dealing with sub-grades of “normal soils”. But when special soils as expansive soils and collapsible soils are involved, additional measures should be taken in order to ensure the good functioning of tracks. Indeed, in the case of northern line (Paris-Lille), a sub-grade of loess is involved. Under the effects of rainfall and dynamic loading, track instability problems were identified, leading to an extensive study to identify the main instability mechanisms (collapse upon wetting, cementation degradation upon cyclic loading and liquefaction in the saturated sate) and to find out an appropriate reinforcement technique such as grouting (Cui et al., 2007; Yang et al., 2008; Karam et al., 2009; Munoz-Castelblanco et al., 2011; 2012a; 2012b). In the case of Mediterranean Line (Paris-Marseille), a sub-grade of marl was encountered and its swelling due to the coupled effect of water infiltration and excavation-related unloading was revealed to be one of the main mechanisms for the significant track heave identified (Tang et al., 2009).
As opposed to the new lines, the ancient lines have their ballast directly placed on the sub-grade. Under the effect of train circulation over time, a fouled ballast layer was created mainly by interpenetration of fines particles due to cracking, weathering or crushing, the infiltration of materials from the surface, the infiltration of materials from underlying layer and weathering of the sleepers. This layer is found to be well “compacted” by train circulation over long time: the in-situ dry density can be as high as 2.4 Mg/m3 (Trinh et al., 2011). Thereby, it constitutes a good bearing layer in the sub-structure. This is why this layer is kept in the French program of ancient track renewal. Note this track renewal program is important because it almost involves the whole French network: the ancient lines represent 94% of the whole network of about 30 000 km. On the other hand, as this naturally formed layer can contain significant amount of fines, its mechanical behaviour is sensitive to the water content and fines content. When renewing the ancient tracks to fulfil the requirements in terms of increase of load and speed of train, it is important to take this sensitivity into account.
To investigate the sensitivity of the mechanical behaviour of fouled ballast to changes in water content, it is important to first identify its hydraulic behaviour because this latter governs water infiltration and, to some extent, water runoff on the interface between ballast and fouled ballast. There are various methods allowing determination of the hydraulic conductivity of unsaturated materials. In the laboratory conditions, the hydraulic conductivity of an unsaturated soil can be determined using either direct or indirect techniques, based on the Darcy’s law. Very often, the instantaneous profile method is used. This method consists of inducing transient flow in a soil sample and monitoring changes in water content and/or suction profiles (Wind, 1966; Daniel, 1982; Delage and Cui, 2001; Cui et al., 2008; Ye et al., 2009).
In most cases, fine-grained soils are studied using infiltration columns of small diameter: 150 mm by Bruckler et al. (2002); 103 mm by Chapuis et al. (2006); etc. As the dimension of the largest particles of fouled ballast can reach 60 mm, larger infiltration columns are needed. In this regard, Trani and Indraratna (2010) developed an infiltration column of 240 mm in diameter and 150 mm in height to investigate the hydraulic behaviour of saturated sub-ballast.
To study the mechanical behaviour of coarse materials as fouled ballast, large scale cyclic triaxial tests are usually carried out. Most works have been performed on ballast (Raymond and Williams, 1978; Stewart, 1986; Raymond and Bathurst, 1994; Indraratna et al., 1998; Suiker et al., 2005; Lackenby et al., 2007; Anderson and Fair, 2008) or sub-ballast (Suiker et al., 2005). The test results show that after a large number of loading cycles, the resilient modulus stabilizes but the permanent strain increases (Kalcheff and Hicks, 1973; Brown, 1974; Li and Selig, 1994; Selig and Water, 1994; Gidel et al., 2001; Malla and Joshi, 2008; Ekblad, 2008). Failure induced by plastic strain accumulation can occur under repeated load when the material is close to saturation (Selig and Water, 1994), evidencing the significant effects of water content and drainage condition on the mechanical behaviour. Further studies on unbound granular materials (UGMs) confirm this observation: increasing the water content causes reduction in resilient modulus and increase in permanent deformation (Gidel et al., 2002; Werkmeister et al., 2003; Ekblad, 2006).
When modelling the permanent deformation, usually only the stress level (Shenton, 1974; Lekarp and Dawson, 1998) or the number of cycles (Barksdale, 1972; Paute et al., 1988; Sweere, 1990; Hornych et al., 1993; Wolff and Visser, 1994) are considered. Both the effects of stress level and number of loading cycles were accounted for in the models proposed by Gidel et al. (2001) and Pérez et al. (2006).
In this paper a study on the hydro-mechanical behaviour of a fouled ballast is presented. Emphasis is put on the effects of water content and fines content. After presenting the devices used for the experimental investigation, typical results will be presented for both hydraulic and mechanical behaviours. The constitutive modelling of permanent strain will also be discussed.
2. Materials and methods
The soils studied were taken from Sénissiat (North-West of Lyon, France), along an ancient line from Bourg-en-Bresse to Bellegarde. Fig. 1 shows a photography taken during sampling. Visual examination shows a fouled ballast layer of 0.5 m thick constituted of mixed coarse-fine-grained soils, the portion of coarse-grained soil being decreasing over depth in this layer. The soils in the fouled ballast layer and the sub-grade were excavated by a mechanical shovel and transported in large bags to the laboratory for testing.
Fig.1 Geological profile of the sub-structure in Sénissiat-France
Geotechnical identification tests were performed on both the soils taken from the fouled ballast (FB0) layer and the sub-grade (SG) (Trinh et al., 2011). The Atterberg limits, blue methylene value and carbonate content were determined on the fines portion (<100 μm) (Table 1), whereas analysis of the grain size distribution covered the whole grain elements on both FB0 and SG.
Table 1
Physical properties of the materials studied
Soil type (fines with d<100 μm)
Fines portion (d<100 μm) (%)
Liquid limit (wL) (%)
Plastic limit (wp) (%)
Plasticity index (Ip) (%)
Blue methylene value (g)
Carbonates content (%)
Fouled ballast
18
45.7
30.9
14.8
3.6
16
Sub-grade
98
57.8
33.7
24.1
6.2
0
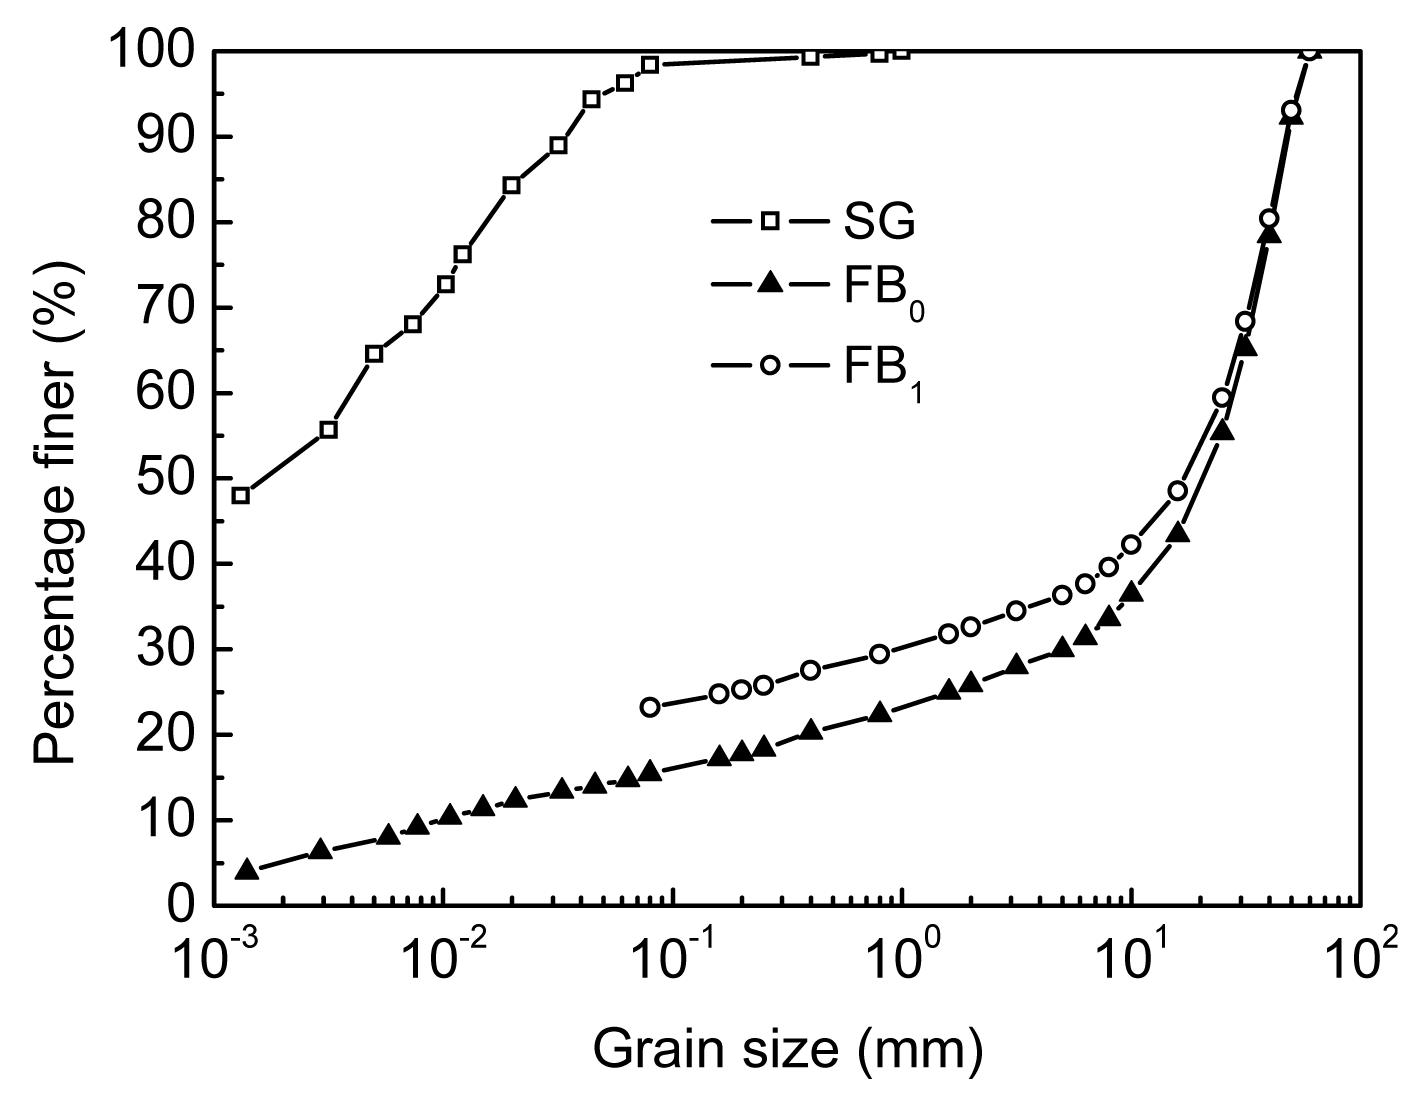
The grain size distribution curves obtained are shown in Fig. 2. It can be observed that the sub-grade contains mainly fines particles (<0.080 mm), of which 55% are clay particles (<0.002 mm). The fouled ballast corresponds to a heterogeneous material constituted of large size elements (up to 60 mm) and fines particles. The clay fraction (<0.002 mm) in the fouled ballast is 5%. According to the classification criterion based on the fouling index FI (Selig and Water, 1994) or relative fouling ratio Rb-f (Indraratna et al., 2011), the FB0 studied is a highly fouled ballast. This is normal considering the formation of this material mainly by inter-penetration of ballast and sub-grade. In this figure, FB1 is the fouled ballast with addition of 10% (by dry mass) of fine particles of sub-grade.
Fig.2 Grain size distribution of fouled ballast and sub-grade
Fig. 3 shows the infiltration column developed to study the unsaturated hydraulic conductivity of the fouled ballast. It has an internal diameter of 300 mm, a wall thickness of 10 mm and a height of 600 mm. The column is equipped with five volumetric water content sensors (TDR1 to TDR5) and five tensiometers for matric suction measurement (T1 to T5) disposed at an equal distance along the column height (h=100, 200, 300, 400 and 500 mm). A hole in the center of top cover allows water drainage or air expulsion. Two valves are installed at the bottom, allowing water injection after expulsion of air in the ducts. Two porous stones are placed for the two valves to avoid any clogging of ducts by soil particles. Geotextiles are placed on the top and at the bottom of the soil specimen. More details about the cell can be found in (Duong et al., 2013).
Fig.3 Schematic view of the large-scale infiltration column developed (unit: mm)
To study the hydraulic conductivity of both saturated and unsaturated fouled ballast, the fouled ballast was firstly dried in an oven at 50 °C for 24 h. Water was then added using a large mixer to reach the target water content. After mixing, the wet material was stored in hermetic containers for at least 24 h for moisture homogenization.
The soil specimen was then prepared by compaction in six layers of 0.10 m each in the infiltration column using a vibrating hammer. The density of each layer was controlled by fixing the soil weight and the layer height. Prior to compaction of the subsequent layer, a TDR probe and a metal rod of 25 mm diameter were placed on the compacted layer. Once the soil specimen was prepared, the metal rods were removed to install the tensiometers. This protocol was adopted because the tensiometers cannot stand the compaction force without being damaged. Considering the influence zone of TDR probes, the distance between the tips of tensiometers and TDR probes was set greater than 40 mm. In order to ensure the good contact between tensiometers and soil, a paste made of sub-grade was placed in the holes before introducing the tensiometers.
In order to study the influence of fines content on the hydraulic conductivity of fouled ballast, in addition to the infiltration test on natural fouled ballast, a second infiltration test was conducted on fouled ballast with addition of 10% (by dry mass) fines particles of sub-grade (see its grain size distribution curve in Fig. 2).
Both the tests were conducted on soil specimens at a dry density of 2.01 Mg/m3 following the same procedure in three stages: saturation, drainage and evaporation. The specimen was saturated by injecting water from the bottom. Note that the value of 2.01 Mg/m3 is the maximum density that can be obtained in the laboratory using a vibrating hammer. Water was observed at the outlet in less than one hour and the soil specimen was considered saturated after the water flow was kept for one day. Saturated hydraulic conductivity was measured by applying a constant hydraulic head of 0.45 m, using a Mariotte bottle. After the saturation stage, water was allowed to flow out through the two bottom valves. After about two days, when there was no more water outgoing, it was considered that the drainage stage was completed. The top cover of the column was then removed to allow evaporation. The two bottom valves were closed during this stage. The evaporation ended after about 160 h when the value given by the tensiometer T5 (h=500 mm) was about −60 kPa.
To study the mechanical behaviour of fouled ballast, a large-scale triaxial device developed by Dupla et al. (2007) was used. This large-scale triaxial apparatus allows testing soil specimens of 300 mm in diameter and 600 mm in height. Axial monotonic and cyclic loads can be applied by controlling either the displacement or the force using a 500 kN hydraulic actuator. The confining pressure is applied either through a simple mechanical regulating valve and air-water interface or using a hydraulic pressure control device. The whole device is controlled by a digital system. For cyclic loadings, the system can apply large number of cycles (up to several millions) at a frequency of several tens of Hz (depending on the displacement amplitude). A displacement transducer (LVDT) integrated to the hydraulic actuator allows monitoring the piston displacement and thereby determining the vertical strain of the specimen. The volumetric strain of specimen is obtained by considering the cell outgoing or incoming water volume, using a high-precision scale or based on the piston displacement of the confining hydraulic actuator.
In this triaxial cell, the soil sample was prepared by compaction in the same fashion as for the infiltration column. The soil specimen was compacted in 6 layers of 100 mm in a metallic mould using a vibrating hammer. Also, the final dry density of the soil specimens was 2.01 Mg/m3. After compaction, the sample in its mould was first put on the lower base of the triaxial cell. Then, the mould was removed to complete the sample installation procedure.
Monotonic drained triaxial tests were first performed in order to determine the shear strength parameters at various water contents (4% and 12%). The results obtained were then analysed to define the loading stages in the cyclic triaxial tests—the amplitude of deviator stress to be applied in cyclic tests must be lower than the shear strength (Trinh et al. (2012) for more details). Three water contents (4%, 6% and 12%) were considered and the multi-stage loading procedure used by Gidel et al. (2001) was applied in the cyclic tests. After installation of the triaxial cell, a confining pressure σ3=30 kPa was applied. This value is close to the horizontal stress estimated in the field conditions. The maximum shear stress (qmax) was increased in stages, keeping a constant ratio Δq/Δp=3 (where q is the deviator stress and p is the mean stress). The frequency used, 5 Hz, corresponds to the frequency measured in situ for a train speed of 100 km/h (typical for the trains circulating on the ancient railways in France (SNCF, 2009)).
3. Hydraulic behavior
Unlike the common infiltration column with only suction profile monitoring (Daniel, 1982; Cui et al., 2008; Ye et al., 2009) or only water content monitoring, the column developed in this study is equipped with both tensiometers and TDR sensors, allowing simultaneous measurements of suction and volumetric water content at different levels. As an example, Fig. 4 shows changes in volumetric water content and pore water pressure for FB1 during drainage and evaporation. At saturation, the volumetric water content was equal to 22%–25%; it decreased to 15%–17% after the drainage stage for all levels except the level at 200 mm. At this moment, the pore water pressure was in the range from 0 to −4 kPa, corresponding to the capillary pressure generated by drainage. When the drainage stage ended, the cover of the column was removed to start the water evaporation from the soil surface. A fan was used to accelerate the evaporation process.
Fig.4 Volumetric water content (a) and pore water pressure (b) changes during the drainage and evaporation stages for FB1
The pore water pressure measured by the tensiometer close to the soil surface (h=500 mm) decreased quickly, whereas just small changes were recorded for other levels. This is consistent with the measurement of volumetric water content: the value at h=500 mm decreased significantly during the evaporation stage whereas the values at other levels showed slight changes.
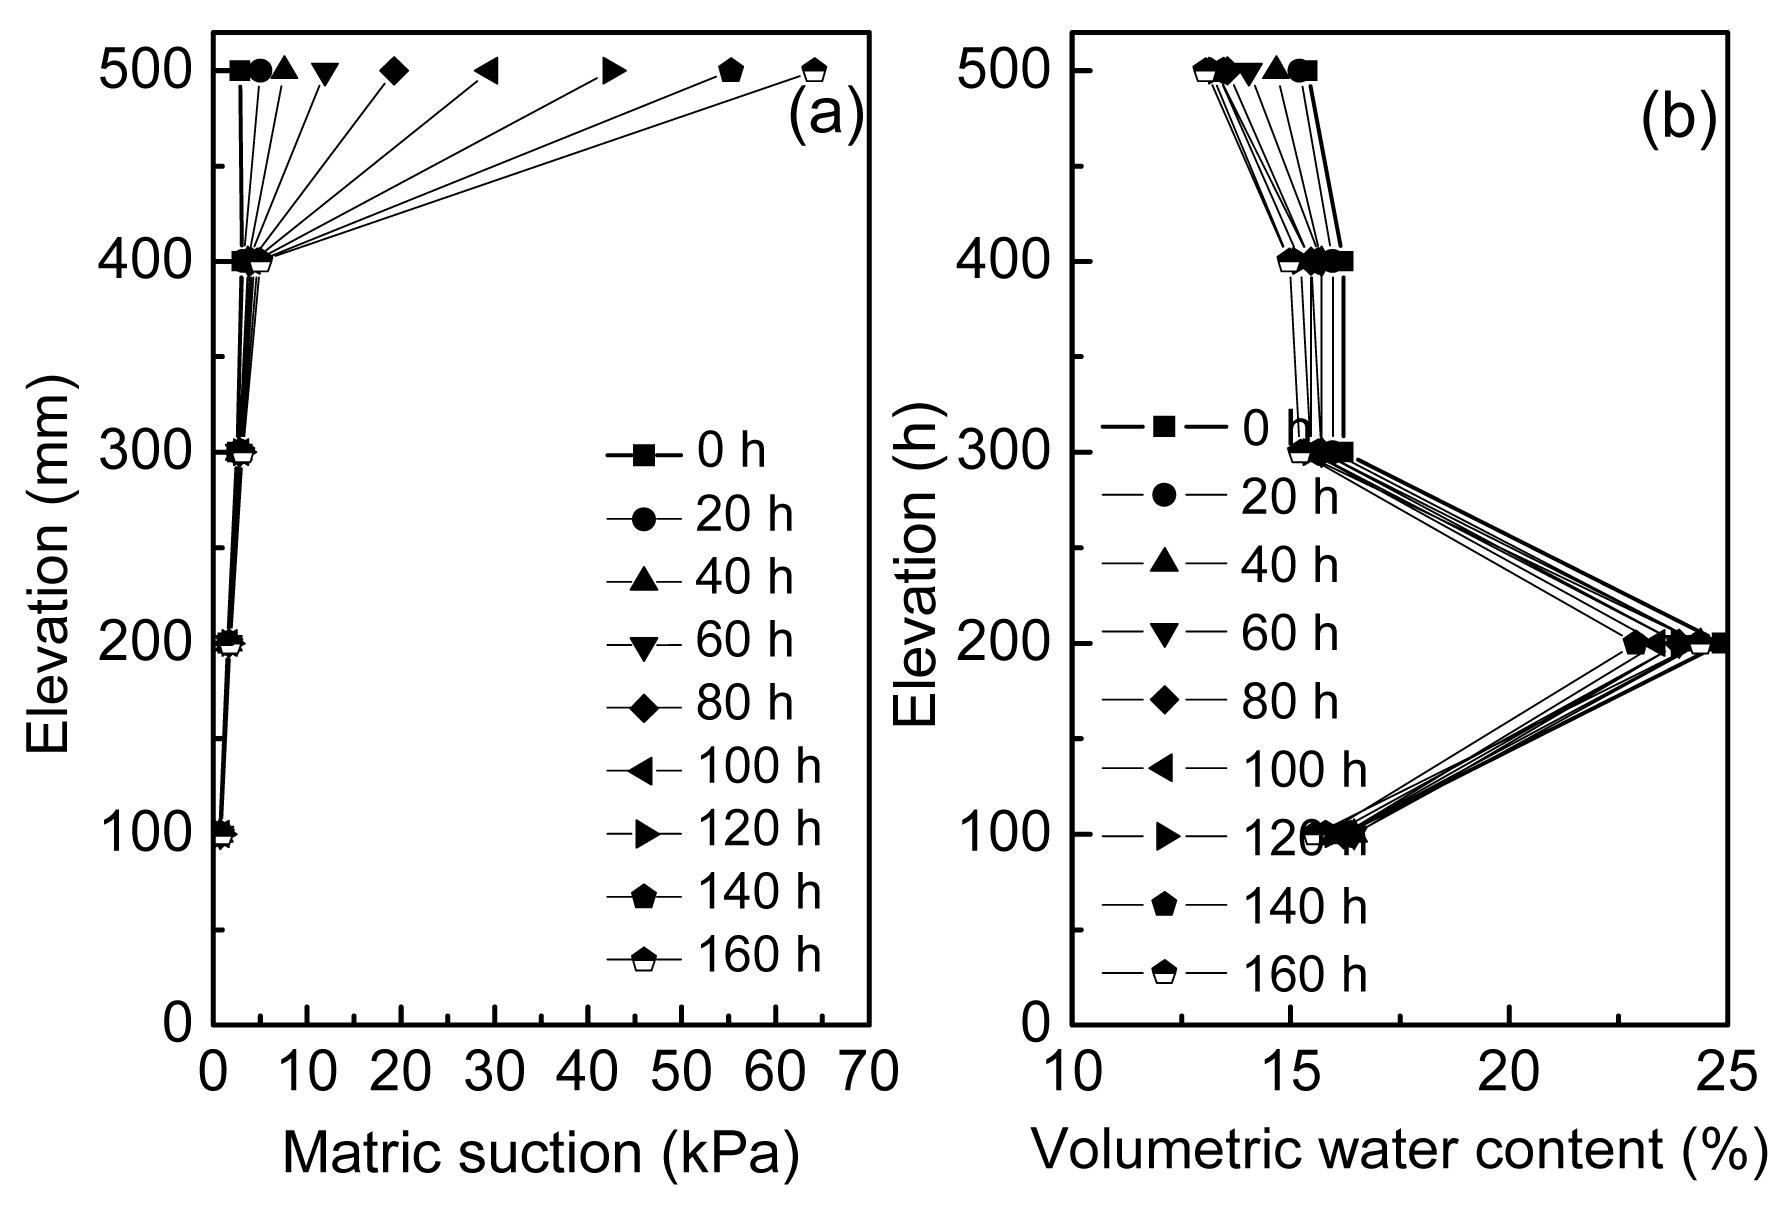
Fig. 4 allowed the isochrones or profiles of suction and volumetric water content to be determined. Fig. 5 shows such isochrones for the evaporation stage. Based on the water content and suction profiles, the instantaneous profile method can be applied to determine the hydraulic conductivity as a function of suction (Daniel, 1982; Cui et al., 2008; Ye et al., 2009), as follows:
Determining the tangents to the profiles of suction at each level x. They correspond to the hydraulic gradient i at position x:,
where H is the hydraulic head determined from the pore water pressure measurements, and x is the distance from the water source.
Determining the water flux through a position Xi during a time interval Δt based on the profiles of volumetric water (Eq. (2)):,
where Q is the water flux, A is the section of soil specimen, θ is the volumetric water content and L is the sample height.
By applying the generalized Darcy’s law, the hydraulic conductivity can be then determined using Eq. (3):,
where kw is the hydraulic conductivity, it and it+Δt are hydraulic gradients at instant t and t+Δt, respectively.
Fig.5 Isochrones of suction (a) and volumetric water content (b) during the evaporation stage for FB1
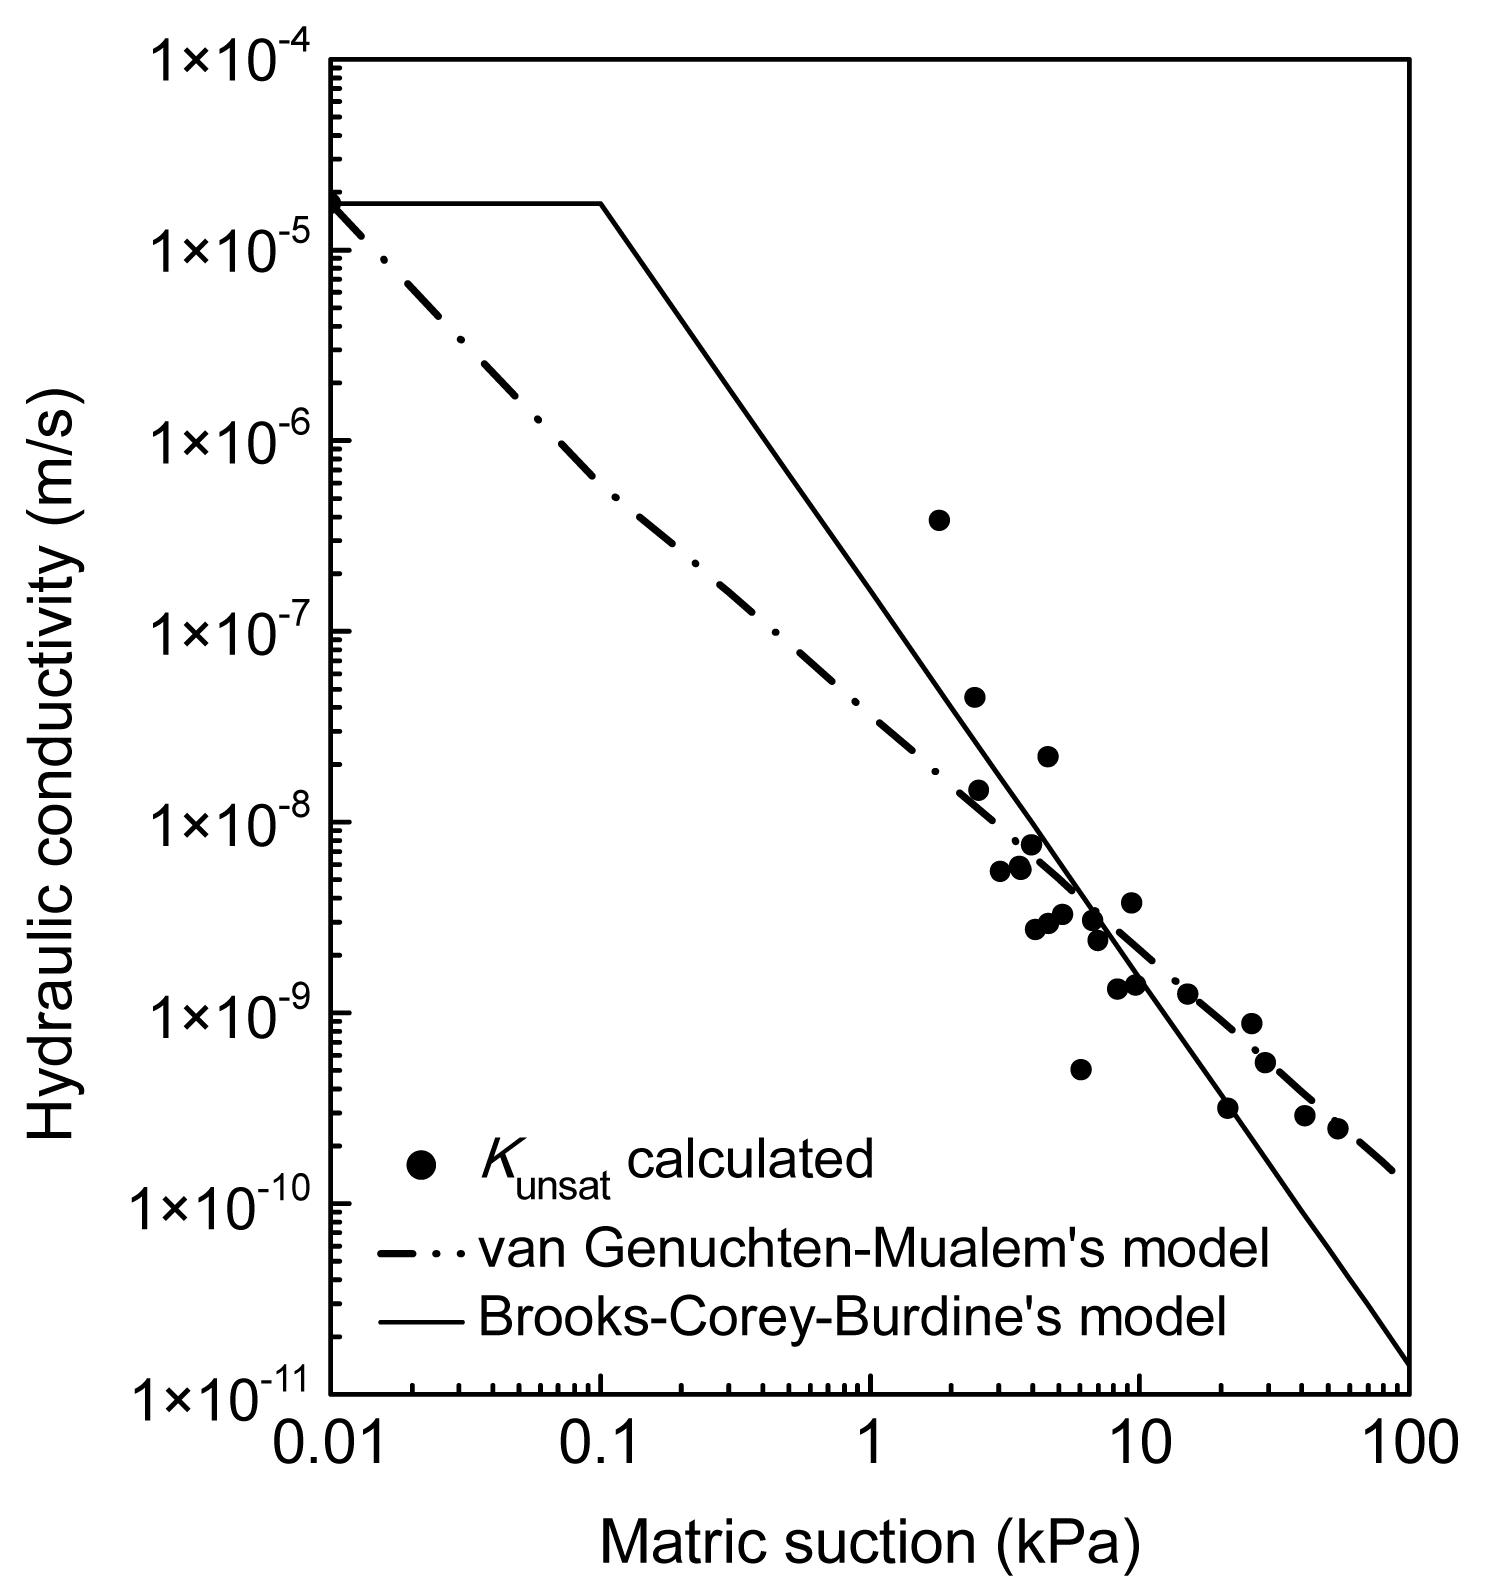
Fig. 6 shows the hydraulic conductivity of FB0 determined based on this simultaneous profile method. As most common unsaturated soils, the hydraulic conductivity of fouled ballast is also decreasing with suction increase. In this figure, the values calculated from the van Genuchten’s model (van Genuchten, 1980) based on Mualem’s equation and Brooks-Corey’s model (Brooks and Corey, 1964) based on Burdine’s approach are also shown. The parameters used for these two models are shown in Table 2. A reasonably good agreement between the determined and calculated values is obtained for both models in the range of measurement. However, in the range of low matric suctions, a significant difference can be identified between the two models. As there was measurement in this zone, it is not possible to assess the relevance of the models in this suction range.
Fig.6 Comparison between model and measurement for the hydraulic conductivity of fouled ballast FB0
Table 2
Model formula and parameters for hydraulic conductivity prediction
θ: volumetric water content; θr: residual volumetric water content; θs: volumetric water content at saturated state; k: hydraulic conductivity; ks: hydraulic conductivity at saturated state; ψ: suction; ψa: air entry value; α,n,m, and λ are constants
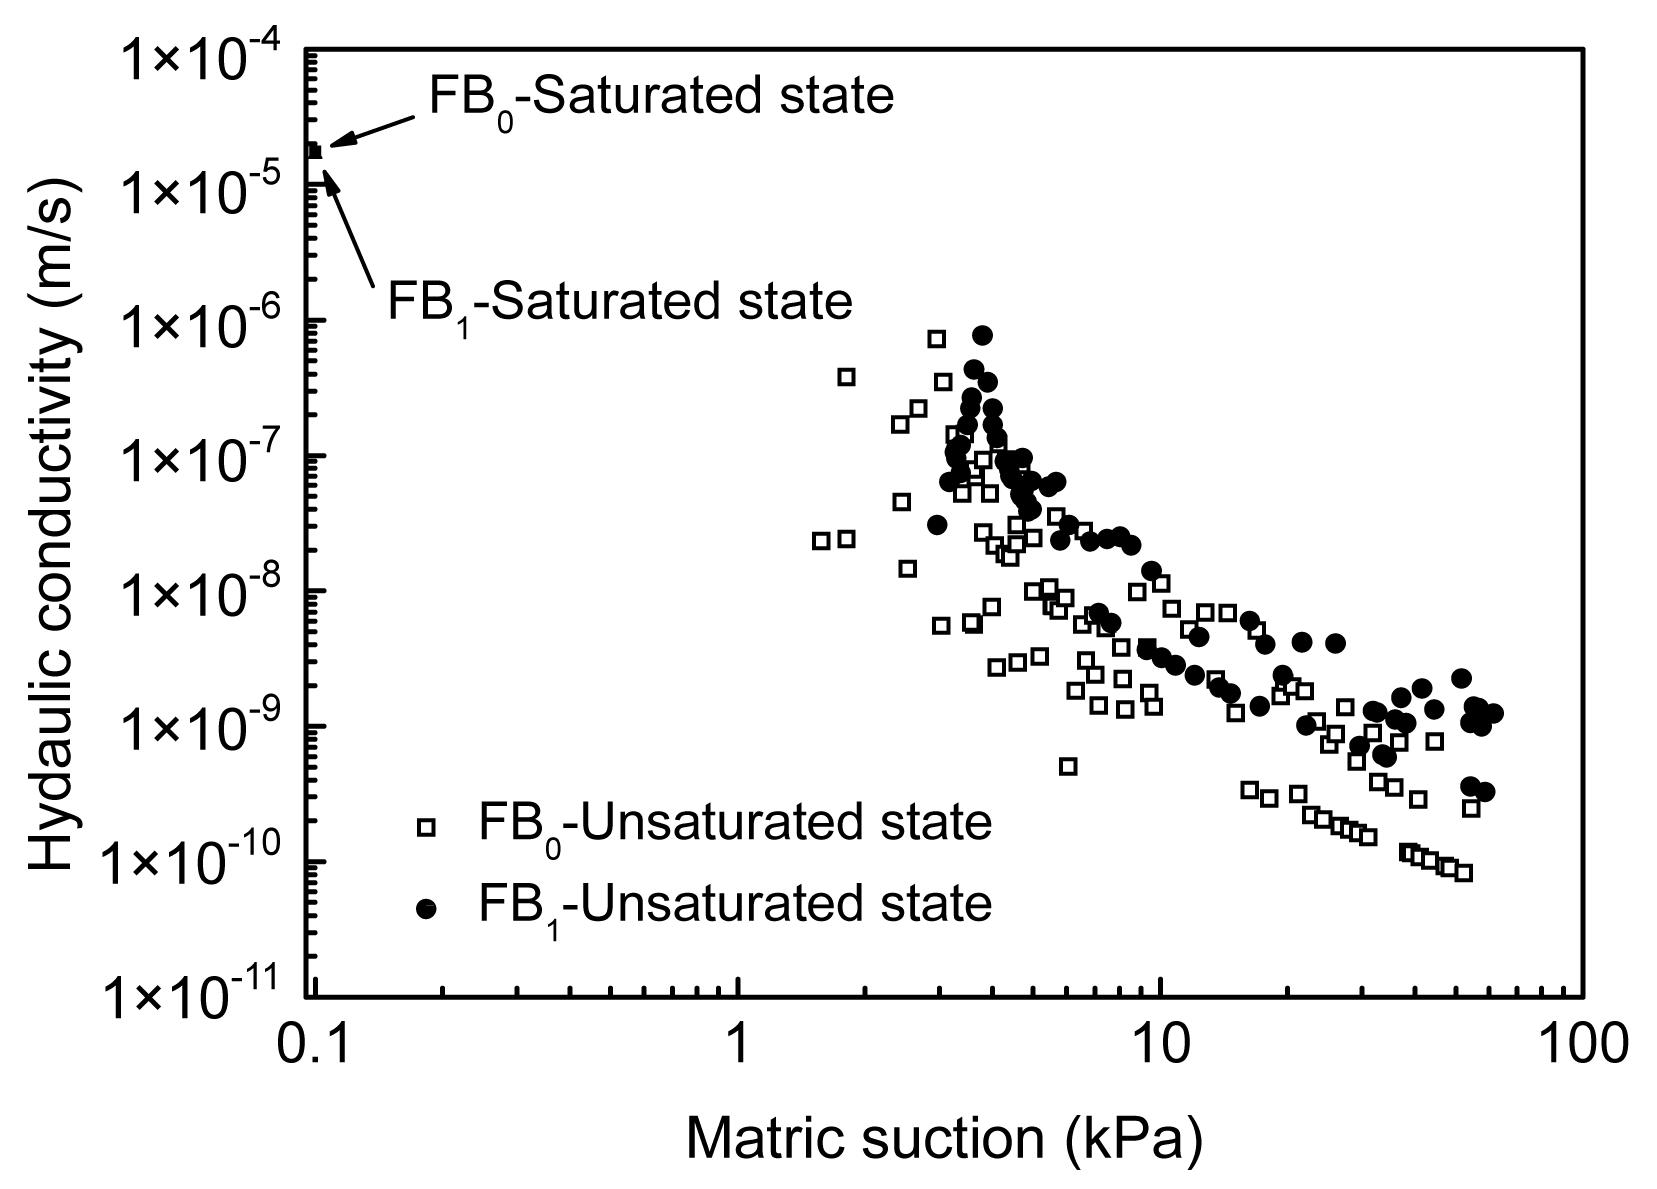
Fig. 7 compares the hydraulic conductivity of FB0 (natural fouled ballast) with that of FB1 (with addition of 10% fines) in order to evaluate the effect of fines content. It can be seen that the two results are quiet close, especially in saturated conditions: the value in saturated state of FB0 is 1.75×10⁻⁵ m/s while this value for FB1 is 1.67×10⁻⁵ m/s. In unsaturated state, it seems the FB1 has a higher hydraulic conductivity than FB0. But considering the significant scatter of data for each material (and especially for FB0), this difference does not make sense and it is more plausible to consider that the addition of fines did not modify the hydraulic conductivity.
Fig.7 Comparison between the hydraulic conductivity of FB0 and that of FB1
4. Mechanical behavior
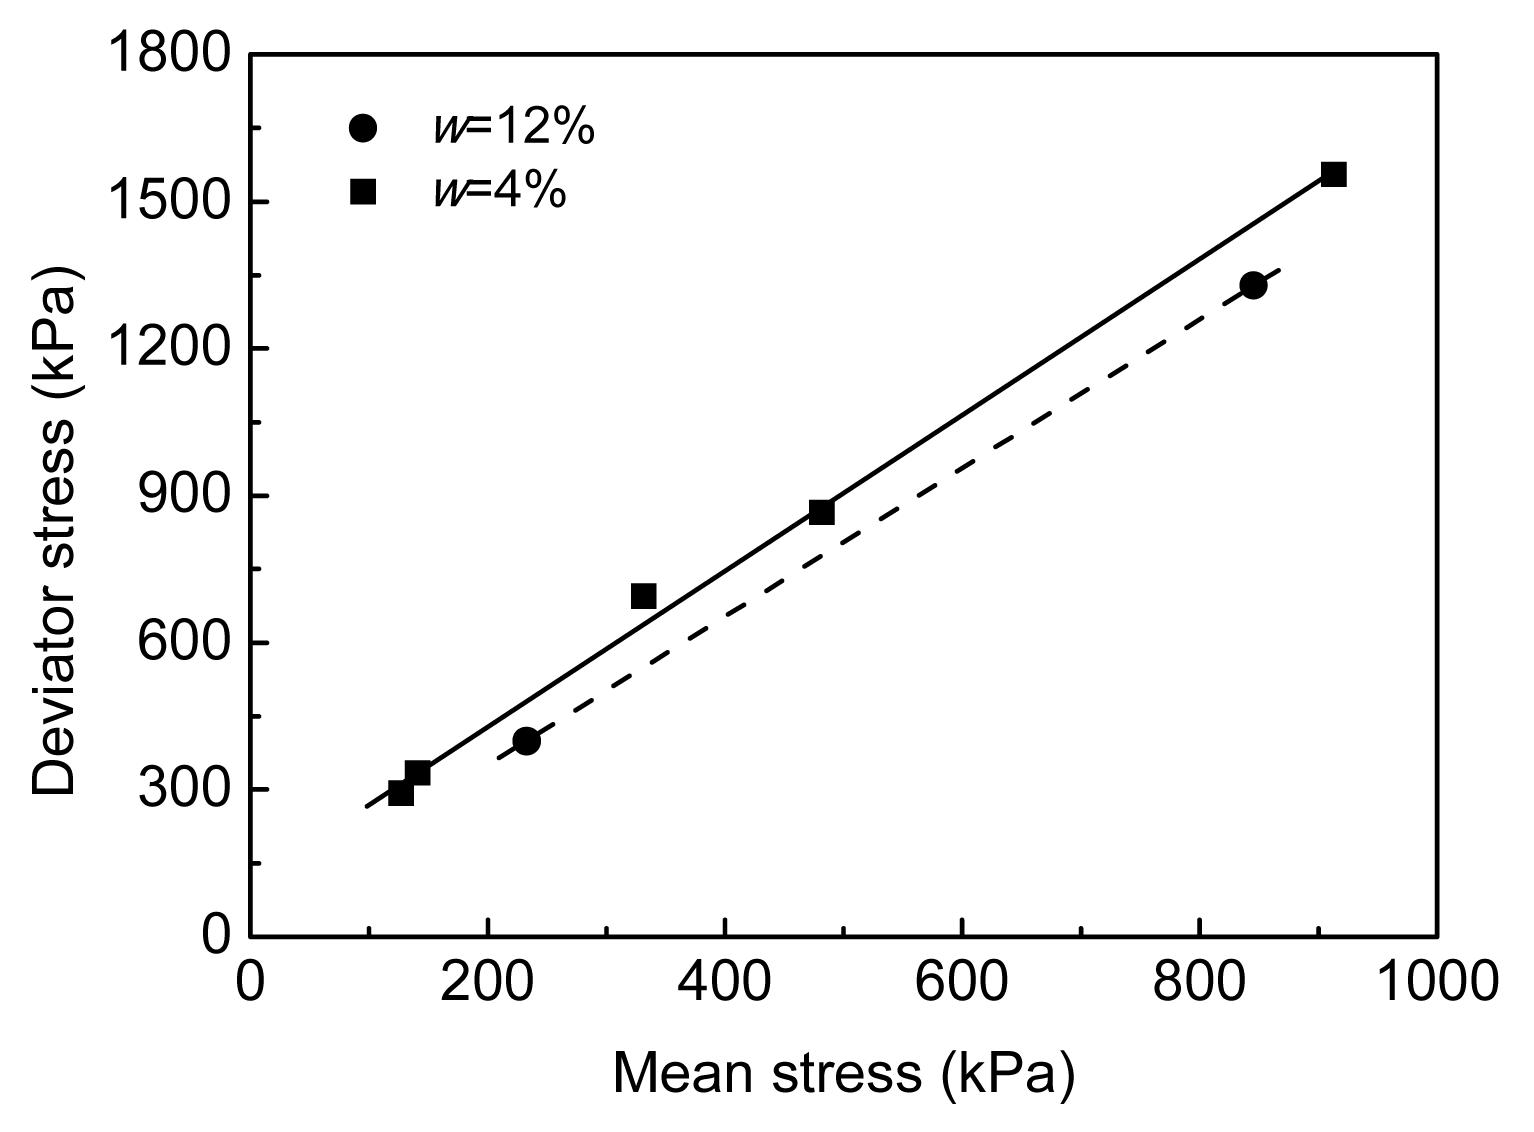
A set of monotonic triaxial tests were conducted and the peak values of deviator stress and the corresponding mean stress were used to determine the shear strength envelopes. Fig. 8 shows the envelopes at water contents of 4% and 12% (saturated) in the p-q plane. It appears that increasing water content decreases shear strength and this shear strength decrease is mainly related to the apparent cohesion decrease—the two envelopes are almost parallel. This is confirmed by the values of shear strength parameters determined from this figure: friction angle &phgr;=39° for w=4% and 37° for the saturated state; apparent cohesion c=60 kPa for w=4% and 22 kPa for the saturated state.
Fig.8 Failure envelopes at two different water contents, 4% and 12% (saturated state)
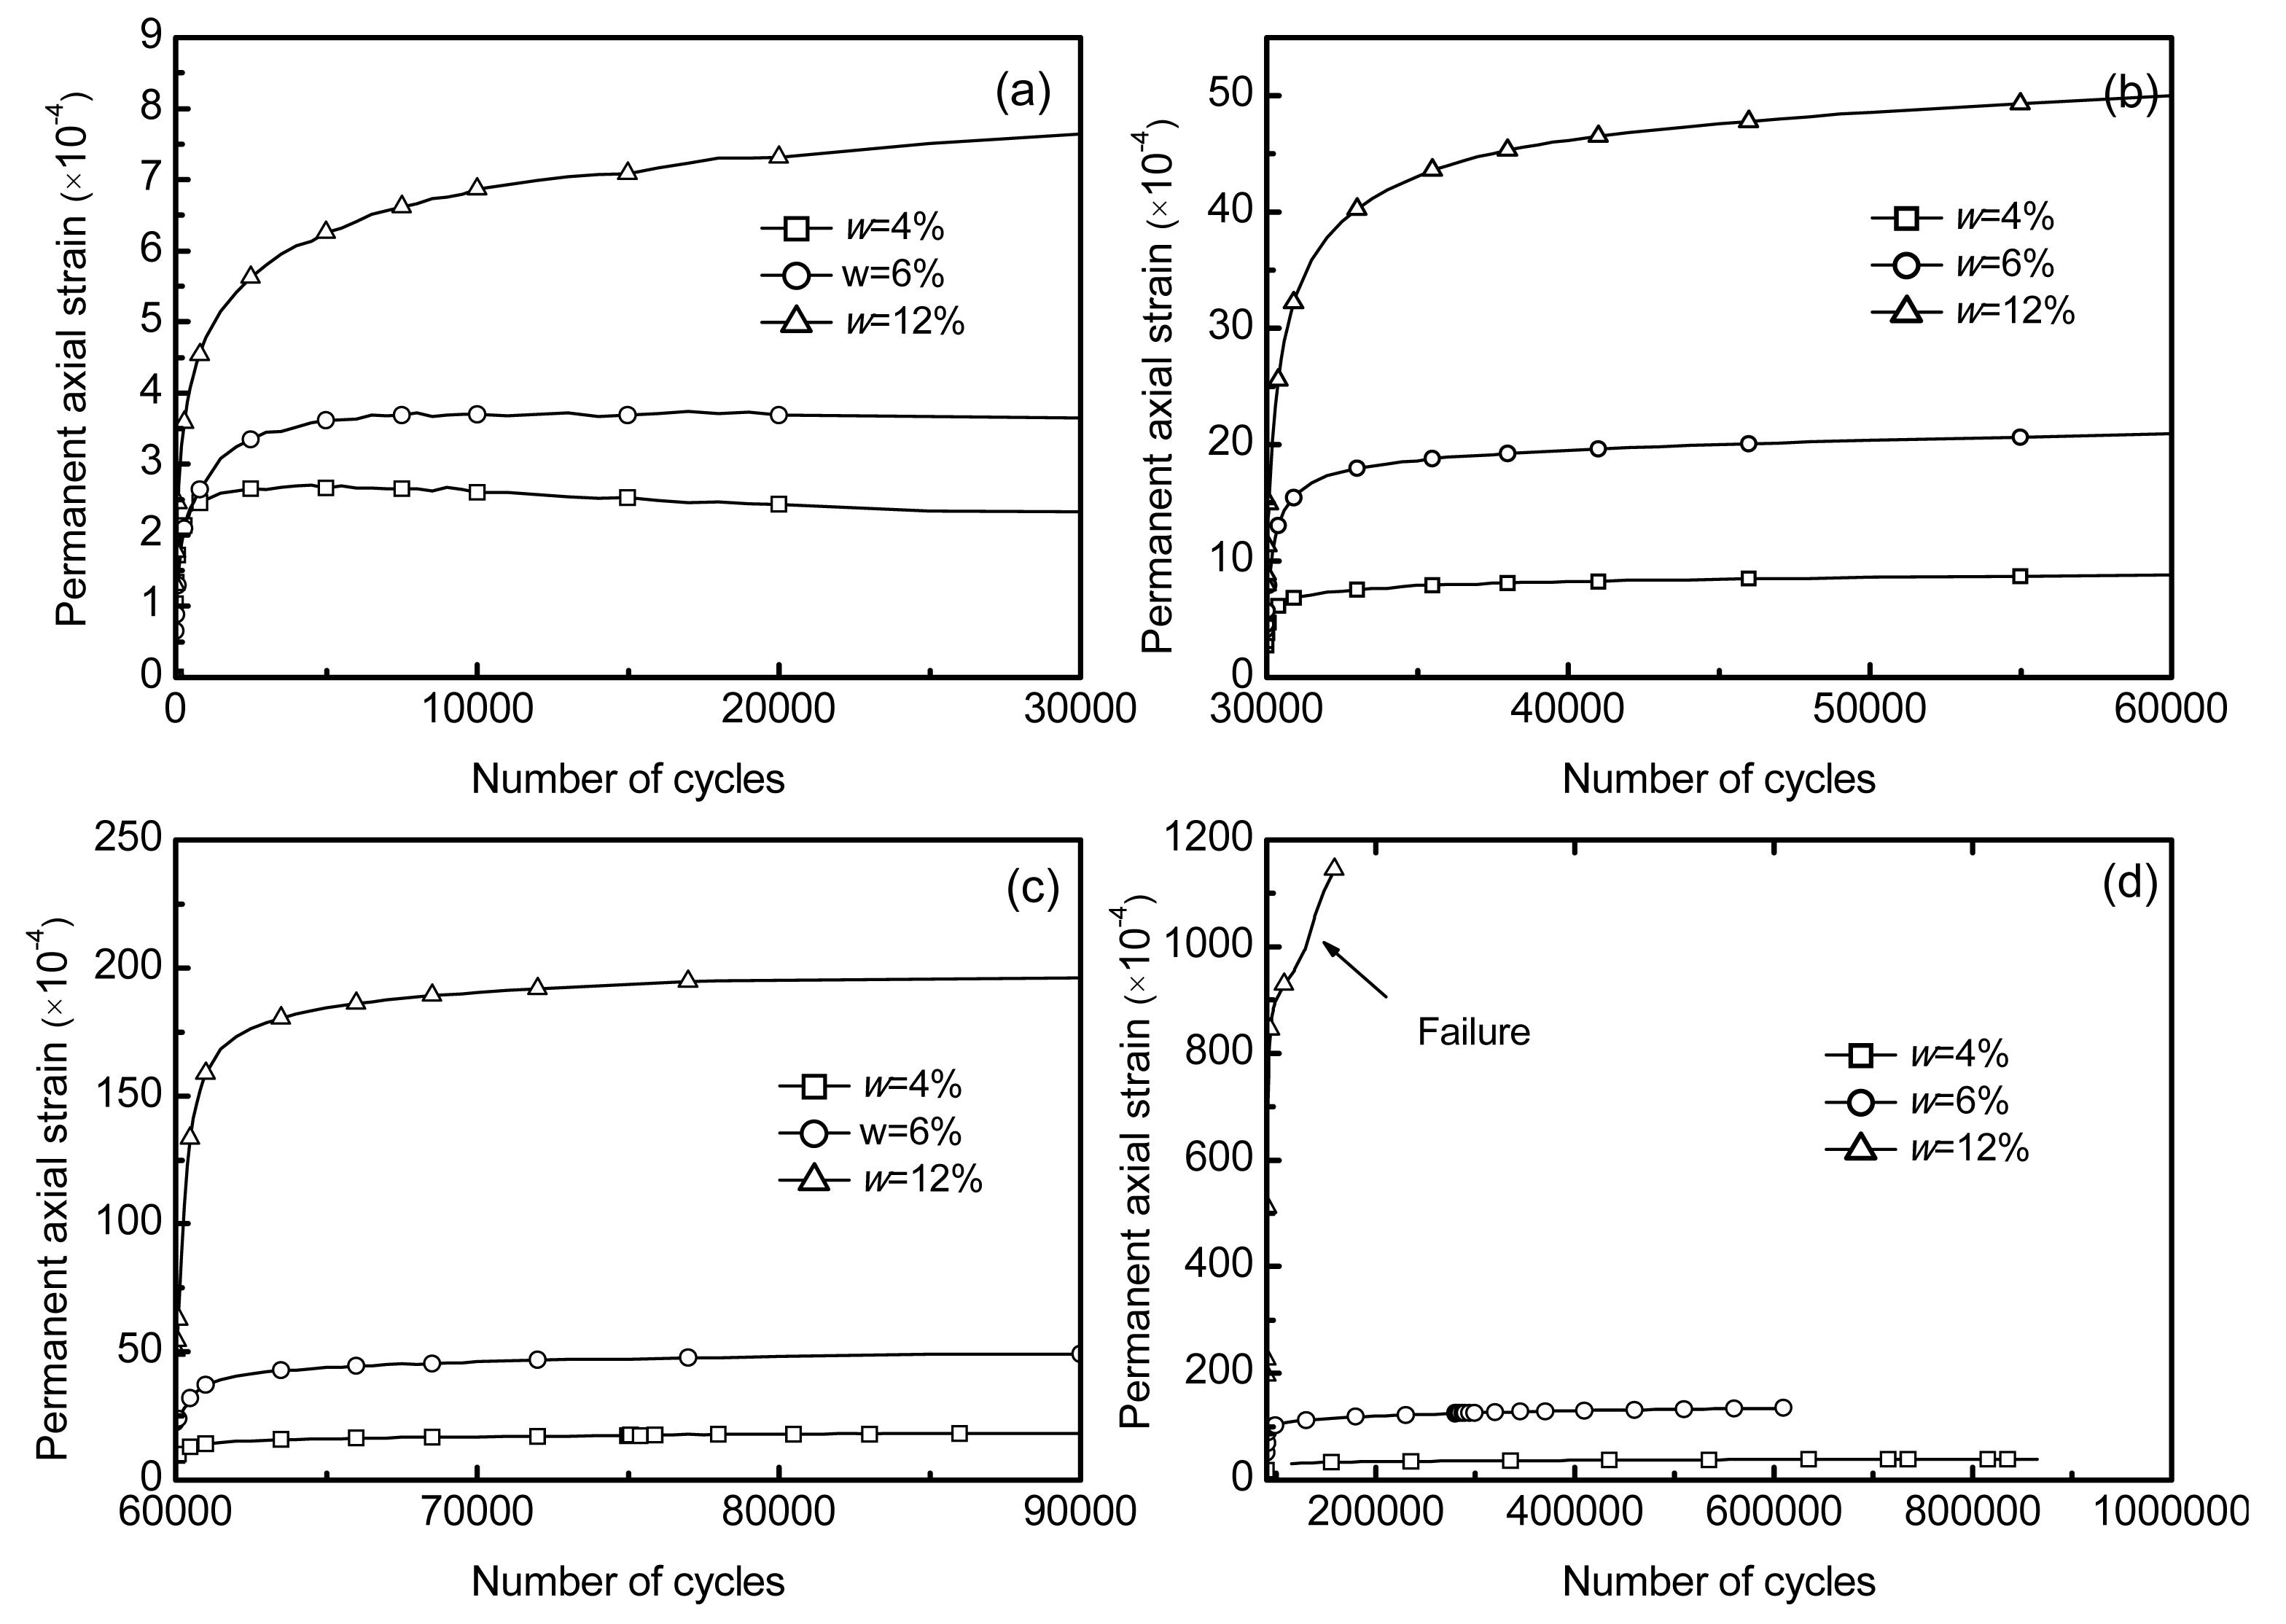
The results from the cyclic triaxial tests at different water contents (4%, 6% and 12%) are shown in Fig. 9 where the permanent axial strain is plotted versus the number of cycles for each of the four loading stages. For the first stage (Fig. 9a), qmax=45 kPa, the test at a water content of 4% shows a quick increase of permanent axial strain during the first cycles. Stabilisation is reached at 2.5×10⁻⁴ after 1000 cycles. For the test at a water content of 6%, the permanent axial strain increases also quickly and stabilises at 3.5×10⁻⁴ after 5000 cycles. The stabilization of permanent axial strain is not observed for the test at w=12%, even after 30 000 cycles; the permanent axial strain reaches 7.5×10⁻⁴ at the end of the first loading stage (Fig. 9a).
Fig.9 Variation of permanent axial strain of fouled ballast FB0 at three different water contents and four different levels of deviator stress: (a) Δqmax=45 kPa; (b) Δqmax=90 kPa; (c) Δqmax=140 kPa and (d) Δqmax=200 kPa
For the second and the third stages (Figs. 9b and 9c, respectively), the following phenomena can be observed: (1) the permanent axial strain increases quickly during the first cycles and then slows down at larger number of cycles; (2) no stabilisation of permanent axial strain is observed even after 30 000 cycles; (3) the higher the water content, the larger the permanent axial strain. For the highest stress level, qmax=200 kPa (Fig. 9d), failure characterised by very large axial permanent development is identified during the first cycle at saturated state (w=12%). For the other tests at a drier state, no failure is observed and the curves reach stabilization at the end.
For further analysis of the effect of water content and stress level on the permanent axial strain, in Fig. 10, the values of cumulated permanent axial strain taken from the end of each stage are plotted versus the degree of saturation (Sr) and deviator stress. The results show that a linear relationship can be established between the final permanent axial strain and the degree of saturation for each stress level (Fig. 10a). For a given degree of saturation, the relationship between the final permanent axial strain and the deviator stress can be fitted by an exponential function (Fig. 10b).
Fig.10 End-stage value of permanent axial strain as a function of degree of saturation (a) and deviator stress (b)
5. Constitutive modeling
Based on the results obtained, a function relating the permanent axial strain to the degree of saturation and applied deviator stress, t(Sr, Δqmax), can be elaborated, as follows:,
where ε1p0, a, and α are parameters, and pa=100 kPa.
To account for the stress level, number of cycles and water content of soil, Eq. (4) is extended as follows:,
where , for N>100 cycles, where A and B are model’s parameters.
The measured data from the tests of w=4% and w=6% were used for determining the model parameters. These parameters were then used to simulate the test at saturated state (w=12%) in order to evaluate the performance of the proposed model. The parameters of the proposed model are determined as follows:
ε1p0, a, and α were determined by fitting Eq. (4) to the permanent axial strain at the end of each loading stage in tests of w=4% (Sr=32%) and w=6% (Sr=48%); the values obtained are: ε1p0=99.42×10⁻⁴, a=−0.25, α=2.54. Parameters A and B were then determined by fitting Eq. (5) to the results from the tests of w=4% (Sr=32%) and w=6% (Sr=48%): A=0.67 and B=0.24. Note that Eq. (5) applies only for the number of cycles larger than 100.
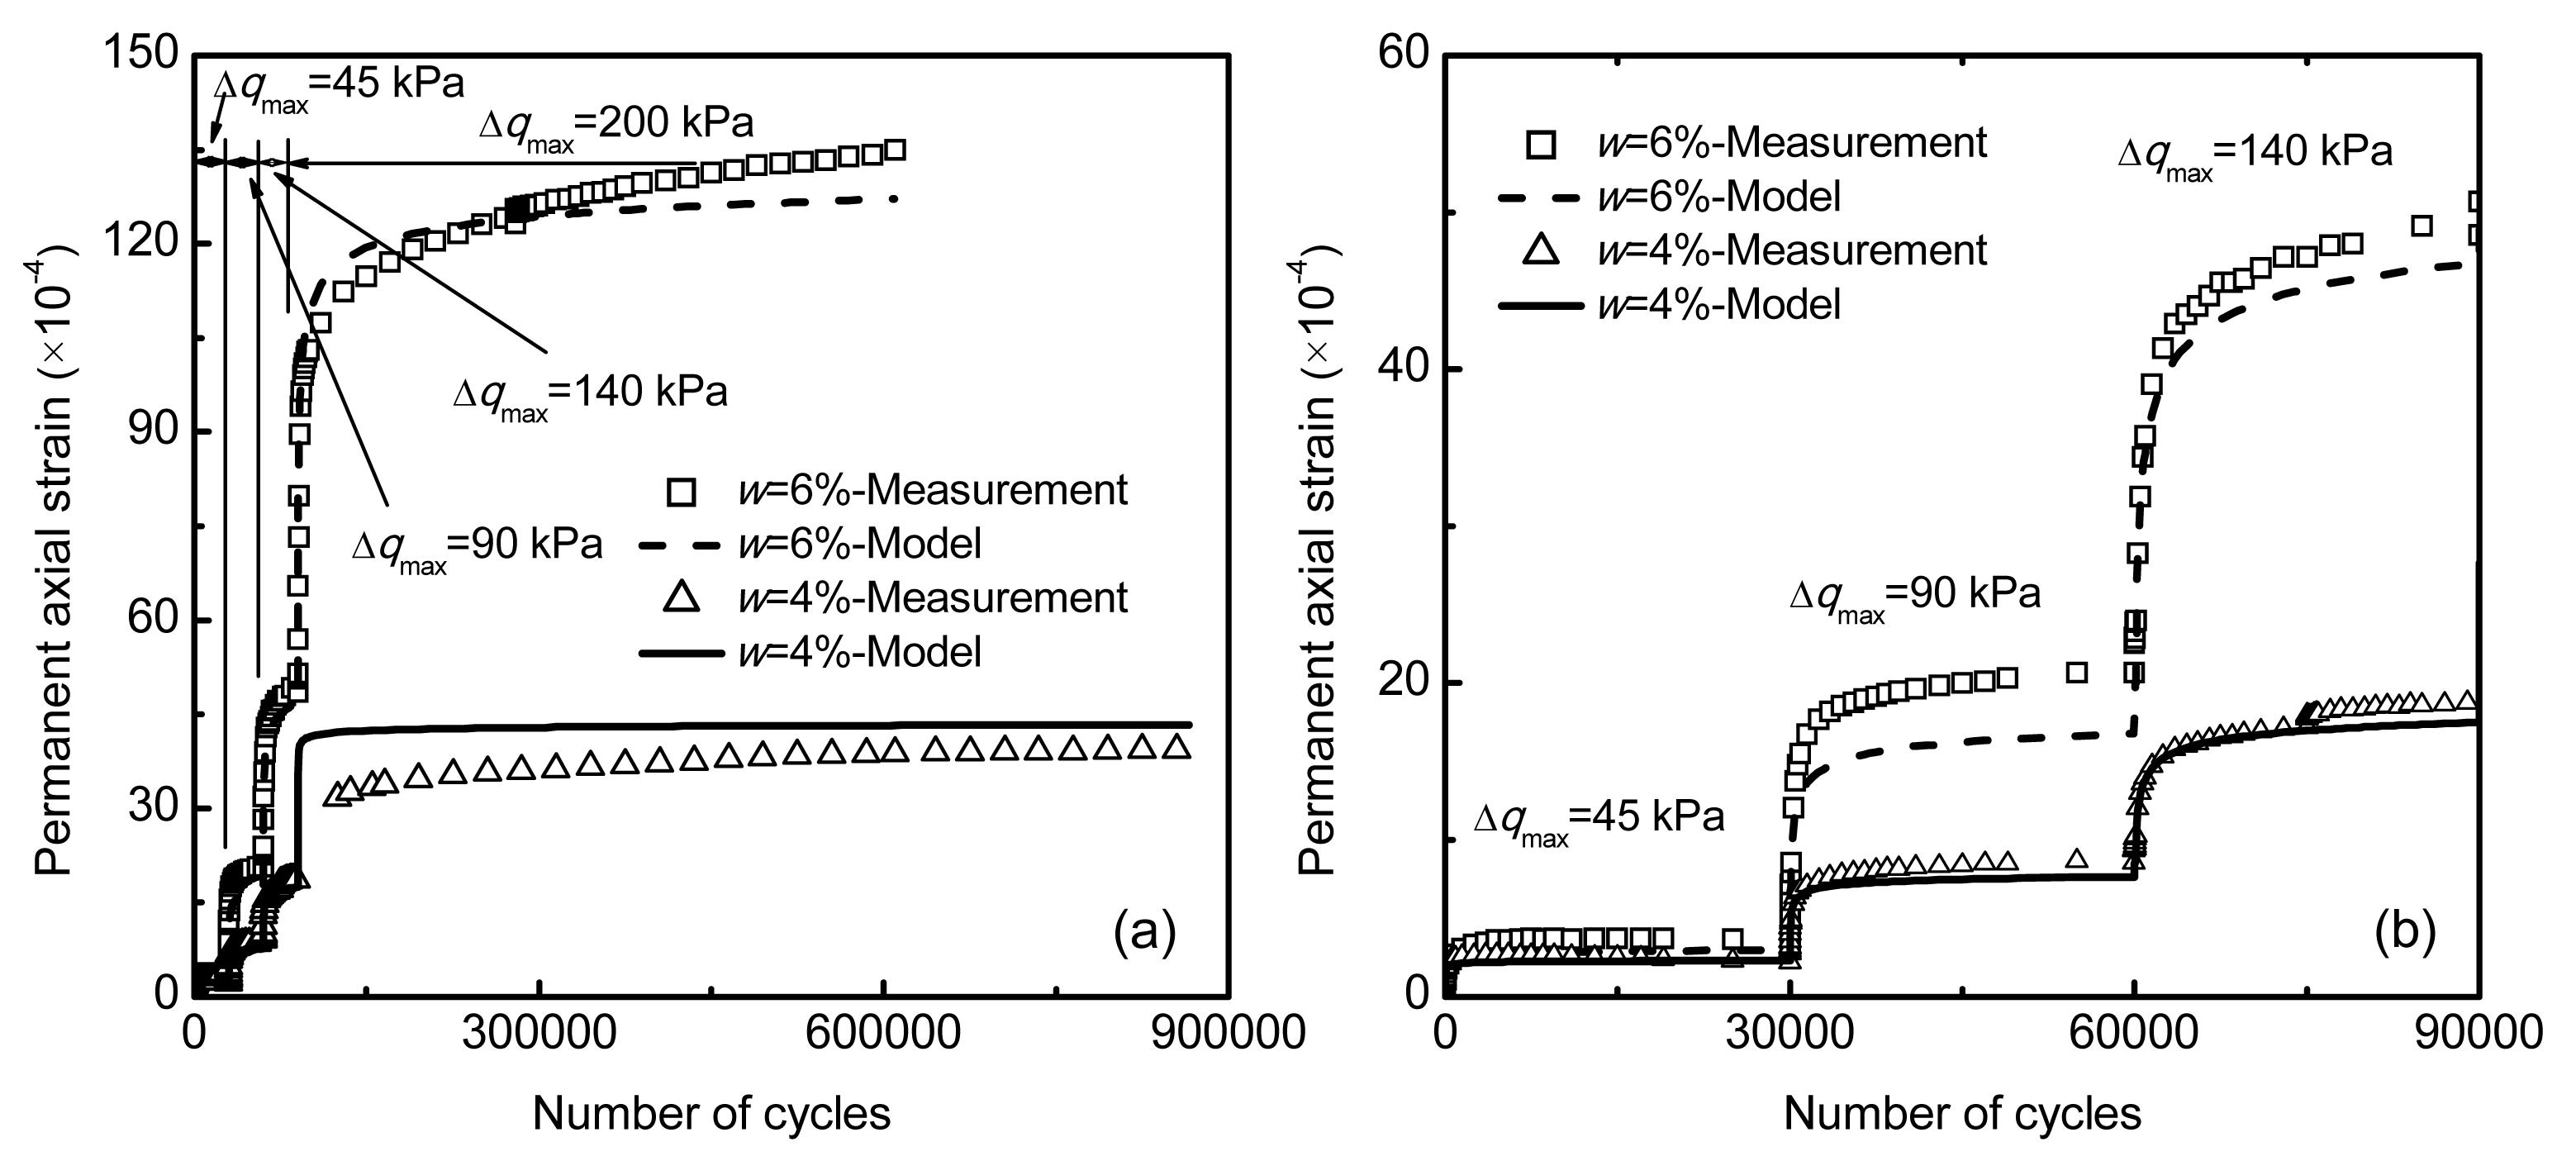
The comparison between the experimental data and fitting curves is shown in Fig. 11 (Fig. 11a for a global view and Fig. 11b for a zoom of the three first steps). For w=4%, in the last loading stage, the model value is close to the measured value at the end of the test; for w=6%, by contrast, larger difference between the simulation and the experimental results can be observed in the last loading stage. It appears thereby that the simulation of test at w=4% is better than that at w=6%. This is related to the final value of permanent axial strain at the end of each loading stage. Indeed, it was observed that stabilisation of the permanent axial strain occurred for the test of w=4% but no stabilisation for the test of w=6%. Better simulation results can be expected if stabilised permanent axial strains are accounted for in the parameters determination.
Fig.11 Comparison between measured values and fitting curves (a) A global view; (b) A zoom of the three first steps
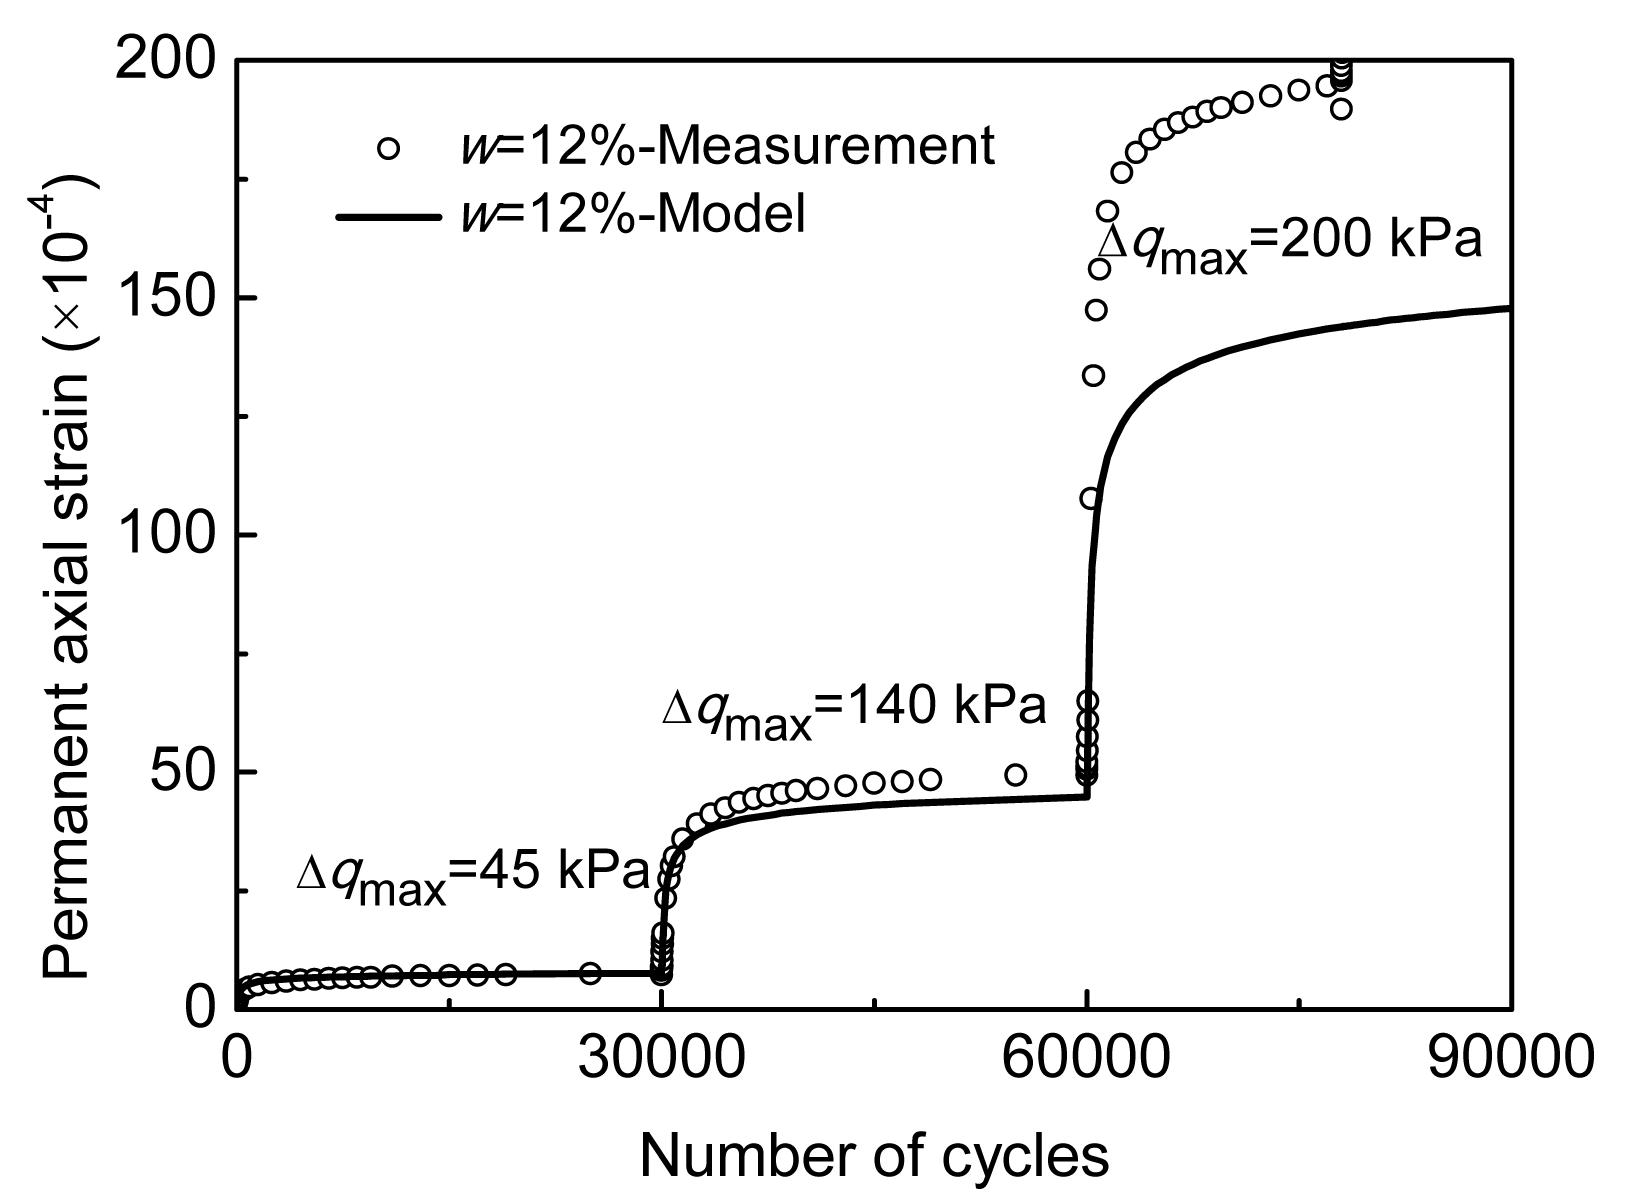
The parameters of the model thus determined were then used to simulate the test of saturated specimen. Fig. 12 depicts the comparison between the experimental results and the simulation. It can be observed that the parameters determined from tests of w=4% and w=6% enabled a satisfactory simulation of test at w=12% for the first two loading stages. Significant differences between the simulation and the results are, however, observed for the third loading stage that corresponds to large deformations (ε1p>150×10−4). Further analysis shows that in this loading stage, the plastic creep limit (ε1p5000−ε1p3000>4×10⁻⁴, where ε1p5000 and ε1p3000 are the accumulated permanent axial strains at 5000 cycles and 3000 cycles, respectively) defined in AFNOR (2004) was exceeded. This shows that the proposed model can only fit well with the permanent deformation below the plastic creep limit. This result is similar to that obtained by Werkmeister et al. (2003) on unbound granular materials. According to the obtained parameters for the proposed model, there is no permanent axial strain of fouled ballast when its degree of saturation is lower than 25%.
Fig.12 Comparison between measured and predicted permanent axial strains for fouled ballast FB0 at 12% of water content
6. Conclusions
The hydro-mechanical behaviour of fouled ballast was investigated by carrying out infiltration tests and triaxial tests under both monotonic and cyclic loadings. Both the water content and fines content effects on the hydraulic behaviour were investigated, whereas only water content effect on the mechanical behaviour was studied. A constitutive model that accounts for the effects of stress level, number of cycles and water content was also proposed.
The effect of water content on the hydraulic behaviour was found similar to that for common unsaturated soils, i.e., the hydraulic conductivity decreases with increasing suction. It appeared that both the van Genuchten’s model and Brooks-Corey’s model can describe satisfactorily the hydraulic conductivity changes in the range of suctions considered. Further data are needed to verify the models in the low suction range.
It was difficult to precisely evaluate the effect of fines content on the hydraulic conductivity because of the significant scatter of data. It can be reasonably assumed from the results obtained that this effect is negligible.
The shear strength envelope translates when changing the water content, showing that the decrease of shear strength due to water content increase is mainly related to the decrease in apparent cohesion, and the friction angle being almost constant.
A significant effect of water content on the permanent axial strain was identified by cyclic triaxial tests: for a given stress level, the permanent axial strain increases proportionally with the water content. Other tests have been performing to investigate the effect of fines content.
A constitutive model was proposed that allows the effects of stress level, number of cycles and water content to be taken into account. The simulation results showed that the proposed model can only fit well with the permanent deformation below the plastic creep limit. This model will be extended to the effect of fines content when the related mechanisms are sufficiently evidenced experimentally.
From a practical point of view, the experimental evidence is helpful in evaluating the effect of water content on the hydro-mechanical behaviour of the fouled ballast layer. Moreover, the constitutive law proposed allows quantification of the permanent settlement of this layer when the law’s parameters are estimated.
Acknowledgements
This study is part of the French national project namely RUFEX (reinforcement and re-use of platforms and existing foundations). The supports of Société Nationale des Chemins de Fer (SNCF), Réseau Ferré de France (RFF) and Ecole des Ponts ParisTech (ENPC), France are also gratefully acknowledged.
[1] AFNOR, 2004. EN 13286-7Unbound and Hydraulically Bound MixturesPart 7: Cyclic Load Triaxial Test for Unbound Mixtures, :
[2] Anderson, W.F., Fair, P., 2008. Behavior of railroad ballast under monotonic and cyclic loading. Journal of Geotechnical and Geoenvironmental Engineering, 134(3):316-327.
[3] Barksdale, R.D., 1972. Laboratory Evaluation of Rutting in Base Course Materials. , Proceedings of the Third International Conference on Structural Design of Asphalt Pavement,3:161-174.
[5] Brown, S.F., 1974. Repeated load testing of a granular material. Journal of Geotechnical Engineering, 100(7):825-841.
[6] Bruckler, L.B., Angulo-Jaramillo, P., Ruy, R., 2002. Testing an infiltration method for estimating soil hydraulic properties in the laboratory. Soil Science Society of America Journal, 66(2):384-395.
[7] Chapuis, R.P., Masse, I., Madinier, B., 2006. Essai de Drainage en Colonne Pour Obtenir les Propriétés non Saturées de Matériaux Grossiers. , Sea to Sky Geotechnique59th Canadian Geotechnical Conference, Vancouver, Canada, 905-912. :905-912.
[8] Cui, Y.J., Tang, A.M., Marcial, D., Terpereau, J.M., Marchadier, G., Boulay, X., 2007. Use of a differential pressure transducer for the monitoring of soil volume change in cyclic triaxial test on unsaturated soils. Geotechnical Testing Journal, 30(3):227-233.
[9] Cui, Y.J., Tang, A.M., Loiseau, C., Delage, P., 2008. Determining the unsaturated hydraulic conductivity of a compacted sand-bentonite mixture under constant-volume and free-swell conditions. Physics and Chemistry of the Earth Parts A/B/C, 33:S462-S471.
[10] Daniel, D.E., 1982. Measurement of hydraulic conductivity of unsaturated soils with thermocouple psychrometers. Soil Science Society of America Journal, 46(6):1125-1129.
[11] Delage, P., Cui, Y.J., 2001. Comportement Mcanique des Sols non Saturs. Article C302, Ed, (in French), Techniques Ingnieur,:
[12] Duong, T.V., Trinh, V.N., Cui, Y.J., Tang, A.M., Calon, N., 2013. Development of a large-scale infiltration column for studying the hydraulic conductivity of unsaturated fouled ballast. Geotechnical Testing Journal, 36(1):1-10.
[13] Dupla, J.C., Pedro, L.S., Canou, J., Dormieux, L., 2007. Mechanical behaviour of coarse grained soils reference. Bulletin de Liaison des Laboratoires des Ponts et Chausses, (N1),268-269:1-58(N1):1-58.
[14] Ekblad, J., 2006. Influence of water on coarse granular road material properties. Road Materials and Pavement Design, 7(3):369-404.
[15] Ekblad, J., 2008. Statistical evaluation of resilient models characterizing coarse granular materials. Materials and Structures, 41(3):509-525.
[16] Gidel, G., Hornych, P., Chauvin, J.J., Breysse, D., Denis, A., 2001. A new approach for investigating the permanent deformation behaviour of unbound granular material using the repeated load triaxial apparatus. Bulletin de Liaison des Laboratoires des Ponts et Chausses, 233:5-21.
[17] Gidel, G., Breysse, D., Denis, A., 2002. Influence de l’état hydrique et des sollicitations routières sur l’évolution du comportement des graves non traitées calcaires utilisées en assise de chaussée. Revue Franaise de Gnie Civil, (in French),6(5):789-799.
[18] Hornych, P., Cort, J.F., Paute, J.L., 1993. Etude des déformations permanents sous chargements répétés de trois graves non traitées. Bulletin de Liaison des Laboratoires des Ponts et Chausses, (in French),184:77-84.
[19] Indraratna, B., Ionescu, D., Christie, H.D., 1998. Shear behavior of railway ballast based on large-scale triaxial tests. Journal of Geotechnical and Geoenvironmental Engineering, 124(5):439-449.
[21] Kalcheff, I.V., Hicks, R.G., 1973. Test procedure for determining the resilient properties of granular materials. Journal of Testing and Evaluation, 1(6):472-479.
[22] Karam, J.P., Cui, Y.J., Tang, A.M., Terpereau, J.M., Marchadier, G., 2009. Experimental study on the cyclic resistance of a natural loess from Northern France. Soils and Foundations, 49(3):421-429.
[23] Lackenby, J., Indraratna, B., McDowell, G., Christie, D., 2007. Effect of confining pressure on ballast degradation and deformation under cyclic triaxial loading. Geotechnique, 57(6):527-536.
[24] Lekarp, F., Dawson, A., 1998. Modelling permanent deformation behaviour of unbound granular materials. Construction and Building Materials, 12(1):9-18.
[25] Li, D., Selig, E.T., 1994. Resilient modulus for fines-grained subgrade soils. Journal of Geotechnical Engineering, 120(6):939-957.
[26] Malla, R.B., Joshi, S., 2008. Subgrade resilient modulus prediction models for coarse and fines-grained soils based on long-term pavement performance data. International Journal of Pavement Engineering, 9(6):431-444.
[27] Munoz-Castelblanco, J.A., Pereira, J.M., Delage, P., Cui, Y.J., 2011. The water retention properties of a natural unsaturated loess from Northern France. Gotechnique, 62(2):95-106.
[28] Munoz-castelblanco, J.A., Pereira, J.M., Delage, P., Cui, Y.J., 2012. The influence of changes in water content on the electrical resistivity of a natural unsaturated loess. Geotechnical Testing Journal, 35(1):11-17.
[29] Munoz-Castelblanco, J.A., Delage, P., Pereira, J.M., Cui, Y.J., 2012. On-sample water content measurement for a complete local monitoring in triaxial testing of unsaturated soils. Geotechnique, 62(7):595-604.
[30] Paute, J.L., Jouve, P., Martinez, J., Ragneau, E., 1988. Modèle de calcul pour le dimensionnement des chaussées souples. Bulletin de Liaison des Laboratoires des Ponts et Chausses, (in French),156:21-36.
[31] Prez, I., Romana, M.G., Medina, L., 2006. Influence of Stress Levels on the Development of Permanent Deformation in Unbound Granular Materials. , Pavement Mechanics and Performance: Proceedings of Sessions of GeoShanghai, Shanghai, China, 180-188. :180-188.
[32] Raymond, G.P., Williams, D.R., 1978. Repeated load triaxial tests on dolomite ballast. Journal of the Geotechnical Engineering Division, 104(7):1013-1029.
[33] Raymond, G.P., Bathurst, R.J., 1994. Repeated-load response of aggregates in relation to track quality index. Canadian Geotechnical Journal, 31(4):547-554.
[34] Selig, E.T., Water, J.M., 1994. Track Geotechnology and Substructure Management. Thomas Telford,London :
[35] Shenton, M.J., 1974. Deformation of Railway Ballast under Repeated Loading Triaxial Tests. Soil Mechanics Section. British Railways Research Department,Derby, England :
[36] SNCF, 2009. Sollicitations Mécaniques Dans la Plate-forme. Mesures D’accélérations Verticales Dans la Plate-forme. Internal Technical Report R2520-2009-01, (in French),:
[37] Stewart, H.E., 1986. Permanent strain from cyclic variable-amplitude loadings. Journal of Geotechnical Engineering, 112(6):646-660.
[38] Suiker, A.S.J., Selig, E.T., Frenkel, R., 2005. Static and cyclic triaxial testing of ballast and subballast. Journal of Geotechnical and Geoenvironmental Engineering, 131(6):771-782.
[40] Tang, A.M., Cui, Y.J., Trinh, V.N., Szerman, Y., Marchadier, G., 2009. Analysis of the railway heave induced by soil swelling at a site in southern France. Engineering Geology, 106(1-2):68-77.
[41] Trani, L.D.O., Indraratna, B., 2010. Assessment of subballast filtration under cyclic loading. Journal of Geotechnical and Geoenvironmental Engineering, 136(11):1519-1527.
[42] Trinh, V.N., Tang, A.M., Cui, Y.J., Dupla, J.C., Canou, J., Calon, N., Lambert, L., Robinet, A., Schoen, O., 2011. Caractérisation des matériaux constitutifs de plate-forme ferroviaire ancienne. Revue Franaise de Gotechnique, (in French),134-135:64-75.
[43] Trinh, V.N., Tang, A.M., Cui, Y.J., Dupla, J.C., Canou, J., Calon, N., Lambert, L., Robinet, A., Schoen, O., 2012. Mechanical characterisation of the fouled ballast in ancient railway track substructure by large-scale triaxial tests. Soils and Foundations, 52(3):511-523.
[44] van Genuchten, M.T., 1980. A closed-form equation for predicting the hydraulic conductivity of unsaturated soils. Soil Science Society of America Journal, 44(5):892-898.
[45] Werkmeister, S., Numrich, R., Dawson, A.R., Wellner, F., 2003. Design of granular pavement layers considering climatic conditions. Transportation Research Record, 1837(1):61-70.
[46] Wind, G.P., 1966. Capillary Conductivity Data Estimated by a Simple Method. , Proceedings of the Wageningen Symposium, Wageningen, the Netherlands, 181-191. :181-191.
[47] Wolff, H., Visser, A.T., 1994. Incorporating elasto-plasticity in granular layer pavement design. Proceedings of the Institution of Civil Engineers: Transport, 105(4):259-272.
[48] Yang, C., Cui, Y.J., Pereira, J.M., Huang, M.S., 2008. A constitutive model for unsaturated cemented soils under cyclic loading. Computer and Geotechnics, 35(6):853-859.
[49] Ye, W.M., Cui, Y.J., Qian, L.X., Chen, B., 2009. An experimental study of the water transfer through compacted GMZ bentonite. Engineering Geology, 108(3-4):169-176.
Open peer comments: Debate/Discuss/Question/Opinion


Open peer comments: Debate/Discuss/Question/Opinion
<1>