Affiliation(s):
1.
State Key Laboratory of Engine, Tianjin University, Tianjin 300072, China; moreAffiliation(s): 1.
State Key Laboratory of Engine, Tianjin University, Tianjin 300072, China; 2.
SAIC Motor Technical Center, Shanghai 201804, China; 3.
School of Materials Science and Engineering, Tianjin University, Tianjin 300072, China; 4.
Civil Aviation University of China, Tianjin 300300, China; less
Zhen-peng He, Jun-hong Zhang, Zhou-yu Li, Lin Ba, Gui-chang Zhang, Kai-nan Wang, Xing Lu. Inter-asperity cavitation for misalignment journal lubrication problem based on mass-conservative algorithm[J]. Journal of Zhejiang University Science A, 2013, 14(9): 642-656.
@article{title="Inter-asperity cavitation for misalignment journal lubrication problem based on mass-conservative algorithm", author="Zhen-peng He, Jun-hong Zhang, Zhou-yu Li, Lin Ba, Gui-chang Zhang, Kai-nan Wang, Xing Lu", journal="Journal of Zhejiang University Science A", volume="14", number="9", pages="642-656", year="2013", publisher="Zhejiang University Press & Springer", doi="10.1631/jzus.A1300080" }
%0 Journal Article %T Inter-asperity cavitation for misalignment journal lubrication problem based on mass-conservative algorithm %A Zhen-peng He %A Jun-hong Zhang %A Zhou-yu Li %A Lin Ba %A Gui-chang Zhang %A Kai-nan Wang %A Xing Lu %J Journal of Zhejiang University SCIENCE A %V 14 %N 9 %P 642-656 %@ 1673-565X %D 2013 %I Zhejiang University Press & Springer %DOI 10.1631/jzus.A1300080
TY - JOUR T1 - Inter-asperity cavitation for misalignment journal lubrication problem based on mass-conservative algorithm A1 - Zhen-peng He A1 - Jun-hong Zhang A1 - Zhou-yu Li A1 - Lin Ba A1 - Gui-chang Zhang A1 - Kai-nan Wang A1 - Xing Lu J0 - Journal of Zhejiang University Science A VL - 14 IS - 9 SP - 642 EP - 656 %@ 1673-565X Y1 - 2013 PB - Zhejiang University Press & Springer ER - DOI - 10.1631/jzus.A1300080
Abstract: Journal misalignment is common in journal bearings. When severe journal misalignment takes place, it affects nearly all aspects of bearing performance. This paper provided a comprehensive analysis of misaligned journal bearings based on two different mass-conservative models which appropriately took into account film rupture and reformation. The lubrication characteristics and performance parameters including the cavitation zones, pressure distribution, density distribution, oil leakage, load capacity, moment, and attitude angle were compared with the traditional lubrication model. The results showed that cavitation has great effect on bearing performances, especially when the surface roughness is large. Therefore, it is necessary to consider the effects of journal misalignment alongside inter-asperity cavitation theory in the design and analyses of journal bearings.
Darkslateblue:Affiliate; Royal Blue:Author; Turquoise:Article
Article Content
1. Introduction
Journal misalignment generally occurs in journal bearings due to a number of causes, such as shaft deformation under load, improper installation or manufacture and assembly errors in the bearing, or thermal deformation of the shaft. They can individually or collectively cause misalignment with often undesirable consequences in bearing performance. Full understanding of the misalignment mechanism and establishment of the precise lubrication model will help researchers to assess the effect of the misalignment on bearing performance and introduce a misalignment factor into their calculations which can eliminate some of the discrepancies found in numerical simulations.
Many researchers have studied the effect of journal misalignment on the lubrication performance of journal bearings. McKee (1932) firstly analyzed the effects of misalignment on pressure distribution in the axial direction of a journal bearing. Dubois et al. (1957) experimentally investigated the pressure field and the misalignment of couples under journal misalignment. They observed that the permanent deformation of the bearing at its ends causes the maximum pressure to increase and the performance of the bearing to reduce under severe conditions of misalignment. Then they also found that shaft eccentricity at the end of the bearing is related to axial flow rate and local temperatures in the bearing. Bousaid and Chaomleffel (1987) presented the influence of misalignment parameters on dynamic characteristics of three asymmetric lobed bearings for two values of eccentricity ratio ε0=0.2 and 0.8. They demonstrated that the influence of misalignment is important at lower eccentricity ratios particularly when the degree of misalignment exceeds 60%. Pierre et al. (2002; 2004) compared the experimental data with theoretical results of a thermohydrodynamic study of a misaligned plain journal bearing. They concluded that the misalignment increase temperatures in the bearing and significantly decrease the minimum film thickness. Guha (2000; 2002) solved the problem of isotropic steady-state characteristics of hydrodynamic journal bearings considering the isotropic roughness effect. The steady-state characteristics of a journal bearing in terms of load, attitude angle, oil leakage, frictional coefficient, and misalignment moment are estimated with various values of roughness parameters, misalignments, and eccentricity ratios. Nikolakopoulos (1994; 1997; 2008) presented an analysis of a misaligned journal bearing operating in linear and nonlinear regions. He also examined the effects of the misalignments on the stability of a linear rotor-bearing system in laminar flow, via the direct method of Lyapunov. Then an analytical model was developed to find the relationship between the friction force, the misalignment angles, and the wear depth. Bouyer and Fillon (2002) presented a study dealing with experimental determination of the performance of a 100 mm diameter journal bearing with an applied misalignment torque. They found that the bearing performance was greatly affected by the misalignment. The maximum pressure in the mid-plane was decreased by 20% for the largest misalignment torque, while the minimum film thickness was reduced by 80%. The misalignment caused more significant changes in bearing performance when the rotational speed or load was low. The hydrodynamic effects were then relatively small and the bearing offered less resistance to the misalignment. Boedo and Booker (2004) investigated both transient and steady state behavior of misaligned bearings, and found that misaligned bearings have infinite load and moment capacity. Wang (2002) considered the fluid flow in the gap formed by rough surfaces, asperity contact, surface thermoelastic deformations, and a temperature-pressure-viscosity relationship for the lubricant, as well as an angular misalignment between the journal and the bearing. The peak pressure moved away from the center of the bearing towards the edge where contact occurs. The journal bearing with misalignment tends to develop asperity contact at a lower eccentricity ratio. Sun et al. (2004; 2005a; 2005b; 2010) studied the effect of journal misalignment caused by shaft deformation under static and rotary loads on journal bearing lubrication performance, such as oil film pressure, oil film thickness, and oil temperature. Then temperature of the oil film was investigated under a thermo-hydrodynamic lubrication model which considered surface roughness. He (2012) coupled the straightforward elastic theory with a lubrication model by using a simple stepped shaft, and the result showed that the angle caused by an unsymmetrical shaft have great effect on both the oil film and temperature distribution. Much attention was paid to the investigation of the performance of the tilting-pad journal bearing under different modes of loading.
Compared with the journal misalignment theory, the cavitation theory which was introduced to the lubrication problem was built later by Jakobsson and Floberg (1957) (also called JFO) and Elrod (1976). Buckholz and Lin (1986) analyzed the effect of journal bearing misalignment on load and cavitation for partial arc journal bearings lubricated by non-Newtonian lubricants. The effect of cavitation on the performance of a line-grooved misaligned bearing for both flooded and starved inlet conditions was investigated. Vijayaraghavan (1989) analyzed a finite grooved misaligned journal bearing considering cavitation and starvation effects. The modified Elrod cavitation algorithm was used to predict the location of the film rupture and reformation fronts. They showed that for higher degrees of misalignment, the performance characteristics of the bearing differ greatly from those predicted in the case of an aligned journal bearing. Jang (2010) took account of film rupture into bearing to analyze misaligned journal bearings based on mass-conservative thermo-hydrodynamic analysis, and analyzed some performances of bearing while neglecting the roughness.
From the literature review, most researchers only focused on the effect of misalignment or cavitation. A few papers coupled misalignment with cavitation, but neglected surface roughness. The cavitation problem was always solved with the special finite difference approach. The mass-conservative theory is also a useful way to solve the cavitation problem. Payvar and Salant (1992) analyzed the effect of sealing structure on the cavitation with mass-conservative theory, but again neglected the surface roughness. Based on the Payvar and Salant (1992)’s theory, Harp (2000; 2001; 2002) carried out the basic theoretical research on cavitation with roughness which was compared with a deterministic model and the model of Patir and Cheng (1978).
Mass-conservative theory has been found to be an accurate model for journal bearing cavitation. In this paper, we focus on the factors which influence cavitation characteristics, the effect of cavitation on the bearing performance, and the cavitation model with roughness. We use a mass-conservative algorithm with consideration of surface roughness for implementation of the JFO boundary conditions to analyze the cavitation phenomenon. Based on mass-conservative theory, a Matlab program is developed to study the effect of cavitation, surface roughness, surface pattern parameter, and eccentricity ratio on the pressure distribution, oil leakage, load capacity, attitude angle, and density. A more accurate model is used to study journal-bearing performance. It will provide guidance for the design of the bearing.
2. Theory
2.1. Film thickness
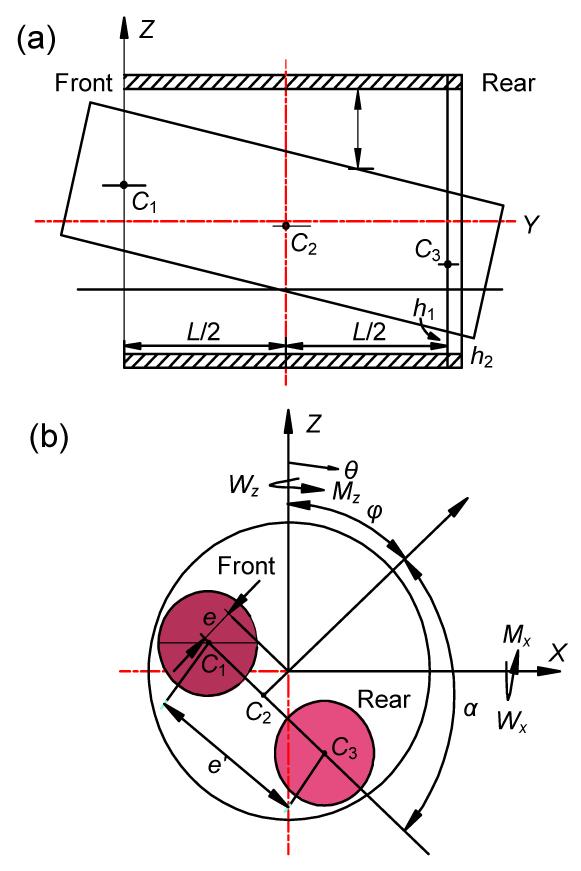
Fig. 1 presents a misaligned journal bearing system; according to its structure, the oil film thickness is written as
,
where c is the clearance of the bearing, e is the eccentricity at the bearing mid-plane, L is the length of the bearing, γ′ is the misalignment angle, φ is the angle between the load line and the line of centers, α′ is the angle between φ and the rear center of the misaligned journal, y is the coordinate axis along the axial direction, and θ is the angular coordinate. C1, C2, and C3 are intersections of the journal axis with the front, middle, and rear planes of the bearing, respectively, e′ is the magnitude of the projection of the axis of the misaligned journal on the mid-plane of the bearing. Mx and Mz are the components of misalignment moments along the x and z directions, respectively. Wx and Wz are the components of load capacities along the x and z directions, respectively, and h1 and h2 are the oil film thickness at different sections.
The governing equation of the traditional lubrication model is defined as
,
where p is the film pressure, R is the bearing radius, u is the velocity along the circumferential direction, and μ is the viscosity of the oil film.
The average Reynolds equation that considers the surface roughness effects of journal and bearing surfaces on the lubricant flow is employed to describe the relationship between the hydrodynamic pressure and the lubricant film thickness.
,
where ϕθ and ϕy are pressure flow factors, ϕs is the shear flow factor, and σ is the composite root mean square (RMS) roughness.
2.2.2. Cavitation
When the cavitation phenomenon occurs, the oil film is divided into a full film region and a cavitation region. There are two main methods to solve cavitation problem: one is to build special finite difference approach, and the other uses mass-conservative algorithm.
In this study, some intermediate variables are introduced in the process of integration, such as α, switch function F. Then the Reynolds equation is integrated together to solve the cavitation region and the full film region. The functions can be written as
,
,
where pref is the reference pressure, ρc is constant density, and pc is the pressure in the cavitation zone.
2.2.3. Cavitation model without roughness
According to Eqs. (4) and (5), F=0, p=pc, and α=(ρ−ρc)/ρc in the cavitation zone. The deviation of equation can be written as
.
When cavitation occurs, the right side of governing equation equals zero, and F=1 in the full film region. All the integrated function with cavitation and full film can be written as
.
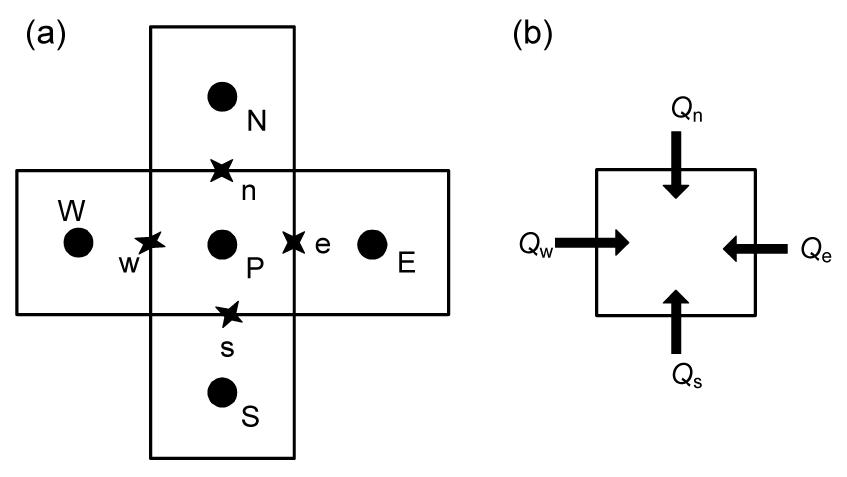
Assuming KP, KE, KW, KS, and KN are h3/(12μ)|P, h3/(12μ)|E, h3/(12μ)|W, h3/(12μ)|S, and h3/(12μ)|N, respectively. According to Fig. 2, Ke, Kw, Ks, and Kn can be defined as follows:
Fig.2 Control volume and value locations (a) Control volume, node, and interface; (b) Oil flux into control volume
The expanded form of Eq. (8) can be rewritten as
.
Eq. (10) concerns the variable of α, which is written as
,
where a1, a2, a3, a4, and a5 are the coefficients of αE, αW, αN, αS, and αP, respectively, and a0 is a constant, thus Eq. (11) can be solved by
.
2.2.4. Cavitation model with roughness
When the surface roughness is considered, the pressure flow factors ϕθ and ϕy, and shear flow factors ϕs,c and ϕc,c, are added to the equation. The governing equation which considers the cavitation and inter-asperity cavitation can be expressed as
,
where is the mathematical expectation of the film thickness after considering the roughness, and .
The expanded form of Eq. (13) can be rewritten as
.
Assuming KP, KE, KW, KS, and KN are new parts with the flow factor. According to mass-conservative algorithm, Ke, Kw, Ks, and Kn can be defined similarly as Eq. (9).
As in Patir and Cheng (1978)’s model, the flow factors are considered to be functions of h/σ and the Peklenik number γ. They are also assumed to be functions of the cavitation number ψ, where .
The choice of ψ to characterize cavitation is based on the observation that cavitation effects increase with increasing fluid viscosity, increasing sliding speed, increasing asperity radius, decreasing roughness, and decreasing pressure relative to the cavitation pressure.
The expression used to fit the flow factors curve in Patir and Cheng (1978)’s model is defined as where γ is surface pattern parameter.
The relationship between flow factors ϕx and ϕy are written as
.
Harp (2001) noticed that the shear flow factor for each film thickness remains distinct up to unique points at which they join a unified curve. A linear curve fit is used to describe the shear flow factors before they join the combined curve. When ψ(h/σ)−21, ϕs is written as
,
where m and c2 are coefficients.
When ψ(h/σ)−2≥limit in Table 1, ϕs is written as
,
where a1=1.334 and b1=1.400, respectively.
The shear flow factor ϕs,c can be expressed as
.
ϕc and ϕc,c are best described by the function as follows:
,
,
where a2=0.657 and b2=0.081 when γ=1.
2.3. Viscosity model
The influence of pressure and temperature is considered by the classical Vogel/Barus equation:
,
where α″ is the coefficient related with pressure. The working limitation temperature for different bearings is 80°–120°. In this study, the SAE20W-30 is selected with the viscosity of 0.02 Pa·s when the oil temperature is 80°.
2.4. Boundary condition
Apart from the solving process, the boundaries of the cavitation model are different from traditional model. They are defined as the inside boundary and outside boundary. The inside boundary is the oil rupture and oil reform position and the outside boundary is the pressure at the front side and rear side. The outside boundary is defined as
.
The boundary at cavitation position is written as
.
At the oil film form position, it satisfies the JFO theory:
.
The oil film form boundary of the cavitation model with roughness is defined as
.
2.5. Oil leakage
The lubricant flow rate Q1 from the front-end plane and the lubricant flow rate Q2 from the rear-end plane of the bearing are given by
,
,
.
2.6. Velocity field
u and v are the integrations of and with two constants and . The two constants can be solved based on the boundary conditions, where the velocities of the shaft and bearing surface are U and 0, respectively. When z=0, u=U and z=h, u=0, the velocities of the oil film along x and y directions can be written as follows:
,
.
2.7. Load capacity
As shown in Fig. 1b, the load components along x and z coordinates are defined as
,
.
Then the load W and attitude angle ϕ are:
,
,
where ϕ′=arctg|Wx/Wz|.
3. Numerical method and calculation process
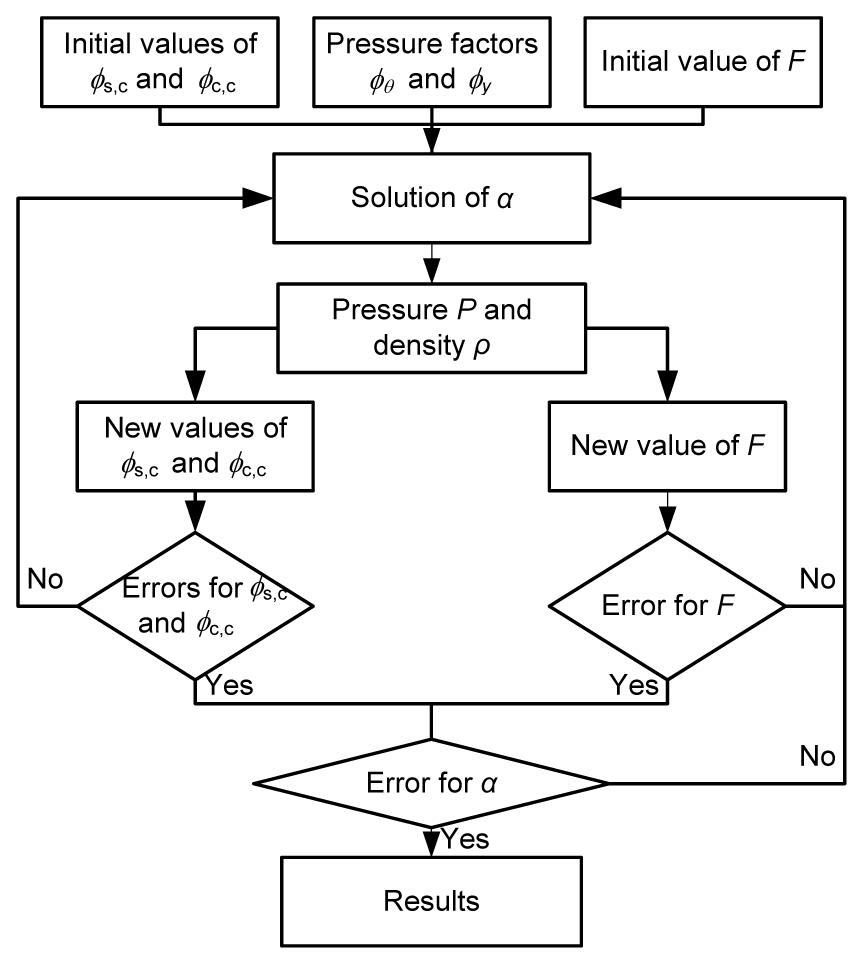
Fig. 3 shows the flow chart of the cavitation calculation for the misalignment bearing. We carried out several experiments with different mesh modes to compare with these results. The mesh points along the circumferential direction m=110 and n=50 along axial direction are found to be sufficient. First, the flow factors ϕθ and ϕy are calculated according to the oil film thickness, ϕc,c and ϕs,c, and values of the switch function are given. The finite difference method is applied to treat the Reynolds equation, which is solved iteratively with the initial guess of viscosity, oil film thickness, and the functions ϕθ, ϕy, ϕc,c, and ϕs,c. The Reynolds equation is solved first with LU=P, then iteratively using the successive over relaxation (SOR) method. The variable αnew in both the cavitation and full film region can be gained after solving the integration equation. Instead of switching the index variable F between zero and one, we introduce a small relaxation factor (0.001) to update the index variable for better control of numerical stability (as shown in Eq. (38)). The new pressure pnew and new density are gained from the relationship between variables α, p, and ρ, then we can gain ϕc,c,new and ϕs,c,new according to pnew. The error tolerance is 0.001 in these simulations. Error between two successive iterations is calculated by
Fig.3 Flow chart of the calculation
To obtain a better convergence, the Reynolds equation is solved iteratively using the SOR method, and the relaxation factors w1=0.2 and w2=0.1. The relaxation equations can be written as
,
,
where
4. Results and discussion
In this section, some results are presented to demonstrate the influence of the eccentricity ratio (ε), misalignment angle, speed, surface roughness, and shear factor on the performance of journal-bearing, and the density distribution, oil speed field, and cavitation zone are also investigated.
4.1. Model validation
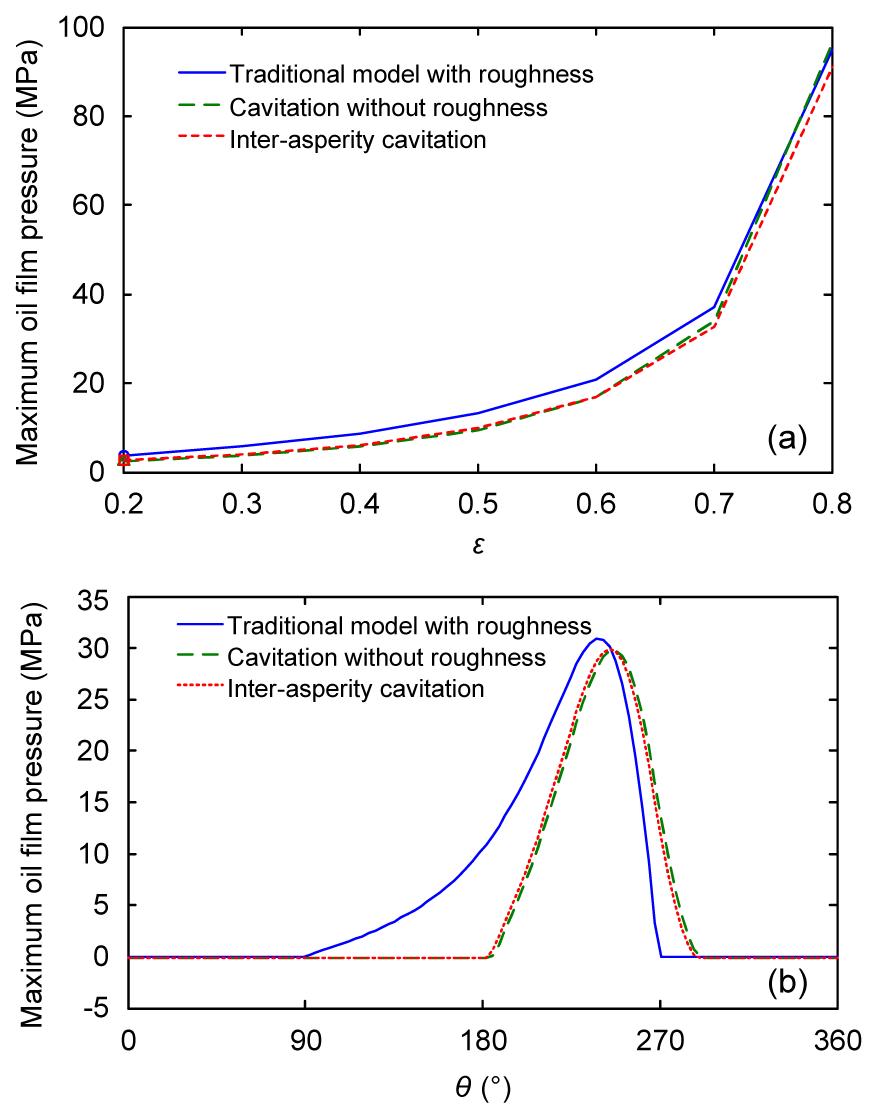
In this study, the maximum oil film pressures (MOFPs) calculated by the cavitation model without roughness and inter-asperity cavitation model are compared with the traditional model (Wang, 2002). Table 2 lists the input data for the misalignment bearing of the three different models. The misalignment angles γ′=0.025°, φ=π/2, and α′=π/2 are chosen in these simulations. Fig. 4a shows that the MOFPs calculated by the traditional model without roughness agree well with those computed by new models at each ε. The MOFPs calculated by the traditional model are slightly higher than those calculated by cavitation model with the mass-conservative algorithm. The MOFP increases greatly when ε increases from 0.7 to 0.8. The MOFPs of the traditional model with roughness, the caviation model without roughness, and inter-asperity cavitation model are 37.029 MPa, 33.882 MPa, and 32.660 MPa, respectively, when ε=0.7. In fact, although the MOFPs have nearly the same values, we find the pressure distribution is quite different. To gain insight into the reason for the difference, the pressures of these three models at the section m=1–110, n=25 are shown in Fig. 4b. The results show that the traditional model overestimates the load capacity region, thus a more detail analysis of the pressure distribution is discussed below.
Table 2
Input data for the misalignment bearing
Parameter
Value
Clearance, c (mm)
0.03
Width, L (mm)
66
Radius, R (mm)
30
Speed, n (r/min)
3000
Density, ρ (kg/m3)
860
Viscocity, μ (Pa·s)
0.02
Cavitation pressure, pc (Pa)
−80 000
Journal roughness, σ1 (μm)
0.4
Bearing roughness, σ2 (μm)
0.8
Fig.4 Model validation for MOFP (a) and pressure distribution comparison (b)
4.2. Pressure distribution analysis
In this section, we provide benchmark results for both aligned and misalignment journal bearings and examine the validity of the 2D pressure analyses that are commonly used in previous studies. Fig. 5 shows the pressure distribution when ε=0.7, φ=π/2, α′=π/2, and γ′=0°. The pressure distribution is symmetrical along the bearing width direction for the aligned journal-bearing. However, the distribution is quite different for these three models. The load bearing region of the traditional model is larger than in the two cavitation models, which starts with the angle of 92.5°, ends at 271°, and the MOFP is 32.763 MPa. The values calculated by the two cavitation models are nearly the same, while the pressure calculated by the inter-asperity cavitation model shifts a little distance along the circumference direction. Figs. 5b and 5c show the pressure calculated by the cavitation model without roughness and inter-asperity cavitation model, compared with pressure at the inlet place A (calculated by the traditional model), pressures at positions B and E are smaller. The pressure gradients of the traditional model at the outlet place is greater than those calculated by the cavitation model, and the oil film pressure also exists in some positions of the bearing edges near the interface of the bearing, such as C, D, F, and G positions. The MOFPs of the inter-asperity cavitation model and cavitation model without roughness is 28.819 MPa and 28.800 MPa, respectively. Small surface roughness has little effect on the pressure. The surface roughness will restrain the oil film from reforming in the inlet position, while accelerate the oil film rupture in the outlet position. The reason is that the oil flow calculated with the cavitation algorithm is different from the traditional model, the more detail research about the flow rule is deserved to be done.
Fig.5 Pressure distribution when ε=0.7, φ=π/2, α′=π/2, and γ′=0° (a) Tradition model; (b) Cavitation model without roughness; (c) Inter-asperity cavitation model
Fig. 6 presents the pressure distribution when ε=0.7, φ=π/2, α′=π/2, and γ′=0.025°. The distribution is also very different when the journal is misaligned. The load bearing region of the traditional model starts with the angle of 92.5°, and ends at 271°, the maximum pressure is 37.029 MPa, the MOFPs for the cavitation model without roughness and inter-asperity cavitation model are 33.882 MPa and 32.660 MPa, respectively, and the load bearing region is clearly smaller than in the traditional model. The bearing load and MOFP decrease significantly when L/D drops. The pressure distribution calculated by the two cavitation models are nearly the same, the load bearing region of cavitation models are also smaller than the traditional model.
Fig.6 Pressure distribution when ε=0.7, φ=π/2, α′=π/2, γ′=0.025° (a) Traditional model; (b) Cavitation model without surface roughness; (c) Inter-asperity cavitation model; (d) Cavitation model without surface roughness, L/D=0.5
4.3. Performance analysis
The end leakage flow rate Q, misalignment moment M, load capacity W, and attitude angle ϕ change with ε when σ1=0.4 μm, σ2=0.8 μm, γ′=0.025°, and γ=1. The results are compared with the traditional model where the roughness is considered (Fig. 7). The results show that the oil leakage of the traditional model is much larger than in the cavitation model, but the attitude angle of the traditional model is much smaller than in the cavitation models. The misalignment moments of the three models are 234.27 N∙s, 233.87 N∙s, and 234.20 N∙s, respectively. The load capacities of the three models are 51.443 N, 46.000 N, and 45.796 N, respectively. The oil leakages of three models are 11.0330 ml/s, 1.2955 ml/s, and 1.1947 ml/s, respectively, when ε=0.7 and L/D=1.1. However, the moment and load capacity will drop when L/D=0.5 (L=30 mm and D=60 mm), thus the appreciate L/D is also very important to gain the demand bearing performances. The reason is that the oil film thickness will increase when L/D drops (h1>h2, as shown in Fig.1).
Fig.7 Bearing performance changes with ε when φ=π/2, α′=π/2, γ′=0.025° Oil leakage (a), moment (b), load capacity (c), and attitude angle (d) comparisons of the three different models
Compared with the traditional model, the attitude angle calculated by the cavitation model will drop clearly when L/D decreases. M and W calculated by the cavitation model without roughness and the inter-asperity cavitation model have little differences from traditional model because of the pressure distribution (as shown in Figs. 5 and 6). So the surface roughness pattern σ1=0.4 μm, σ2=0.8 μm, and γ=1 has little effect on M and W prediction. However, the oil leakage Q and attitude angle ϕ are different greatly, so the cavitation model is very important to predict these two performances.
To make deeper research on the oil leakage, the velocity field at the section of the film thickness h1=0.4h is presented to explain oil flow. The velocity field of other sections along oil film thickness direction is similar with this section. Fig. 8 shows the velocity distribution when ε=0.8, φ=π/2, α′=π/2, and γ′=0.025°. Compared the velocity in Figs. 8b with 8d, surface roughness has little effect on the velocity field when the roughness σ1=0.4 μm, σ2=0.8 μm, and γ=1. The reason for oil leakage difference can be concluded that: (1) the maximum velocity of traditional model at the left interface and right interface is −3.5 m/s and 4.5 m/s, respectively which are greater than the maximum velocity calculated by the cavitation model; (2) the out flow region of the traditional model is larger than the cavitation model; (3) the inflow region appears at the left interface and right interface.
Fig.8 Velocity distribution when ε=0.8, φ=π/2, α′=π/2, and γ′=0.025° (a) Traditional model; Cavitation model without roughness when pc=−80 kPa (b) and pc=0 (c); (d) Inter-asperity cavitation, pc=−80 kPa
4.4. Density analysis
Fig. 9 compares the density ratio (Λ=ρ/ρc) distribution with different cavitation models and different journal speeds. The regions where Λ≥1 and Λ<1 represent the full film region and cavitation zone, respectively. The variation of density ratio in the full film region is very small due to fluid compressibility, and the density equals ρc. The density ratio at the two interfaces are assumed to be Λ=1 due to the atmospheric pressure on the axial boundary. At the inlet position of the cavitation region, the density ratio drops to 0.2 suddenly at the interface of the full film region with the cavitation region (the gradient is larger). Compared with the inlet position, the density gradient at outlet region is smaller, the smallest density value can achieve 0.09, and only the density at two outlet interfaces equals 1. When the surface roughness (σ1=0.4 μm, σ2=0.8 μm, and γ=1) is added to the lubrication model, a small density waving amplitude appears in the cavitation zone. The effect of speed on density is carried out with inter-asperity cavitation, and the results show that the region where the density ratio equals 1 will increase when the speed drops. The reason is that the increase of load capacity region will cause the change of fluid compressibility characteristics.
Fig.9 Density distribution when ε=0.8, φ=π/2, α'=π/2, and γ′=0.025° (a) Cavitation model without roughness, n=3000 r/min; (b) Inter-asperity cavitation, n=3000 r/min; (c) Inter-aspertity cavitation, n=1000 r/min
4.5. Cavitation analysis with different surface pattern parameter and surface roughness
According to Eqs. (16) and (17), the average Reynolds equation not only related with surface roughness but also with shear factor. To study the effect of surface pattern parameter on the cavitation, the pressure and the density calculated with γ=1/9 and γ=9 are selected to compare with γ=1. Table 3 shows the coefficients of Eq. (18) when γ=1/9 and γ=9.
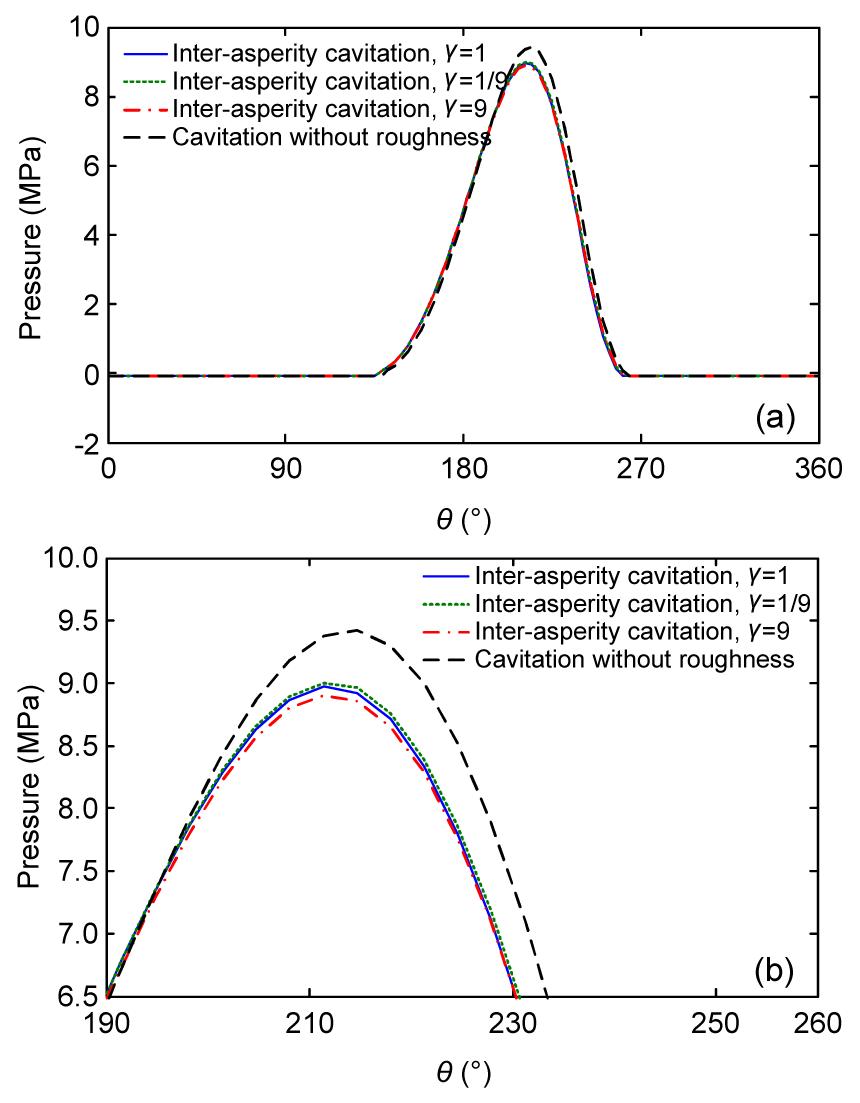
Fig. 10 presents the pressure of the section i=1–m, j=10 when the roughness σ1=0.4 μm, σ2=0.8 μm, ε=0.5, and γ′=0.025° (other sections also shows the same trend with this section). The results show that surface roughness with different shear factors hardly impact the pressure distribution when the roughness is small. Fig. 10b is the magnification of Fig. 10a in the vicinity of the MOFP. The MOFPs of cavitation models calculated with the surface pattern parameter of 1, 1/9, and 9 are 8.9 MPa, 8.969 MPa, and 9 MPa, respectively, and the positions are all 211.4°. However, the MOFP calculated by the cavitation model without roughness is 9.42 MPa, and the position is 214.7°.
Fig.10 Pressure comparison with different shear factors and models (a) Pressure along width direction; (b) Zoom for part results of Fig. 10a
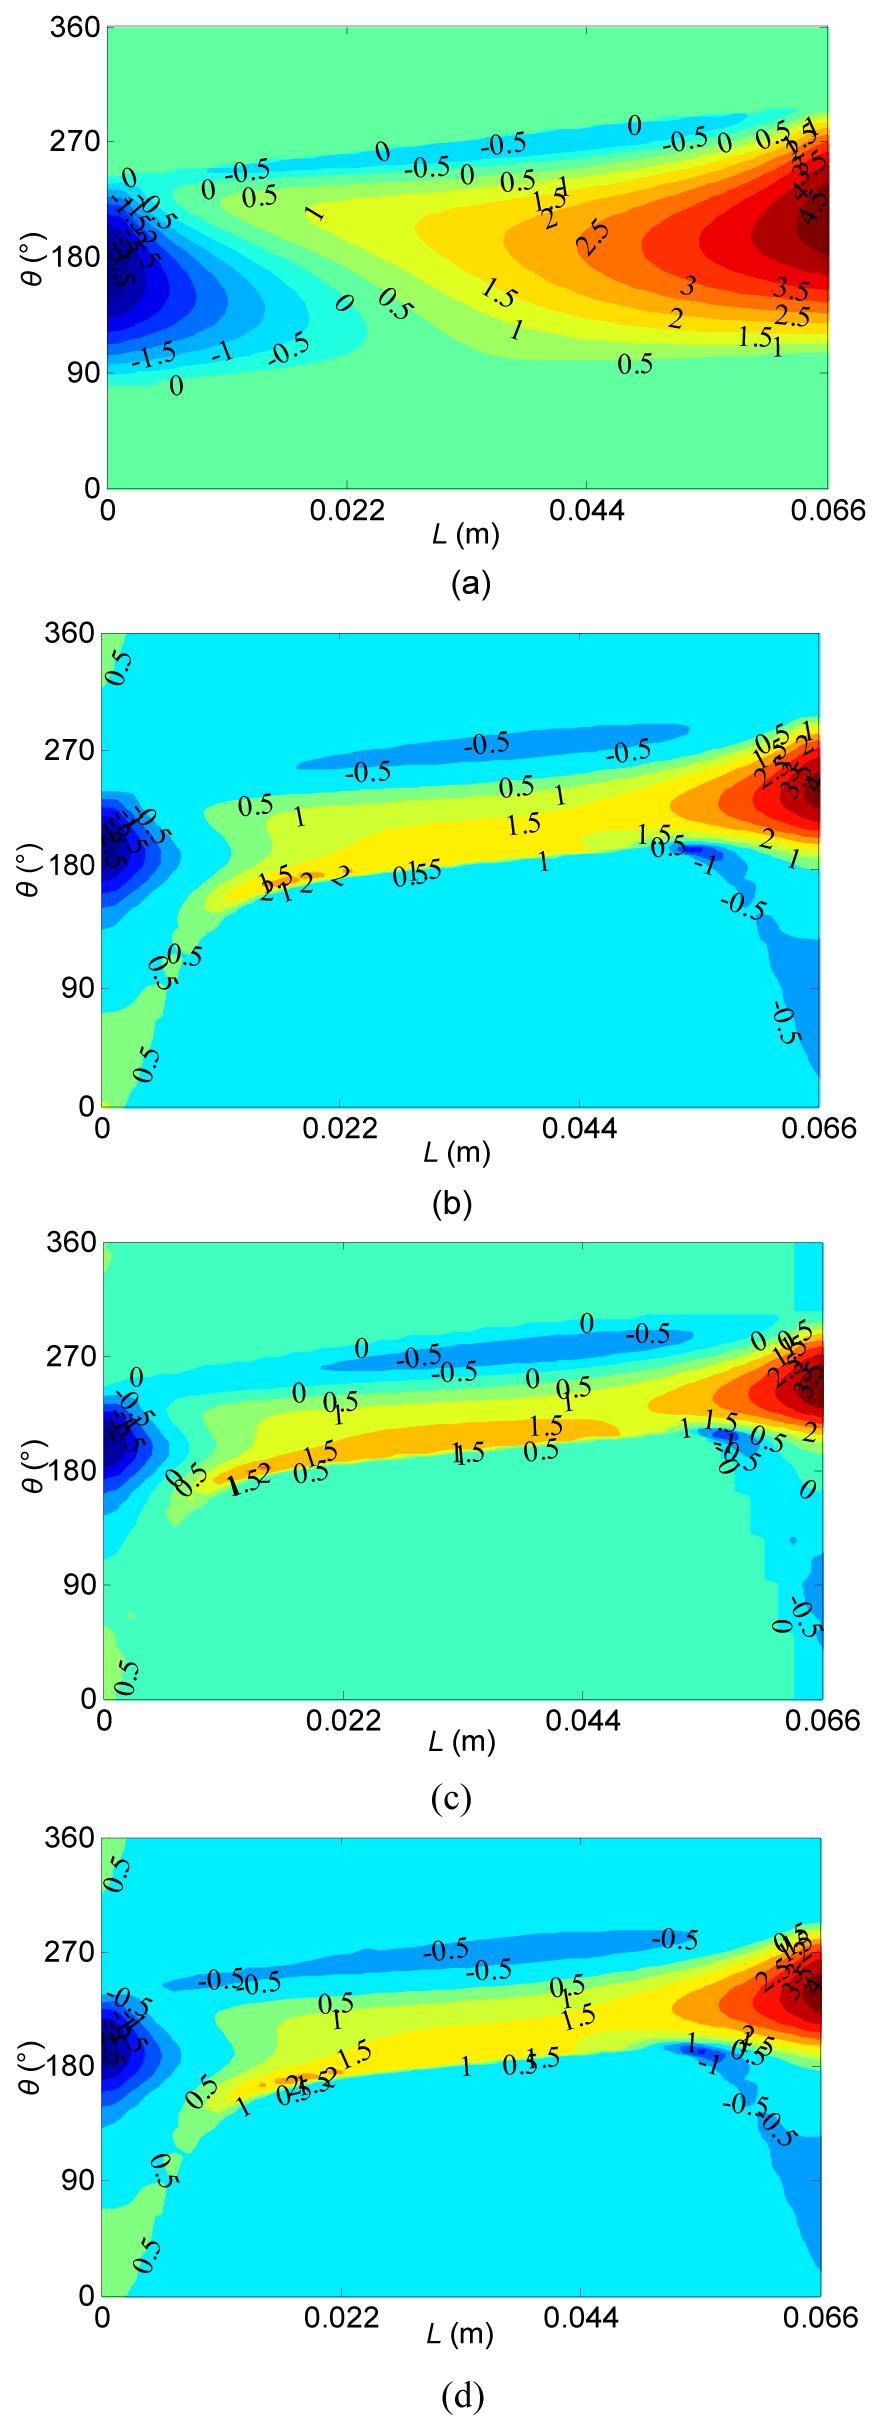
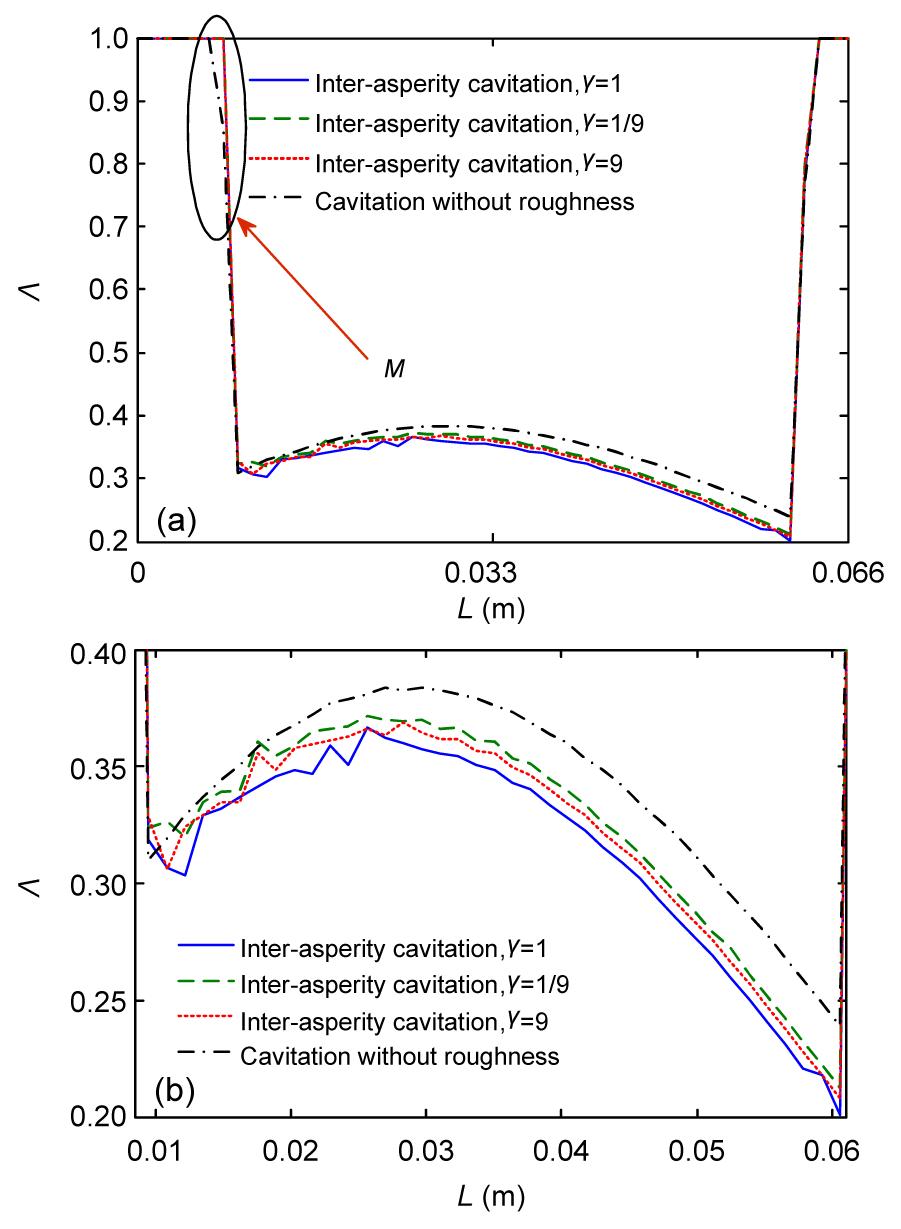
Fig. 11 shows the density at the section i=30, j=1–50, when the roughness σ1=0.4 μm, σ2=0.8 μm, ε=0.5, and γ′=0.025°. The cavitation region is different at the left position (as shown in position M) when the surface roughness is neglected. Fig. 11b is the magnification of Fig. 11a at the bottom region. The results show that: (1) the density will be overestimated when the roughness is neglected; (2) the inter-asperity cavitation model will cause the density line fluctuates along the width direction but smooth along the circumferential direction; (3) compared with γ=1/9 and γ=9, the density calculated with γ=1 is smaller.
Fig.11 Effect of shear factor on density when σ1=0.4 μm, σ2=0.8 μm, ε=0.5, and γ'=0.025° (a) Density along width direction; (b) Zoom for part results of Fig. 11a
Fig. 12 shows the pressure at the section i=1–m, j=10 (other sections also show the same results as this section). Shear factor has little effect on the cavitation at the inlet position but some effect on outlet position. To study the effect of surface roughness on the fluid flow, σ1=1.5 μm, σ2=1.5 μm, ε=0.5, and γ′=0.025° are selected as the input parameters. The MOFP of the cavitation model with the surface pattern parameter 1, 1/9, and 9 are 9.001 MPa, 8.607 MPa, and 9.624 MPa, respectively. Compared with Fig. 10, the results show that pressure is far different when surface roughness increases. Shear factor has little effect on the oil reforming at the inlet position, while it can restrain the oil film from rupturing at the outlet position.
Fig.12 Pressure comparison of different shear factors
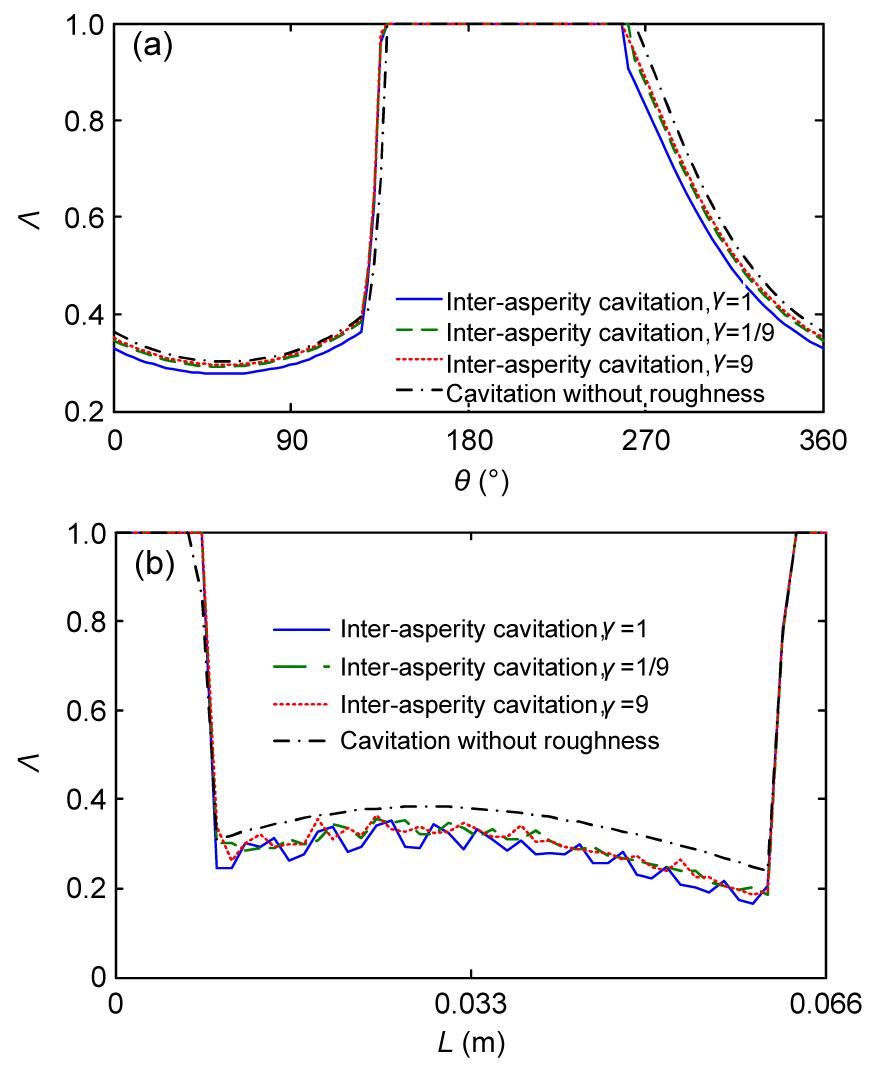
Fig. 13 presents the density of two sections (i=1–m, j=10 and i=30, j=1–50) with the input parameters σ1=1.5 μm, σ2=1.5 μm, ε=0.5, and γ′=0.025°. The results show that the density line is smooth along the circumference direction but waving along width direction, and the waving amplitude and the waving number will increase when the roughness increases. The density will be overestimated using the cavitation model without roughness. Different surface pattern parameter can cause the density to be different. Thus, it is very important to give the realistic surface roughness and surface pattern parameter to predict the density.
Fig.13 Effect of surface pattern parameter on density along circumference direction (a) and width direction (b) when σ1=1.5 μm, σ2=1.5 μm, ε=0.5, and γ′=0.025°
5. Conclusions
An inter-asperity cavitation model is compared with the traditional model and with a cavitation model without surface roughness. Findings are gained from comparison under various operational conditions and tribology parameters. Conclusions can be summarized as follows:
An inter-asperity cavitation model for misalignment journal lubrication problem based on mass-conservative algorithm is established. Compared with the traditional model, MOFP, load capacity, and moment calculated by cavitation model are nearly the same with the traditional model when the surface roughness is small. However, the pressure distribution, oil leakage, and attitude angle calculated by cavitation model are far different from those calculated by the traditional model.
The reason why the oil leakage calculated by the traditional model and cavitation models are quite different and can be concluded that: (1) the maximum velocities of traditional model at the left and right interfaces are −3.5 m/s and 4.5 m/s, respectively, which are smaller in cavitation model; (2) the out flow region of traditional model is also larger; (3) the inflow region appears at the left and right interfaces in cavitation model.
Comparing all the pressure results calculated by cavitation models, the results show that surface roughness has some extent effect on the MOFP and pressure distribution, and shear factor hardly impacts the MOFP and pressure distribution when the surface roughness is small. However, MOFP and pressure distribution calculated with different shear factors will appear greater difference with the increasing of surface roughness, especially at the outlet position of the bearing.
The oil density is not homogenous in the bearing. Smaller density appears at inlet and outlet positions due to the oil film rupture, while the oil density at load bearing region is a constant due to the oil flow compressibility. The results show that: (1) the density is overestimated when the surface roughness is neglected; (2) inter-asperity cavitation model will cause the density to fluctuate along the width direction but smooth along the circumferential direction; with the increasing of surface roughness, the waving amplitude and the waving number will increase; (3) compared with γ=1/9 and γ=9, the density calculated with γ=1 is smaller.
[1] Boedo, S., Booker, J.F., 2004. Classical bearing misalignment and edge loading: a numerical study of limiting cases. Journal of Tribology, 126(3):535-541.
[2] Bouyer, J., Fillon, M., 2002. An experimental analysis of misalignment effects on hydrodynamic plain journal bearing performances. Journal of Tribology, 124(2):313-319.
[3] Bousaid, B., Chaomleffel, J.P., 1987. Influence du mésalignement sur les caractéristiques dynamiques des paliers à lobes. Journal of Theoretical and Applied Mechanics, (in French),6:409-421.
[4] Buckholz, R.H., Lin, J.F., 1986. The effect of journal bearing misalignment on load and cavitation for non-Newtonian lubricants. Journal of Tribology, 108(4):645-654.
[5] Das, S., Guha, S.K., Chattopadhyay, A.K., 2002. On the steady-state performance of misaligned hydrodynamic journal bearings lubricated with micropolar fluids. Tribology International, 35(4):201-210.
[6] Dubois, G.B., Ocvirk, F.W., Wehe, R.L., 1957. Properties of misaligned journal bearing. Transactions of the ASME, 79:1205-1212.
[7] Elrod, H.G., 1981. A cavitation algorithm. Journal of Lubrication Technology, 103(3):350-354.
[8] Etsion, I., Ludwig, L.P., 1982. Observation of pressure varitation in the cavitation region of submerged journal bearings. Journal of Lubrication Technology, 104(2):157-163.
[9] Guha, S.K., 2000. Analysis of steady-state characteristic of misaligned hydrodynamic journal bearing with isotropic roughness effect. Tribology International, 33(1):1-12.
[10] Harp, S.R., 2000. A Computational Method for Evaluating Cavitation Flow between Rough Surfaces. PhD Thesis, Georgia Institute of Technology,Atlanta, USA :
[11] Harp, S.R., Salant, R.F., 2001. An average flow model of rough surface lubrication with inter-asperity cavitation. Journal of Tribology, 123(1):134-143.
[12] Harp, S.R., Salant, R.F., 2002. Inter-asperity cavitation and global cavitation in seals: an average flow analysis. Tribology International, 35(2):113-121.
[13] He, Z.P., Zhang, J.H., Xie, W.S., Li, Z., Zhang, G.C., 2012. Misalignment analysis of journal bearing influenced by asymmetric deflection, based on a simple stepped shaft model. Journal of Zhejiang University-SCIENCE A (Applied Physics & Engineering), 13(9):647-664.
[14] Jakobsson, B., Floberg, L., 1957. The Finite Journal Bearing Considering Vaporization. Technical Report No. 190. Transactions of Chalmers University of Technology,Guthenberg :
[15] Jang, J.Y., Khonsari, M.M., 2010. On the behavior of misaligned journal bearings based on mass-conservative thermo-hydrodynamic analysis. Journal of Tribology, 132(1):011702
[16] McKee, S.A., McKee, T.R., 1957. Pressure distribution in the oil film of journal bearings. Transactions of the ASME, 54:149-165.
[18] Nikolakopoulos, P.G., Papadopoulos, C.A., 1997. Dynamic stability of linear misaligned journal bearings via Lyapunov’s direct method. Tribology transactions, 40(1):138-146.
[19] Nikolakopoulos, P.G., Papadopoulos, C.A., 2008. A study of friction in worn misaligned journal bearings under severe hydrodynamic lubrication. Tribology International, 41(6):461-472.
[20] Patir, N., Cheng, H.S., 1978. An average flow model for determining effects of three-dimensional roughness on partial hydrodynamic lubrication. Journal of Lubrication Technology, 100(1):12-17.
[21] Payvar, P., Salant, R.F., 1992. A computational method for cavitation in a wavy mechanical seal. Journal of Tribology, 114(1):199-204.
[22] Pierre, I., Bouyer, J., Fillon, M., 2002. Thermohydrodynamic Study of Misaligned Plain Journal Bearings- Comparison between Experimental Data and Theoretical Results. , Proceedings of the 2nd World Tribology Congress, 1-4. :1-4.
[23] Pierre, I., Bouyer, J., Fillon, M., 2004. Thermohydrodynamic behavior of misaligned plain journal bearings: theoretical and experimental approaches. STLE Tribology Transactions, 47:594-604.
[25] Sun, J., Gui, C.L., Li, Z.Y., 2005. Influence of journal misalignment caused by shaft deformation under rotational load on performance of journal bearing. Proceedings of Institution Mechanical Engineer, Part J: Journal of Engineering Tribology, 219(4):275-283.
[26] Sun, J., Gui, C.L., Li, Z.Y., 2005. An experimental study of journal bearing lubrication effected by journal misalignment as a result of shaft deformation under load. Journal of Tribology, 127(4):813-819.
[27] Sun, J., Deng, M., Fu, Y.H., Gui, C.L., 2010. Thermohydrodynamic lubrication analysis of misaligned plain journal bearing with rough surface. Journal of Tribology, 132(1):011704
[28] Vijayaraghavan, D., 1989. New Concept in Numerical Prediction of Cavitation in Bearing, PhD Thesis, the University of Toledo,:
[29] Wang, Y.S., Zhang, C., Wang, Q.J., Lin, C., 2002. A mixed-TEHD analysis and experiment of journal bearings under severe operating conditions. Tribology International, 35(6):395-407.
Open peer comments: Debate/Discuss/Question/Opinion


Open peer comments: Debate/Discuss/Question/Opinion
<1>