Affiliation(s):
1.
Department of Civil Engineering, Shanghai Jiao Tong University, Shanghai 200240, China; moreAffiliation(s): 1.
Department of Civil Engineering, Shanghai Jiao Tong University, Shanghai 200240, China; 2.
LUNAM University, Ecole Centrale de Nantes, GeM UMR CNRS 6183, Nantes, France; less
Qi-yin Zhu, Yin-fu Jin, Zhen-yu Yin, Pierre-Yves Hicher. Influence of natural deposition plane orientation on oedometric consolidation behavior of three typical clays from southeast coast of China[J]. Journal of Zhejiang University Science A, 2013, 14(11): 767-777.
@article{title="Influence of natural deposition plane orientation on oedometric consolidation behavior of three typical clays from southeast coast of China", author="Qi-yin Zhu, Yin-fu Jin, Zhen-yu Yin, Pierre-Yves Hicher", journal="Journal of Zhejiang University Science A", volume="14", number="11", pages="767-777", year="2013", publisher="Zhejiang University Press & Springer", doi="10.1631/jzus.A1300156" }
%0 Journal Article %T Influence of natural deposition plane orientation on oedometric consolidation behavior of three typical clays from southeast coast of China %A Qi-yin Zhu %A Yin-fu Jin %A Zhen-yu Yin %A Pierre-Yves Hicher %J Journal of Zhejiang University SCIENCE A %V 14 %N 11 %P 767-777 %@ 1673-565X %D 2013 %I Zhejiang University Press & Springer %DOI 10.1631/jzus.A1300156
TY - JOUR T1 - Influence of natural deposition plane orientation on oedometric consolidation behavior of three typical clays from southeast coast of China A1 - Qi-yin Zhu A1 - Yin-fu Jin A1 - Zhen-yu Yin A1 - Pierre-Yves Hicher J0 - Journal of Zhejiang University Science A VL - 14 IS - 11 SP - 767 EP - 777 %@ 1673-565X Y1 - 2013 PB - Zhejiang University Press & Springer ER - DOI - 10.1631/jzus.A1300156
Abstract: The parameters obtained from oedometric consolidation tests are commonly used in the development of constitutive modeling and for engineering practice. This paper focuses on the influence of the natural deposition plane orientation on oedometric consolidation behavior of three natural clays from the southeast coast of China. Oedometer tests were conducted on intact specimens prepared by sampling at a series of angles relative to the natural deposition plane. For each specimen, yield stress, compressibility indexes, secondary compression, and permeability coefficients were determined. The influence of the sampling angle on these properties was investigated, revealing that yield stress, compression index, swelling index, creep index, ratio of secondary compression coefficient to compression index (Cαe/Cc) and permeability coefficient were all dependent to some extent on the sampling angle. These findings indicate the role of the anisotropy due to the natural deposition on the oedometric consolidation behavior.
Darkslateblue:Affiliate; Royal Blue:Author; Turquoise:Article
Article Content
1. Introduction
Natural clayey deposits are widely distributed in the coastal regions of southeast China. In general, these deposits show diverse ground characteristics due to variations in depositional environment. Moreover, their post-depositional geotechnical characteristics, such as stress history, leaching processes, and variations in excess pore water pressure, are very complex. These natural deposits are usually extremely soft and present considerable problems in civil engineering construction. Thus, the design and construction of projects built on these natural deposits require complete geotechnical knowledge of the natural clays therein to prevent excessive settlement-deformation and associated structural damage (Zhang, 2011). Presently, the parameters used for design and construction are usually determined from laboratory tests on clay samples that have been cut vertically. However, the mechanical behavior of natural clays cut at different angles from the deposition plane can strongly vary (Lade and Kirkgard, 2000; Shen et al., 2008; Yin and Chang, 2009a; 2009b; Yin et al., 2009; Huang and Liu, 2011). Therefore, the present design methods using the parameters measured from vertical clay samples may lack reliability and are likely to generate inaccurate predictions, resulting in engineering problems.
Parameters from oedometric consolidation tests are the most basic parameters commonly used in the development of elastoplastic or viscoplastic models and for engineering practice (Chen et al., 2007; Yin and Hicher, 2008; Li Y.Q. et al., 2008; Wang et al., 2008, 2011; 2012; Li J.Z. et al., 2009; Karstunen and Yin, 2010; Feng, 2010; Yin et al., 2010; 2011; Duan et al., 2012; Wang and Yin, 2012; Yin et al., 2013). For instance, the compression and swelling indexes, the secondary compression coefficient and the permeability are all oedometric properties that may potentially influence decisions prior to initiating civil engineering projects. For this reason, oedometric properties of clays have been widely investigated (e.g., Miao et al., 2008; Zeng et al., 2011; Li et al., 2012). However, these experimental studies have primarily been conducted on clay samples cut vertically, therefore having an angle with the natural deposition plane depending on its in situ orientation, and few have investigated the influence of the sampling angle relative to the natural deposition plane on oedometric parameters of clays.
In this study, we performed oedometer tests carried out on samples of three natural clays from Southeast China coastal regions sampled at various angles relative to the natural deposition plane. The effect of the sampling angle was experimentally quantified, and then used to study the oedometric consolidation behavior of clays, including compression, swelling, creep, and permeability properties. The implications of these findings for construction projects on clay deposits were discussed.
2. Clay samples and test program
2.1. Sampling and physical properties of clays
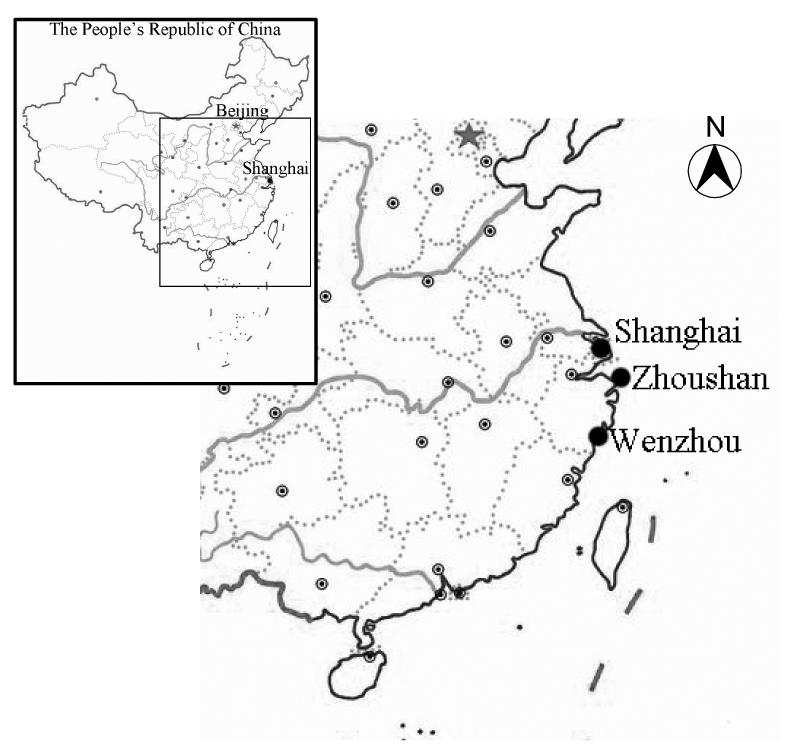
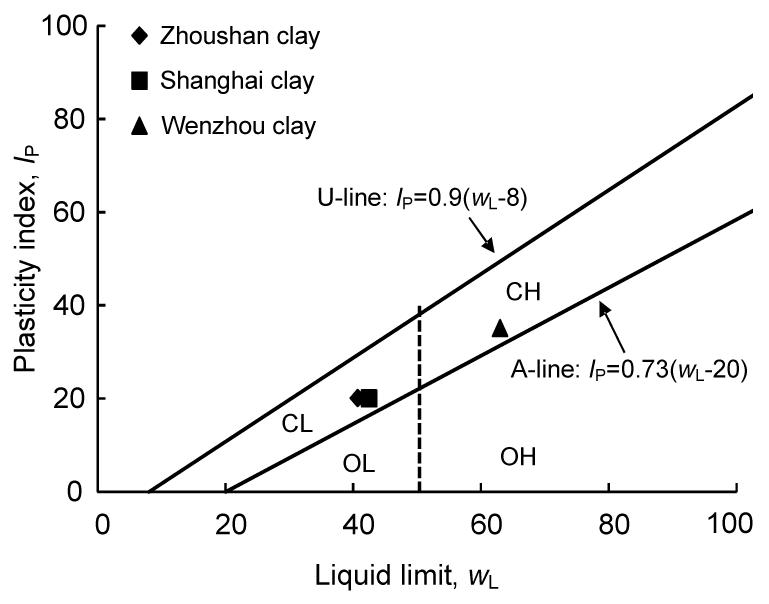
The clay samples, hereafter designated based on their origins, were taken from the Minhang District of Shanghai, Liuheng Island at Zhoushan, and Puzhou at Wenzhou (Fig. 1). Some basic physical properties of the tested clays are summarized in Table 1, indicating significant silt content. Considering the percentages of silt and sand, we can describe Shanghai clay as silt clay and Zhoushan clay as slightly sandy. The Casagrande (1936)’s plasticity chart was used to classify the three clays; all are above the A-line and can therefore be considered as inorganic clays (Fig. 2). Shanghai clay and Zhoushan clay have low plasticity, while Wenzhou clay is high plastic clay.
Fig.1 Sample locations of tested clays
Table 1
Physical properties of tested clays
Clay
Depth, h (m)
Liquid limit, wL
Plasticity index, IP
Initial void ratio, e0
Percentage of clay (%)
Percentage of silt (%)
Percentage of sand (%)
Shanghai
12
42.5
20
1.08
26
72.4
1.6
Zhoushan
11
40.7
20
1.13
37
57.8
5.2
Wenzhou
8
63
35
1.98
44
54.8
1.2
Fig.2 Classification of clays by liquid limit and plasticity index CL: low plastic inorganic clays, sandy, and silty clays; OL: low plastic inorganic or organic silty clays; CH: high plastic inorganic clays; OH: high plastic fine sandy and silty clays
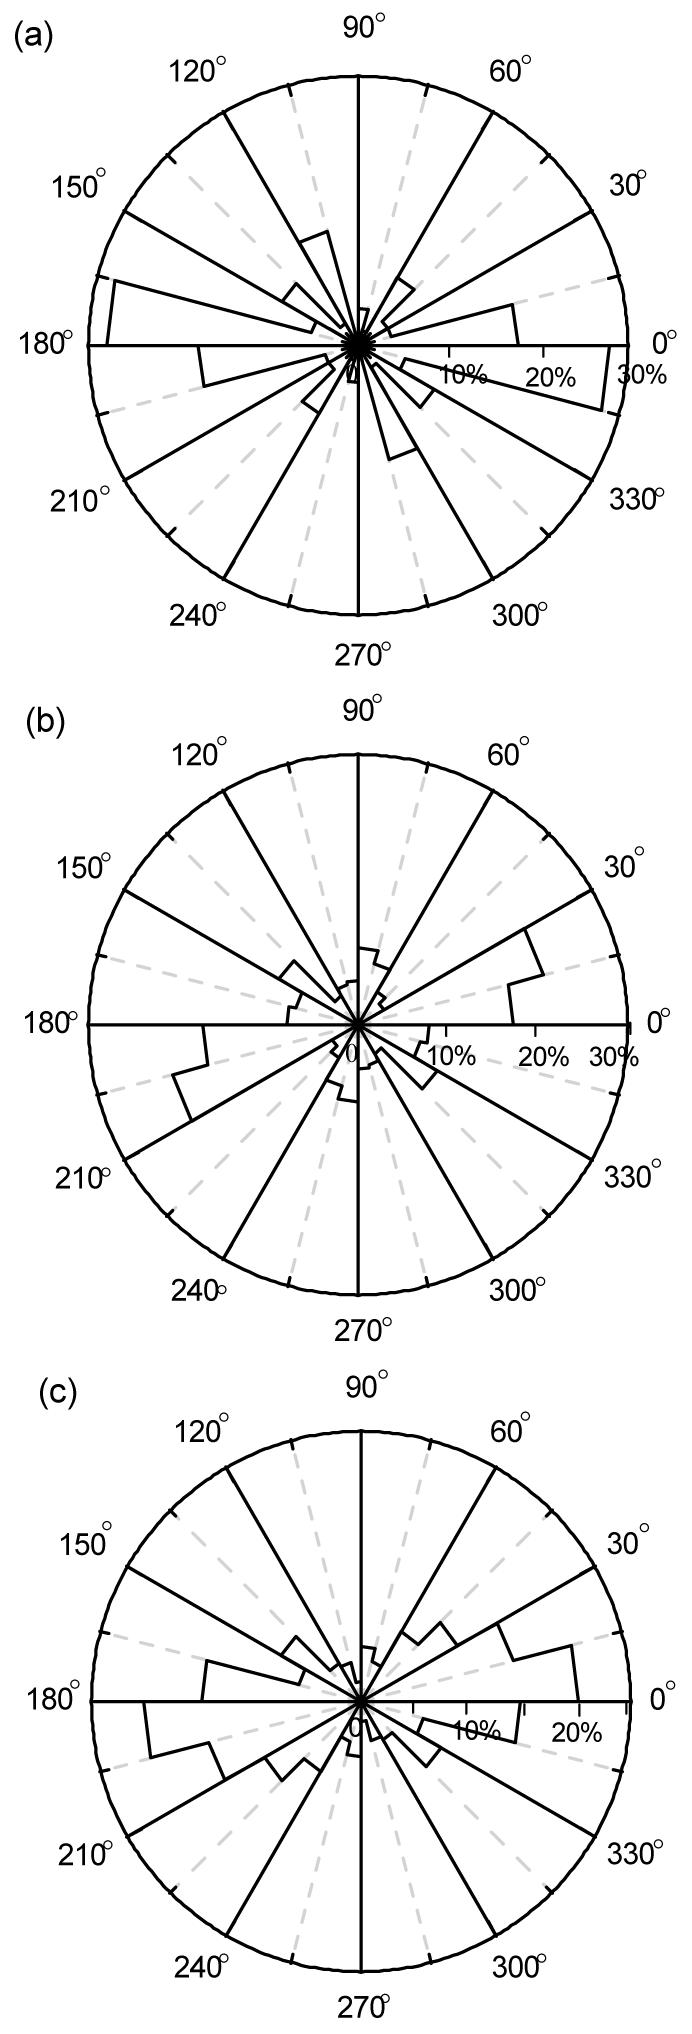
The natural deposition has a significant influence on the anisotropy of clay structures. Fig. 3 shows the photos from scanning electronic microscopy (SEM) of three natural depositions in the vertical direction. These photos show clearly that the particles arrangement of natural clays is anisotropic. Using the software ‘ImageJ’, we analyzed the orientation of the clay particles on the vertical plane. An angular distribution plotted in a rose diagram gives the percentage of the particle surface area as a function of the particle orientation. The rose diagrams indicate a structural anisotropy with a preferential orientation of the particles towards the horizontal direction. A certain number of particles non-uniformly oriented in the 30°–150° quadrants can also be observed (Fig. 4).
Fig.3 SEM photos of natural depositions (on vertical plane): (a) Zhoushan clay; (b) Shanghai clay; (c) Wenzhou clay
Fig.4 Orientation of clay particles for natural depositions on vertical plane: (a) Zhoushan clay; (b) Shanghai clay; (c) Wenzhou clay
2.2. Test program
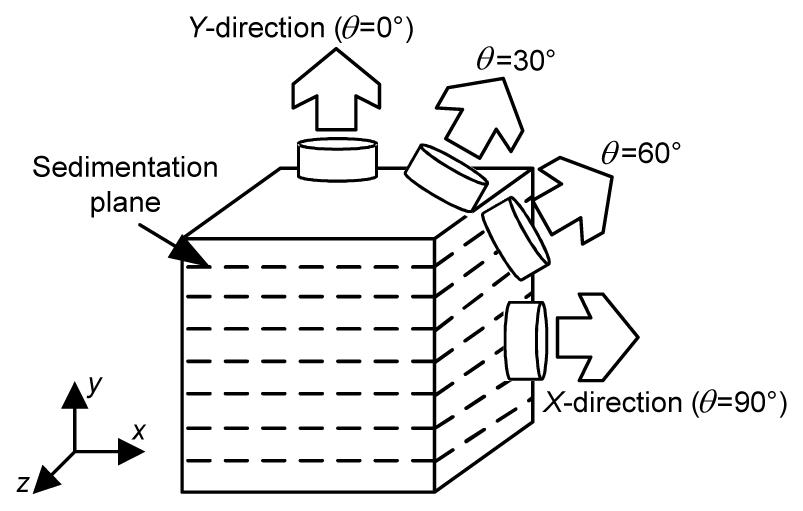
Fig. 5 illustrates a block of natural soil sampled from the field with the drive sampling techniques described by Clayton et al. (1982). The sedimentation, or natural deposition plane of the clay is assumed to mostly coincide with the in situ horizontal plane. To characterize the influence of the sampling angle on the consolidation behavior of clays, specimens prepared for oedometer testing were cut from the soil block at several different angles. The specimens of Zhoushan clay were sampled at angle θ of 0° (i.e., perpendicular to the deposition plane), 30°, 60°, and 90° (i.e., parallel to the deposition plane), while specimens of Shanghai and Wenzhou clays were sampled at θ=0°, 22°, 45°, 68°, and 90°.
Fig.5 Sample block of soil and sampling angle relative to natural deposition plane
Specimens were subjected to conventional oedometer tests according to Chinese Industry Standard (1999). All laboratory tests were conducted in a standard fixed-ring oedometer with 30 cm2 brass rings (diameter d=61.8 mm) and 20 mm in thickness. Each specimen was subjected to successive vertical stresses of 12.5, 25, 50, 100, 200, 400, 800, 200, 50, 12.5, 50, 200, 800, and 1600 kPa, corresponding to a loading stage (12.5 to 800 kPa), an unloading stage (800 to 12.5 kPa) and a reloading stage (12.5 to 1600 kPa). Each stress step lasted 24 h.
3. Experimental results and analysis
3.1. Yield stress
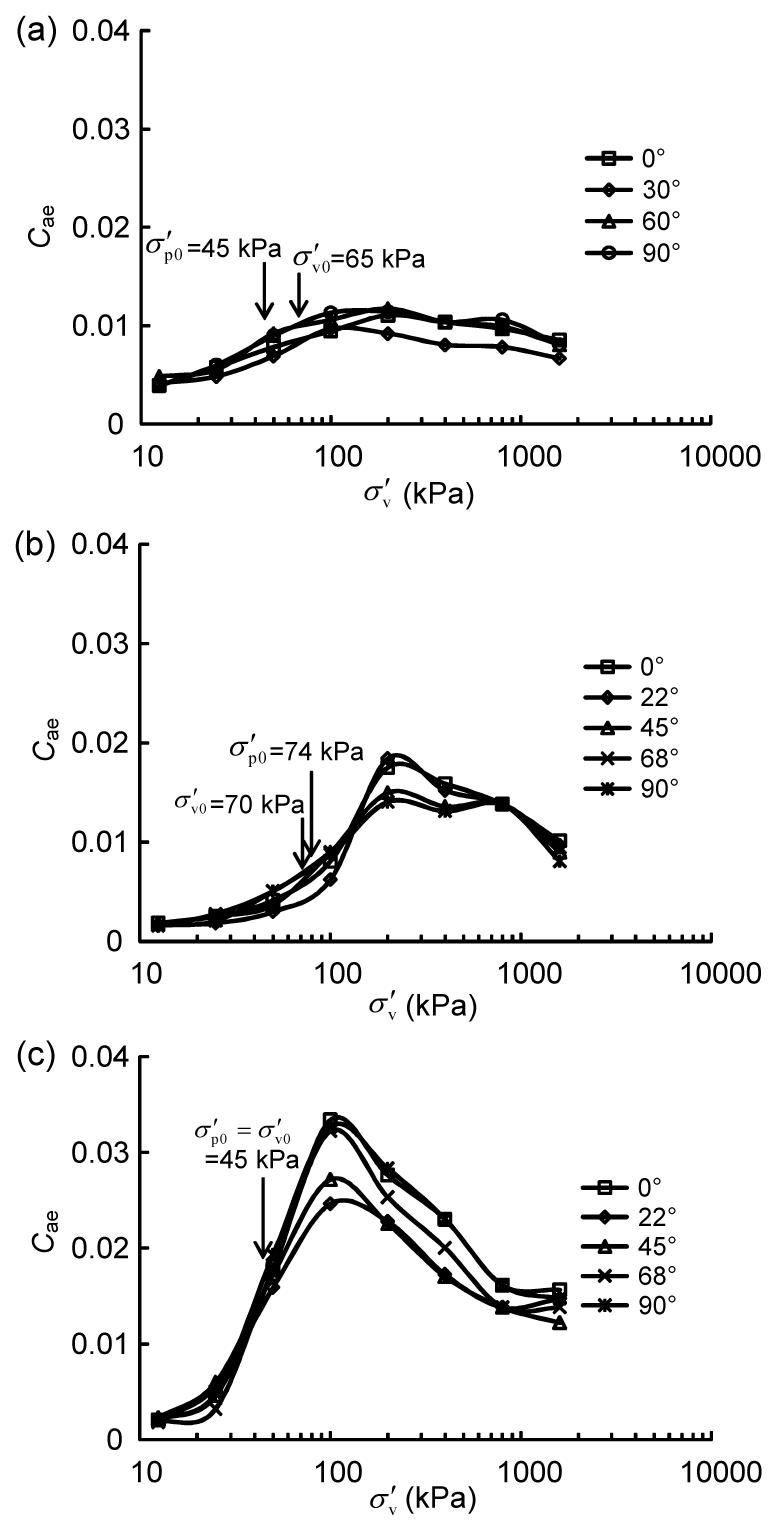
Fig. 6 shows the compression curves (e-logσ′v) of specimens of the three clays with different sampling angles relative to the natural deposition plane. Differences among the four compression curves for Zhoushan clay were observed, with the compression curve of the 0° specimen exhibiting the smallest change in void ratio and the compression curve of the 60° specimen exhibiting the biggest change (Fig. 6a). In contrast, the five compression curves for Shanghai and Wenzhou clay specimens were highly similar, regardless of the sampling angle (Figs. 6b and 6c). Based on these findings, the yield stress (σ′p0) of each specimen was determined using the Casagrande method (Casagrande, 1936). Fig. 6d shows the change in yield stresses of Zhoushan, Shanghai and Wenzhou clays functions relative to the sampling angles. It is clear that, for Shanghai clay, the value of σ′p0 is the biggest for the 0° sample and gradually decreases as the sampling angle increases. The difference between the maximum and minimum values of σ′p0 for Shanghai clay is about 17 kPa. However, for Zhoushan and Wenzhou clays, σ′p0 was not strongly influenced by the sampling angle. Furthermore, comparing the average measured yield stress with the in situ vertical effective stress indicates that Zhoushan clay is underconsolidated, Shanghai clay is slightly overconsolidated (OCR=σ′p0/σ′v0=1.06) and Wenzhou clay is normally consolidated.
Fig.6 Compression curves of samples from (a) Zhoushan clay, (b) Shanghai clay, (c) Wenzhou clay at different deposition planes; (d) yield stress versus sampling angle of the three clays
3.2. Compressibility
The compression (Cc) and swelling (Cs) indexes can be measured from the compression curves (Fig. 6). Cc is measured from the slope of the compression line between 200 and 800 kPa. Fig. 7a shows the change in Cc with the sampling angle for the three clays, along with the correlation coefficients for each linear regression, indicating overall that Cc varies very slightly with the sampling angle. Two values of Cs were measured: Csi related to the slope of the initial compression line between 12.5 and 25 kPa fully induced by the natural clay deposition, and Csr related to the slope of the unloading and recompression lines additionally influenced by the first loading stage. Fig. 7b shows the change in Csi with the sampling angle for the three clays, putting into evidence the relatively large variations of these index values for each clay sample. Fig. 7c indicates that Csr decreases slightly with the sampling angle.
Fig.7 Influence of sampling angle on (a) compression index, (b) swelling index for initial compression and (c) swelling index for unloading and recompression
3.3. Secondary compression
The change in void ratio occurring over one log cycle of time during the secondary compression phase is known as Cαe:
,
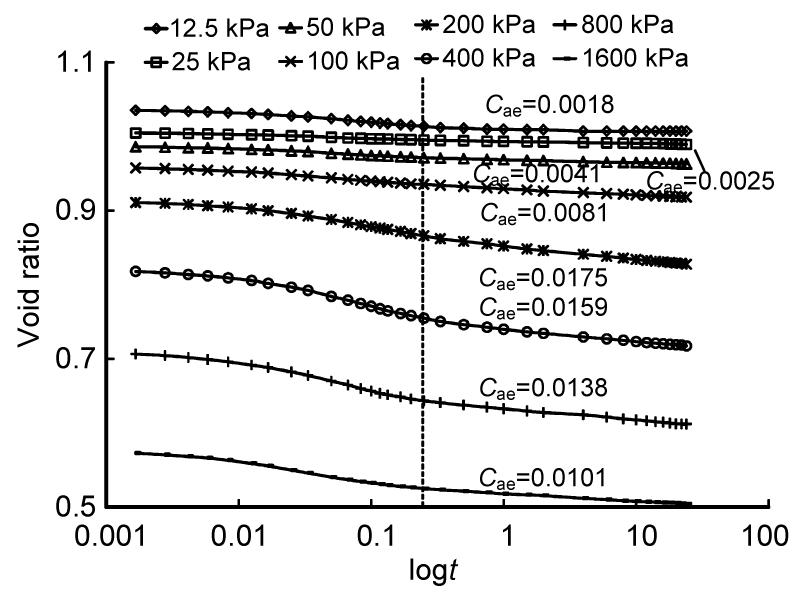
where e is the void ratio and t is the length of time since the end of the primary consolidation. Cαe is often used to assess the long-term deformation of clays, as it can account for the creep rate of soils (Yin et al., 2010). We therefore determined Cαe for a variety of sampling angles for the three clays. Fig. 8 shows an example of Cαe values determined from plots of e vs. logt at each load increment for the 0° specimen of Shanghai clay. The duration of the primary consolidation phase for Shanghai clay was determined to be about 15 min, followed by the secondary consolidation. Based on the evolution of e over time during the secondary consolidation stage, Cαe was calculated for each load increment using Eq. (1). This approach was used to quantify Cαe for all specimens.
Fig.8 Void ratio versus time for each load increment on Shanghai clay (0° specimen)
Fig. 9 shows changes in Cαe for three clays sampled at different angles relative to the deposition plane, based on levels of vertical stress applied. For all three clays, Cαe increases with the increase in the consolidation stress regardless of the sampling angle and reaches a maximum at a stress about twice the preconsolidation pressure; thereafter, Cαe decreases irrespective of clay sample or sampling angle. This observation is consistent with previous studies (Mesri and Godlewski, 1977; Suneel et al., 2008) on various clays in the vertical direction.
Fig.9 Relationship between Cαe and vertical stress for three clays sampled at different angles relative to their deposition planes: (a) Zhoushan clay, (b) Shanghai clay and (c) Wenzhou clay
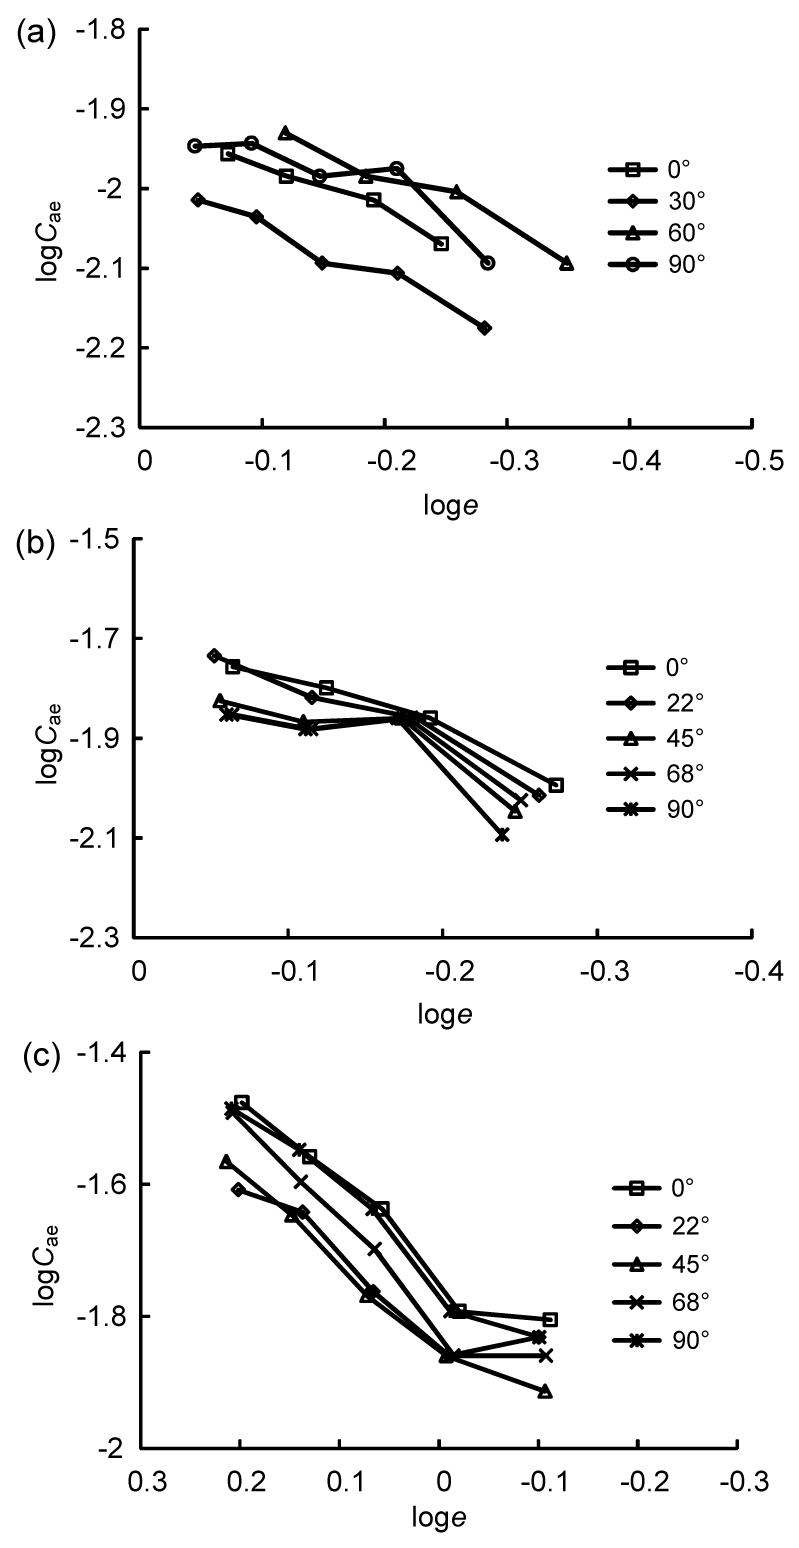
Note that, for each clay, all samples have approximately the same initial void ratio, then the relationship between secondary compression Cαe and vertical stress can also be considered an expression of the relationship between Cαe and void ratio upon completion of the test. We analyzed the relationship between Cαe and the void ratio within the normally consolidated range of the clays, as shown in Fig. 10. Cαe appears to decrease roughly linearly with the void ratio in the double logarithm plane, which is in agreement with the evolution suggested by Yin et al. (2012). Meanwhile, the sampling angle relative to the natural deposition plane has a visible influence on the relationship between Cαe and the void ratio that also depends on the clay. For Zhoushan clay, Cαe is the lowest for the 30° specimen (Fig. 10a). However, for Shanghai clay, Cαe generally decreases with an increase in the sampling angle (Fig. 10b), and Cαe in Wenzhou clay increases with an increase in the sampling angle, apart from the 0° specimen, which has the highest Cαe for this clay (Fig. 10c).
Fig.10 Relationship between Cαe and e in the normally consolidated range for three clays with different sampling angles: (a) Zhoushan clay, (b) Shanghai clay, and (c) Wenzhou clay
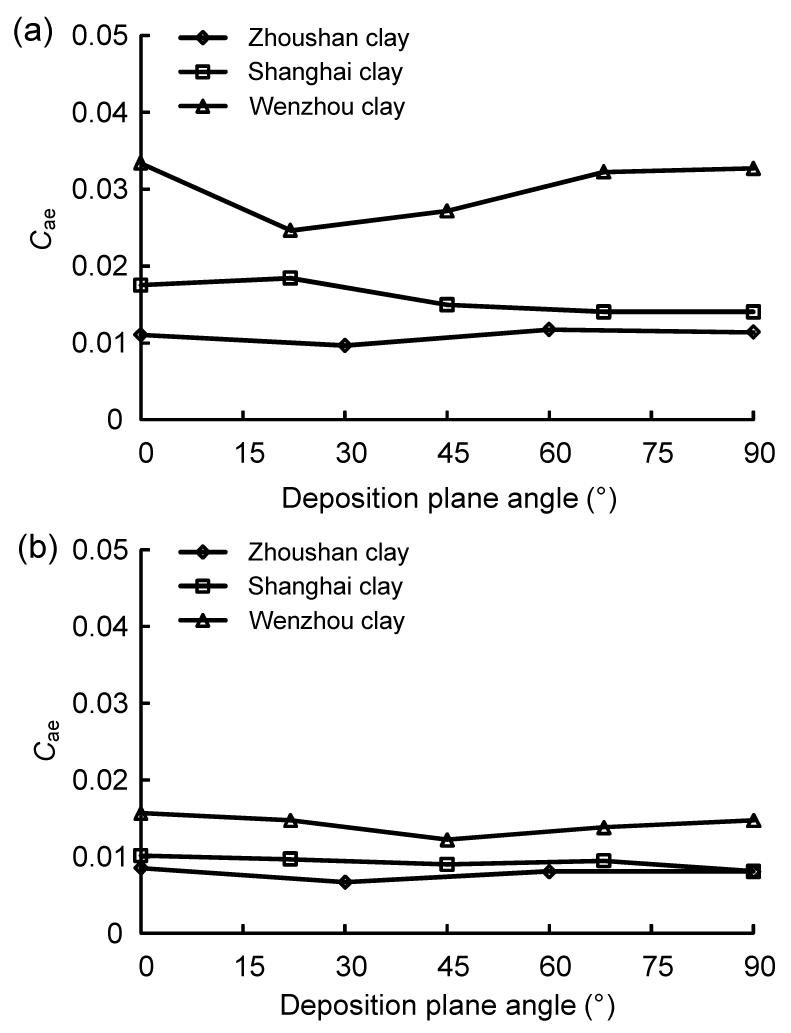
For each clay we selected the maximum value of Cαe and the value of Cαe at the vertical stress of 1600 kPa to represent the creep properties of the natural deposit from which the samples had been taken. Plotting the relationship between the maximum of Cαe and the sampling angle for each of the three clays shows that Cαe varies from 0.024 to 0.033 for the highly plastic Wenzhou clay (Fig. 11a), whereas Cαe has a much smaller range for the low plasticity Shanghai clay (Cαe=0.014–0.018) and Zhoushan clay (Cαe=0.010–0.012). Notably, Cαe corresponding to a vertical stress of 1600 kPa varies slightly with the deposition plane angle, likely because the soil microstructure was modified towards a similar state during loading up to a high stress level (Fig. 11b).
Fig.11 Relationship between Cαe and deposition plane angle for three clays: (a) maximum Cαe; (b) Cαe corresponding to a vertical stress of 1600 kPa
3.4.
Cαe/Cc ratio
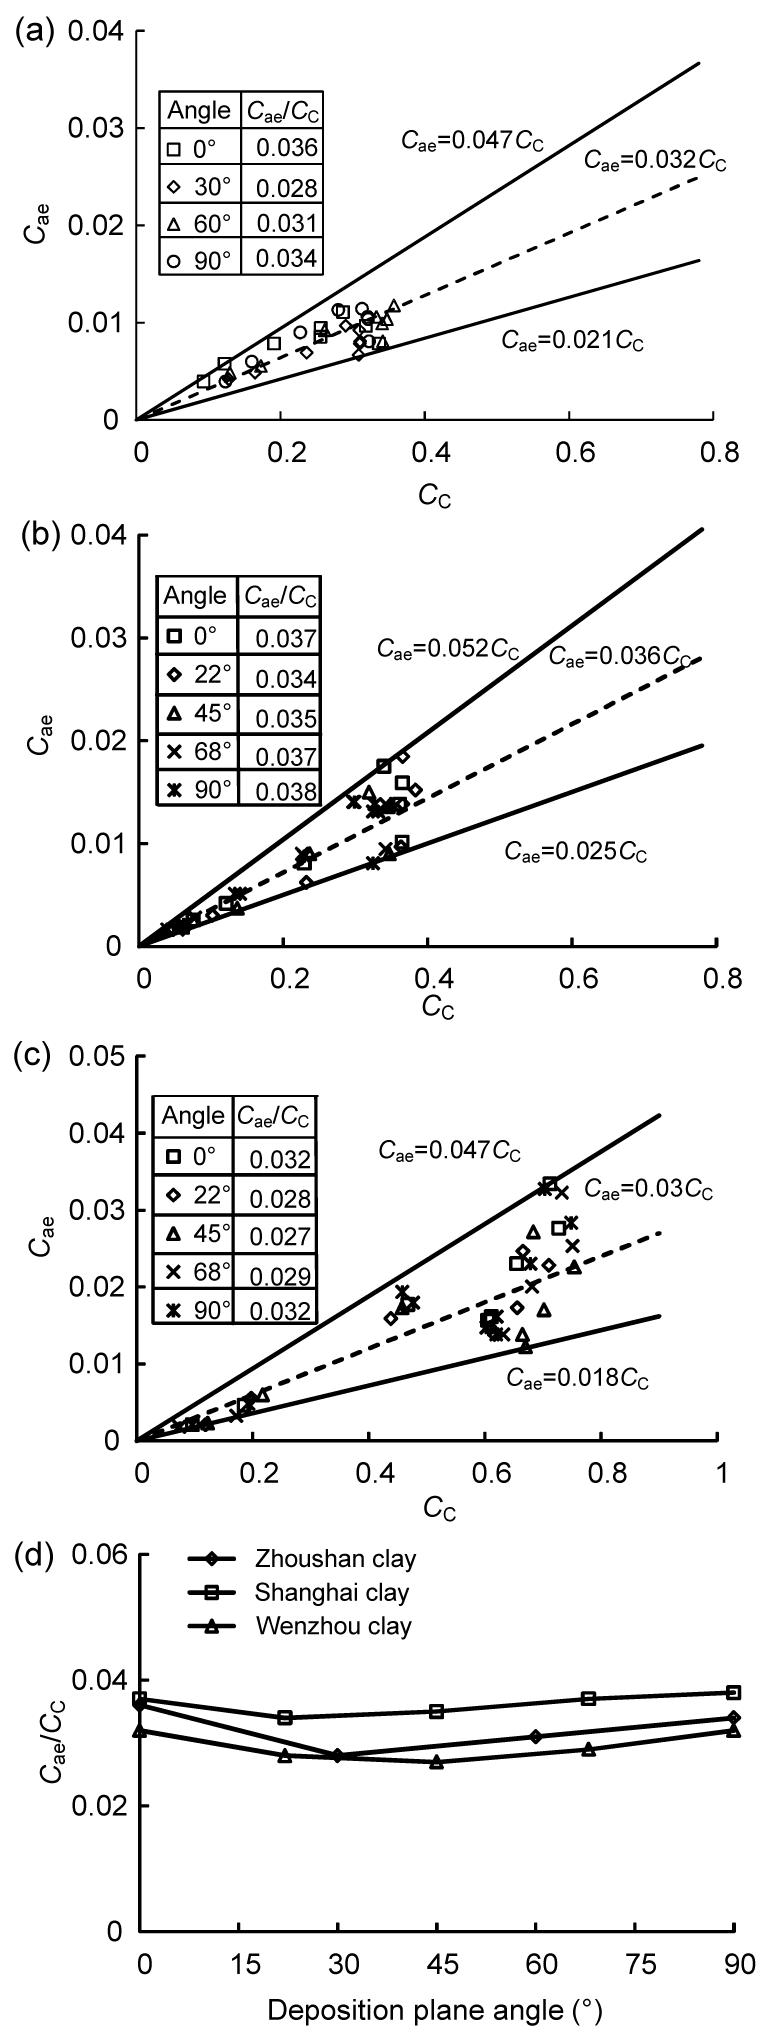
Mesri and Godlewski (1977) summarized previously published Cαe/Cc values for a number of natural soils and found that this ratio ranged overall between 0.025–0.010. Mesri and Castro (1987) concluded that Cαe/Cc=0.04±0.01 for most inorganic clays.
Fig. 12 presents the relationships between Cαe and Cc for all samples of the three clays. The results show that Cαe/Cc ranges between 0.021 and 0.047 for Zhoushan clay with an average value of 0.032 (Fig. 12a), between 0.025 and 0.052 for Shanghai clay with an average value of 0.036 (Fig. 12b), and between 0.018 and 0.047 for Wenzhou Clay with an average value of 0.03 (Fig. 12c). Tables inset within Fig. 12 list the average values of Cαe/Cc for each of the clay sampling angles, and these data were used to plot the change in Cαe/Cc as a function of the sampling angle (Fig. 12d). For the three clays, Cαe/Cc first decreases, then increases as the sampling angle increased, with 0° and 90° samples generating the largest Cαe/Cc.
Fig.12 Relationship between Cαe and Cc for (a) Zhoushan, (b) Shanghai and (c) Wenzhou clays; and (d) average Cαe/Cc versus sampling angle for the three clays
3.5. Permeability
The permeability coefficient k is calculated by
,
where Cv is the coefficient of consolidation, γw is the unit weight of water and mv is the coefficient of volume change. Since Cv and mv varied with the sampling angle relative to the deposition plane, we calculated Cv from strain-time curves using the Terzaghi 1D consolidation theory.
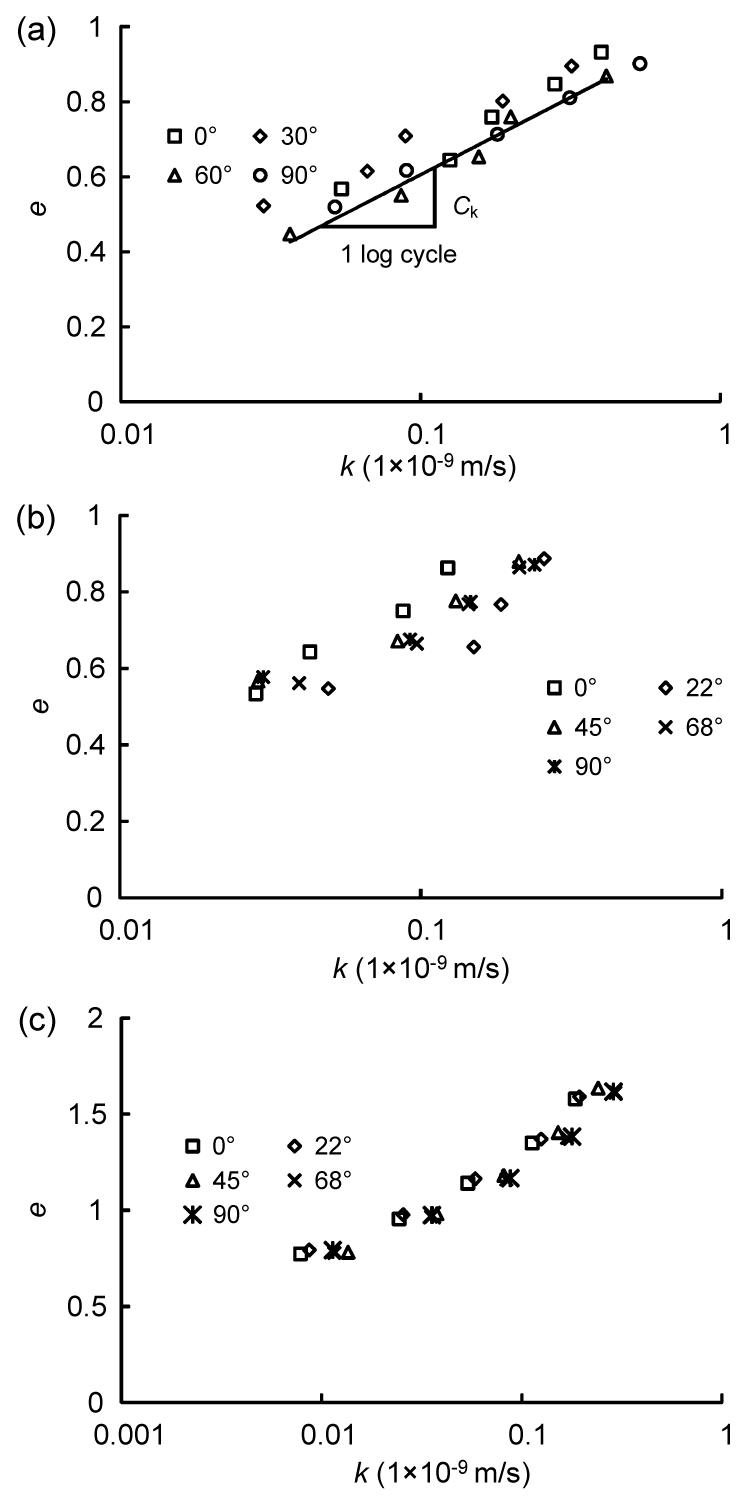
Fig. 13 shows the e-logk relationships for Zhoushan, Shanghai and Wenzhou clays tested at different sampling angles relative to the natural deposition plane. The results show that the permeability coefficient k decreases linearly with the decrease in the void ratio in a logarithmic plane for all specimens.
Fig.13 Evolution of permeability with void ratio for clays from (a) Zhoushan, (b) Shanghai and (c) Wenzhou
The initial permeability k0 and the permeability index Ck are widely used in engineering calculations; hence, their changes in the sampling angle were used to evaluate the effects of the orientation of the natural deposition plane. Eq. (3) proposed by Berry and Poskitt (1972), i.e.,
,
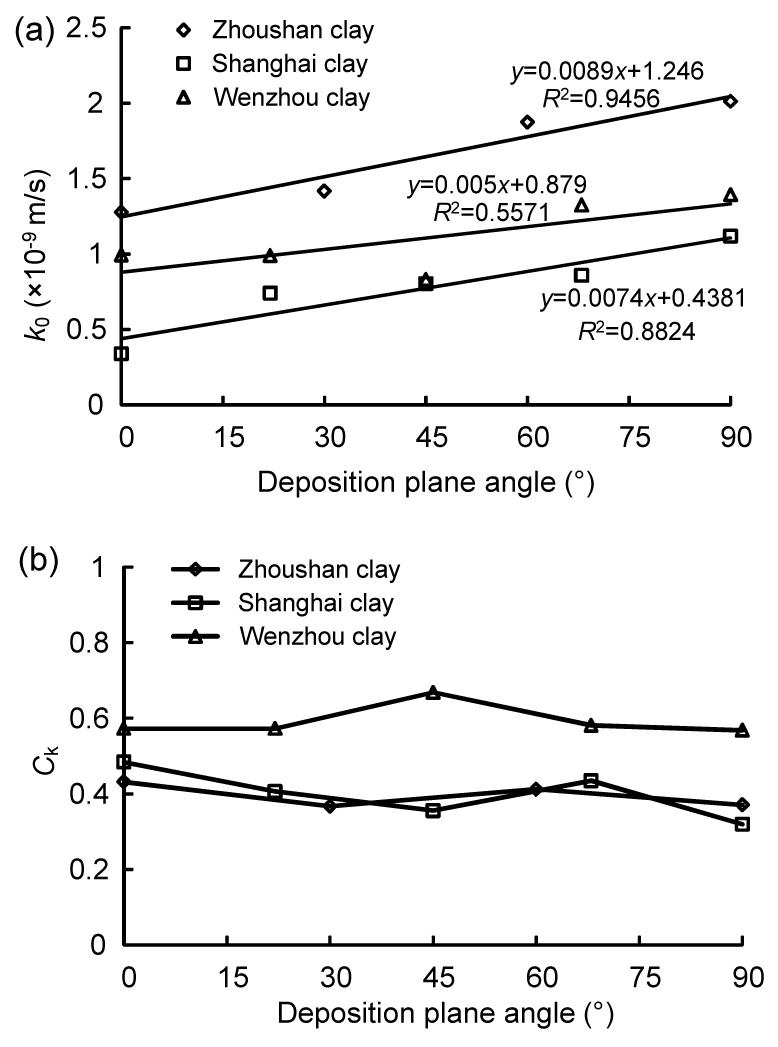
was used to determine the two permeability parameters k0 and Ck based on k, e, and e0. Given the initial void ratio e0 and the linear regression between e and logk for different sampling angles, the corresponding k0 could be calculated. Meanwhile, Ck is the slope of the corresponding regression line, such as that plotted in Fig. 13a. We thereby determined k0 and Ck for all samples. Fig. 14a shows that the sampling angle influences k0 in a positive, linear manner, with regression slope values of 0.0089, 0.0074, and 0.0050 for Zhoushan, Shanghai, and Wenzhou clays, respectively. The k0 value for the vertical samples (0°) is the smallest, and the largest for the horizontal samples (90°) for all three clays. Previous results (O’Kelly, 2006) showed that the ratio of permeability values for horizontal relative to vertical samples is always larger than 1.0, and the present data are consistent with this finding. On the other hand, plotting Ck versus the sampling angle shows no significant influence of the latter on Ck (Fig. 14b).
Fig.14 Relationship between k0 and sampling angle for three clays (a); Relationship between Ck and sampling angle for three clays (b)
4. Discussion
We found that the yield stress of Shanghai clay gradually decreases with the sampling angle, with about 17 kPa difference between the maximum and minimum σ′p0. For Zhoushan and Wenzhou clays, however, σ′p0 does not strongly vary. Furthermore, the highly plastic Wenzhou clay has a large range of Cαe that varies with the sampling angle, while the low plasticity Zhoushan and Shanghai clays have small ranges of Cαe values. Similar phenomena can be found for Csi and Ck. Consequently, we can conclude that the anisotropic behavior is more obvious for clays of highly plasticity.
For isotropic compression, experimental evidence suggests that the initial anisotropy is erased by isotropic loading up to a pressure that is two or three times larger than the preconsolidation pressure (Leoni et al., 2008). If adopting this in an oedometer test, by assuming K0=0.5 (friction angle ϕ=30°), the initial anisotropy will be removed after a vertical stress larger than 1.3 or 2 times preconsolidation pressure and the current conditions can be regarded as yielding. Fig. 11 shows the relationships between the maximum value of Cαe (before yielding) and the value of Cαe at the vertical stress of 1600 kPa (after yielding) and the sampling angle. The significant influence of initial anisotropy of clays before yielding on the anisotropic behavior of Cαe can be observed. As the compression index Cc and swelling index Csr was measured after yielding, and Csi was measured before yielding of clay, Cc and Csr vary slightly with the sampling angle but not Csi as shown in Fig. 7, also demonstrating the rationality of the above observation. In addition, the evolution of initial permeability k0 with the sampling angle for three clays also gives positive supports (Fig. 14).
5. Conclusions
The effect of the orientation of the natural deposition plane on oedometric consolidation behavior of three natural clays from coastal regions of Southeast China was investigated by conducting a series of oedometer tests on specimens prepared by sampling a single clay block at a series of angles relative to the natural deposition plane. Conclusions can be drawn as follows.
The anisotropic behavior is more obvious for clays of highly plasticity. The highly plastic Wenzhou clay has a large range of Cαe that varies with the sampling angle, while the low plasticity Zhoushan and Shanghai clays have small ranges of Cαe values. Similar phenomena can be found for Csi and Ck. The increase in k0 with the sampling angle is smaller for high plasticity Wenzhou clay than for low plasticity Zhoushan and Shanghai clays.
The initial anisotropy of clays before yielding has a significant influence on the anisotropic behavior of clays. The maximum value of Cαe varies very much and the value of Cαe corresponding to a vertical stress of 1600 kPa varies slightly with the deposition plane angle for all three clays. The compression index Cc and swelling index Csr were found to vary slightly with the sampling angle, but not Csi. The initial permeability k0 depends much on the sampling angle for the three clays which are relevant to the initial anisotropy of clays.
The results of this study clearly show the anisotropic oedometric consolidation behavior of natural clays. It is meaningful to determine the anisotropic parameters associated with oedometric consolidation and use them for engineering designs and projects on clays. The perspectives of this study are now to relate these behaviors at the specimen size to microstructural analyses in order to better understand the physical origins of the material anisotropy.
[1] Berry, P.L., Poskitt, T.J., 1972. The consolidation of peat. Gotechnique, 22(1):27-52.
[2] Chen, Y.M., Tang, X.W., Jia, N., 2007. Consolidation of sensitive clay with vertical drain. International Journal for Numerical and Analytical Methods in Geomechanics, 31(15):1695-1713.
[3] Casagrande, A., 1936. The Determination of the Pre-consolidation Load and Its Practical Significance. , Proceedings of 1st International Conference Soil Mechanics and Foundation Engineering, 60-64. :60-64.
[4] Chinese Industry Standard, 1999. SL237-1999, Specification of Soil Test, The Ministry of Water Resources of the Peoples Republic of China,:
[6] Duan, Y.Y., Zhang, Y.P., Chan, D., Yu, Y.N., 2012. Theoretical elastoplastic analysis for foundations with geosyntheticencased columns. Journal of Zhejiang Universit-SCIENCE A (Applied Physics & Engineering), 13(7):506-518.
[7] Feng, T.W., 2010. Some observations on the oedometric consolidation strain rate behaviors of saturated clay. Journal of Geoengineering, 5(1):1-7.
[8] Huang, M.S., Liu, Y.H., 2011. Simulation of yield characteristics and principal stress rotation effects of natural soft clay. Chinese Journal of Geotechnical Engineering, (in Chinese),33(11):1167-1175.
[9] Karstunen, M., Yin, Z.Y., 2010. Modelling time-dependent behaviour of Murro test embankment. Gotechnique, 60(10):735-749.
[10] Lade, P.V., Kirkgard, M.M., 2000. Effects of stress rotation and changes of b-values on cross-anisotropic behaviour of natural, K0-consolidated soft clay. Soils and Foundations, 40(6):93-105.
[11] Leoni, M., Karstunen, M., Vermeer, P.A., 2008. Anisotropic creep model for soft soils. Gotechnique, 58(3):215-226.
[12] Li, J.Z., Peng, F.L., Xu, L.S., 2009. One-dimensional viscous behavior of clay and its constitutive modeling. International Journal of Geomechanics, 9(2):43-51.
[13] Li, Q., Ng, C.W.W., Liu, G.B., 2012. Low secondary compressibility and shear strength of Shanghai Clay. Journal of Central South University, 19(8):2323-2332.
[14] Li, Y.Q., Zhou, J., Xie, K.H., 2008. Environmental effects induced by excavation. Journal of Zhejiang Universit-SCIENCE A, 9(1):50-57.
[15] Mesri, G., Godlewski, P.M., 1977. Time and stress-compressibility interrelationship. Journal of the Geotechnical Engineering Division, 103(5):417-430.
[16] Mesri, G., Castro, A., 1987.
Cα/Cc concept and K0 during secondary compression. Journal of Geotechnical Engineering, 113(3):230-247.
[18] OKelly, B.C., 2006. Compression and consolidation anisotropy of some soft soils. Geotechnical and Geological Engineering, 24(6):1715-1728.
[19] Shen, Y., Zhou, J., Gong, X.N., 2008. Study on Strength Criterion of Intact Soft Clay after Monotonic Principal Stress Rotation. Geotechnical Engineering for Disaster Mitigation and Rehabilitation. Springer Berlin Heidelberg,Berlin :892-898.
[20] Suneel, M., Park, L.K., Im, J.C., 2008. Compressibility characteristics of Korean marine clay. Marine Georesources & Geotechnology, 26(2):111-127.
[21] Wang, L.Z., Yin, Z.Y., 2012. Stress-dilatancy of natural soft clay under undrained creep condition. International Journal of Geomechanics, in press,:
[22] Wang, L.Z., Shen, K.L., Ye, S.H., 2008. Undrained shear strength of K0 consolidated soft soils. International Journal of Geomechanics, 8(2):105-113.
[23] Wang, L.Z., Wang, Z., Li, L.L., Wang, J.C., 2011. Construction behavior simulation of a hydraulic tunnel during standpipe lifting. Tunnelling and Underground Space Technology, 26(6):674-685.
[24] Wang, L.Z., Dan, H.B., Li, L.L., 2012. Modeling strain-rate dependent behavior of KR0-consolidated soft clays. Journal of Engineering Mechanics, 138(7):738-748.
[25] Yin, Z.Y., Hicher, P.Y., 2008. Identifying parameters controlling soil delayed behaviour from laboratory and in situ pressuremeter testing. International Journal for Numerical and Analytical Methods in Geomechanics, 32(12):1515-1535.
[26] Yin, Z.Y., Chang, C.S., 2009. Microstructural modelling of stress-dependent behaviour of clay. International Journal of Solids and Structures, 46(6):1373-1388.
[27] Yin, Z.Y., Chang, C.S., 2009. Non-uniqueness of critical state line in compression and extension conditions. International Journal for Numerical and Analytical Methods in Geomechanics, 33(10):1315-1338.
[28] Yin, Z.Y., Chang, C.S., Hicher, P.Y., Karstunen, M., 2009. Micromechanical analysis of kinematic hardening in natural clay. International Journal of Plasticity, 25(8):1413-1435.
[29] Yin, Z.Y., Chang, C.S., Karstunen, M., Hicher, P.Y., 2010. An anisotropic elastic-viscoplastic model for soft clays. International Journal of Solids and Structures, 47(5):665-677.
[30] Yin, Z.Y., Hattab, M., Hicher, P.Y., 2011. Multiscale modeling of a sensitive marine clay. International Journal for Numerical and Analytical Methods in Geomechanics, 35(15):1682-1702.
[31] Yin, Z.Y., Xu, Q., Yu, C., 2013. Elastic viscoplastic modeling for natural soft clays considering nonlinear creep. International Journal of Geomechanics, in press,:
[32] Zeng, L.L., Hong, Z.S., Cai, Y.Q., Han, J., 2011. Change of hydraulic conductivity during compression of undisturbed and remolded clays. Applied Clay Science, 51(1-2):86-93.
[33] Zhang, Z.M., 2011. Achievements and problems of geotechnical engineering investigation in China. Journal of Zhejiang University-SCIENCE A (Applied Physics & Engineering), 12(2):87-102.
Open peer comments: Debate/Discuss/Question/Opinion


Open peer comments: Debate/Discuss/Question/Opinion
<1>