Affiliation(s):
1.
Department of Materials Science and Engineering, Zhejiang University, Hangzhou 310027, China; moreAffiliation(s): 1.
Department of Materials Science and Engineering, Zhejiang University, Hangzhou 310027, China; 2.
China Railway Construction Electrification Bureau Group Co., Ltd., Beijing 100036, China; 3.
College of Electrical Engineering, Zhejiang University, Hangzhou 310027, China; less
Xiao-pei Lu, Da-wei Yao, Yi Chen, Li-tian Wang, An-ping Dong, Liang Meng, Jia-bin Liu. Microstructure and hardness of Cu-12% Fe composite at different drawing strains[J]. Journal of Zhejiang University Science A, 2014, 15(2): 149-156.
@article{title="Microstructure and hardness of Cu-12% Fe composite at different drawing strains", author="Xiao-pei Lu, Da-wei Yao, Yi Chen, Li-tian Wang, An-ping Dong, Liang Meng, Jia-bin Liu", journal="Journal of Zhejiang University Science A", volume="15", number="2", pages="149-156", year="2014", publisher="Zhejiang University Press & Springer", doi="10.1631/jzus.A1300164" }
%0 Journal Article %T Microstructure and hardness of Cu-12% Fe composite at different drawing strains %A Xiao-pei Lu %A Da-wei Yao %A Yi Chen %A Li-tian Wang %A An-ping Dong %A Liang Meng %A Jia-bin Liu %J Journal of Zhejiang University SCIENCE A %V 15 %N 2 %P 149-156 %@ 1673-565X %D 2014 %I Zhejiang University Press & Springer %DOI 10.1631/jzus.A1300164
TY - JOUR T1 - Microstructure and hardness of Cu-12% Fe composite at different drawing strains A1 - Xiao-pei Lu A1 - Da-wei Yao A1 - Yi Chen A1 - Li-tian Wang A1 - An-ping Dong A1 - Liang Meng A1 - Jia-bin Liu J0 - Journal of Zhejiang University Science A VL - 15 IS - 2 SP - 149 EP - 156 %@ 1673-565X Y1 - 2014 PB - Zhejiang University Press & Springer ER - DOI - 10.1631/jzus.A1300164
Abstract: Cu-12% Fe (in weight) composite was prepared by casting, pretreating, and cold drawing. The microstructure was observed and Vickers hardness was measured for the composite at various drawing strains. Cu and Fe grains could evolve into aligned filaments during the drawing process. X-ray diffraction (XRD) was used to analyze the orientation evolution during the drawing process. The axial direction of the filamentary structure has different preferred orientations from the radial directions. The strain of Fe grains linearly increases with an increase in the drawing strain up to 6.0, and deviates from the linear relation when the drawing strain is higher than 6.0. With an increase in the drawing strain, the microstructure scales of Fe filaments exponentially decrease. The density of the interface between Cu and Fe phases exponentially increases with an increase in the aspect ratio of Fe filaments. There is a similar Hall-Petch relationship between the hardness and Fe filament spacing. The refined microstructure from drawing deformation at drawing strains lower than 3.0 can induce a more significant hardening effect than that at drawing strains higher than 3.0.
Darkslateblue:Affiliate; Royal Blue:Author; Turquoise:Article
Article Content
1. Introduction
Some Cu-based in situ composites, such as Cu-Fe, Cu-Nb, and Cu-Cr, containing body-centered cubic (bcc) filaments have attracted considerable attention because of their strong mechanical properties and electrical conductivity (Jin et al., 1997; Hong and Hill, 2001; Gao et al., 2005; 2007; Wu et al., 2009a). The filamentary composite structure in those alloys was produced generally by heavily drawing the as-cast double-phase structure and showed that the practical strength was much higher than that predicted by the linear rule of mixtures (Funkenbusch and Courtney, 1985; Go and Spitzig, 1991; Biselli and Morris, 1994; Biselli and Morris, 1996; Sauvage et al., 2005).
In these in situ composites, the Cu-Fe system has attracted particular attention because of the relatively low cost of the Fe constituent (Jeong et al., 2009; Qu et al., 2011; Morris and Muñoz-Morris, 2011). Cu-Fe alloy could produce a high deformation without breakage during drawing strain at room temperature because of the excellent plasticity of Fe and Cu phases (Funkenbusch and Courtney, 1981). During the deformation of Cu-Fe alloys, the Cu matrix mainly presented a <111> texture and the Fe phase mainly a <110> texture (Brokmeier et al., 2000). The Cu matrix and Fe phase evolved into ribbon-like filaments and the filamentary scale decreased with an increase in the deformation degree (Biselli and Morris, 1994; 1996). The fine microstructure of Cu-Fe composite can benefit the mechanical properties since the high density of the phase boundary can effectively provide a strengthening benefit (Stepanov et al., 2013). Cu-Fe composite with fine microstructure produced from rapid solidification and heavy drawing deformation results in higher strength than that predicted by the rule of mixture averages (Biselli and Morris, 1994; He et al., 2000). The mechanical properties depend obviously on the filamentary spacing in the drawn microstructure. For example, the strength of Cu-20% Fe in situ composites increased with the reduction in the spacing between Fe filaments and obeyed a Hall-Petch relationship (Go and Spitzig, 1991).
In this study, Cu-12% Fe (in weight) in situ filamentary composite was prepared by casting, pretreating, and cold drawing to different strain levels. The microstructure evolution was observed and the Vickers hardness was determined. The relationship between the preferred orientation and the drawing strain was investigated. The effect of the Fe filament spacing on the hardness at different drawing strains was discussed.
2. Materials and methods
Cu-12% Fe alloy was melted in a vacuum induction furnace and cast into a copper mould in a 1.0×10⁴ Pa Ar shielded atmosphere to obtain cylindrical ingots of 21.0 mm in diameter. The inner and outer diameters of the copper mould were 21.0 mm and 60.0 mm, respectively. Electrolytic Cu with 99.99% purity and master alloy of Cu-50% Fe were used as starting materials. To promote the precipitation of secondary Fe particles, the as-cast ingots were pretreated at 1000 °C for 1 h, quenched in water and then aged at 550 °C for 4 h. The surface layer about 1.0 mm in thickness was turned off to remove the surface oxides and defects. The ingots were heavily drawn into fine wires by multiple drawing performed at ambient temperature with a straight wire drawing machine (LZ100, Hangzhou Drawing Factory, China), which has a power of 5 kW and a working length of 6.5 m. The level of drawing reduction was evaluated by η=ln(A0/A) and referred to as the drawing strain, where A0 and A are the original and final transverse section areas of the drawing specimens, respectively. The drawing reduction in per pass was Δη<0.2 and wires with about 50 mm in length were cut as test specimens at η=1.0, 2.0, 3.0, 4.0, 5.0, 6.0, 7.0, 8.0, and 8.6. The total drawing reduction was η=8.6 while the final length of the wire reached about 6 m.
The microstructure was observed by scanning electron microscopy (SEM) (Hitachi S4800, Japan). The measured values of average width, thickness, and spacing of Fe grains at different drawing strains were taken from the arithmetical averages at least 50 measured points on the transverse section of the specimens. The average length of the interface between Cu and Fe phases per unit area was also measured from the microstructure on the transverse section of the specimens. The phase structure was identified by X-ray diffraction (XRD) using Cu-Kα radiation from 30° to 100°. The operating voltage and current were 40 kV and 100 mA, respectively. The hardness was determined on the polished transverse section of the specimens using a Vickers hardness tester (MH-5, Laizhou Weiyi Experiment Machine Manufacturing Co., Ltd, China) with a load of 100 g and a dwell time of 15 s. Each value was taken from the arithmetical mean measured from more than ten indentations.
3. Results
3.1. Microstructure
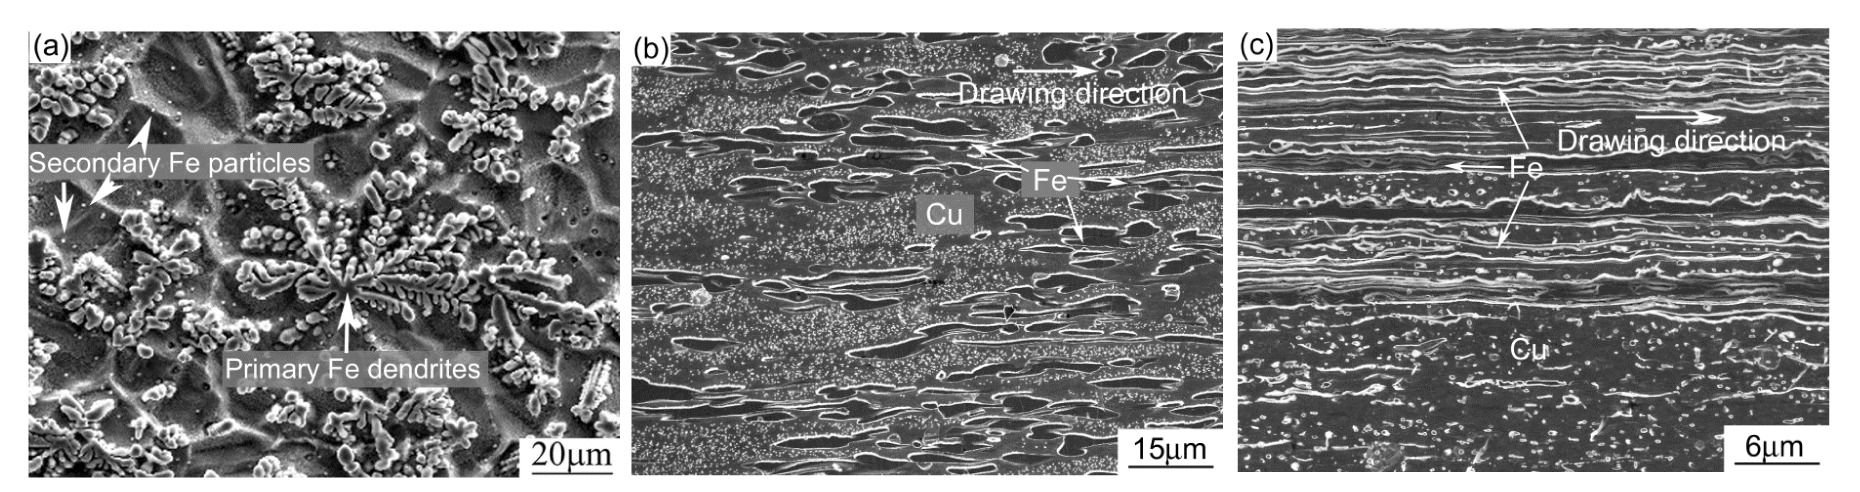
Fig. 1a shows the microstructure of pretreated Cu-12% Fe. Coarse primary Fe dendrites and some secondary Fe particles are observed in the pretreated alloy. Both Cu and Fe phases are elongated along the drawing direction during cold drawing. The Fe phase evolves into pencils at small drawing strains and even into nano-fibers at high drawing strains on the longitudinal section (Figs. 1b and 1c). The length of the Fe filaments continuously increases and the interval of the Fe filaments decreases with the increase in the drawing strains.
Fig.1 Microstructure of Cu-12% Fe Pretreated (a), and at η=1.5 (b) and η=5.0 (c) in the longitudinal section
Fig. 2 shows the microstructure on the transverse section of Cu-12% Fe at different drawing strains. Fe dendrites are curled into a ribbon-like morphology, which is the result of co-deformation between Fe and Cu phases. It has been well documented that the bcc phase is forced to curl and fold due to the constraint of the surrounding face-centered cubic matrix which is able to accommodate axially symmetric flow (Bevk et al., 1978). The ribbon-like morphology has been widely observed in Cu-Fe and Cu-Nb alloys (Bevk et al., 1978; Raabe et al., 2009; Wu et al., 2009b). Increasing the drawing strain to η=7.0 produces a more uniform dense distribution of Fe ribbons in the Cu matrix.
Fig.2 Microstructure on the transverse section of the Cu-12% Fe (a) η=5.0 and (b) η=7.0, and (c) schematic illustration of the measurement of thickness (t), width (w), and spacing (λ) of Fe ribbons
The thickness (t), width (w), and spacing (λ) of Fe ribbons could be measured on the SEM images, as schematically shown in Fig. 2c. The change in the average thickness, width, and spacing of Fe ribbons with various drawing strains are given in Fig. 3. These values decrease with an increase in the drawing strain. In particular, the reduction in the spacing is more obvious than that in the ribbon width or thickness of Fe ribbons. Some exponential relationships between the microstructure scale and drawing strain can be fitted from the obtained data as
,
,
.
Fig.3 Dependence of the average thickness (t), width (w), and spacing (λ) of Fe ribbons on the drawing strain for Cu-12% Fe
3.2. Structure orientation
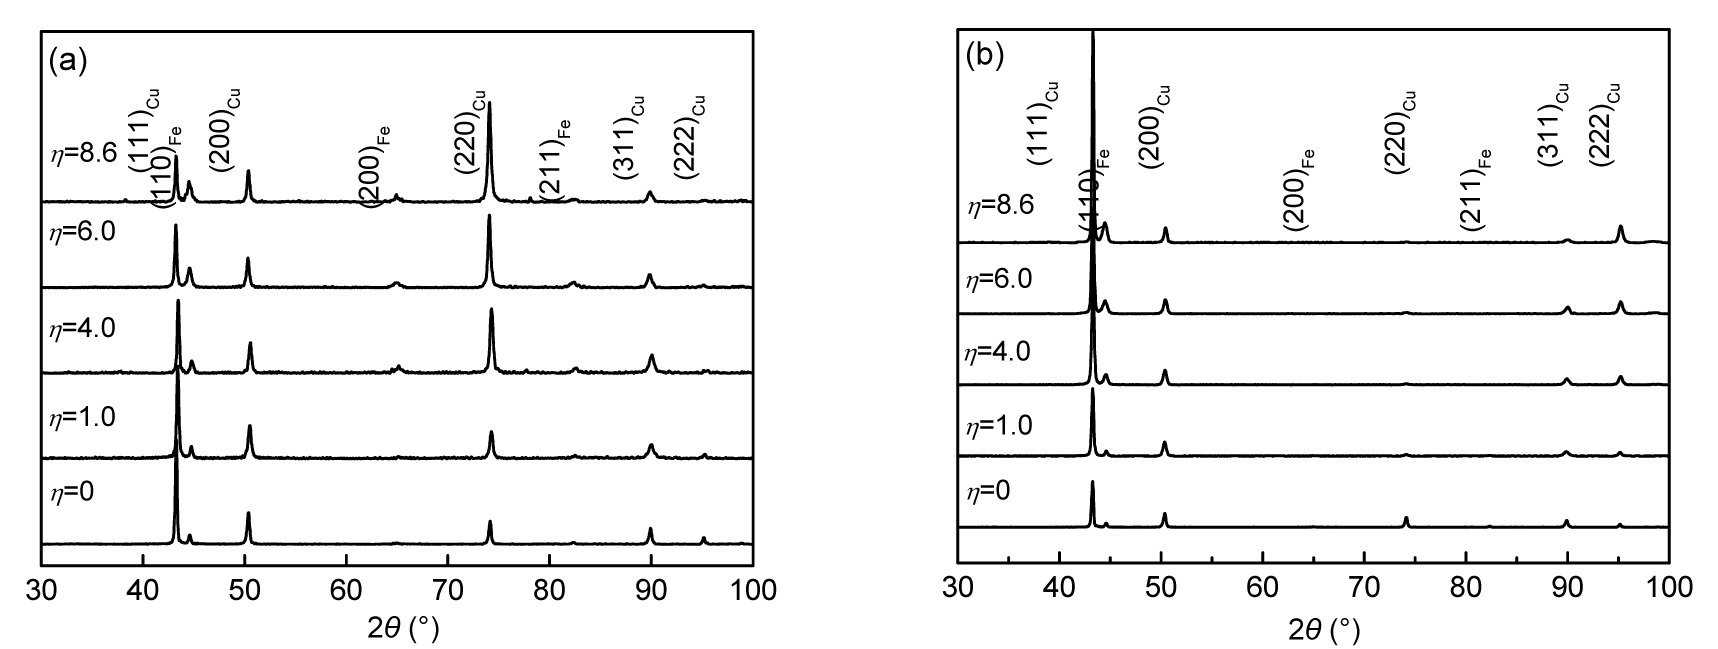
Fig. 4 shows the XRD patterns of Cu-12% Fe at different drawing strains. The intensities of (hkl) diffractions are given in Table 1. The alloy consists of Cu and α-Fe phases but the relative intensity between different diffraction peaks changes with the drawing strain. For example, from the detection on the longitudinal section, the intensity of (111)Cu is higher than that of (220)Cu at lower drawing strains but the intensity of (111)Cu becomes lower than that of (220)Cu at higher drawing strains. From the detection on the transverse section, the intensities of (111)Cu and (110)Fe increase with the drawing strain but that of (220)Cu almost disappears at high drawing strains. These results imply that the drawing deformation results in a change in crystal preferred orientation or texture distribution.
Fig.4 XRD patterns Longitudinal section (a) and transverse section (b) of Cu-12% Fe at different drawing strains
Table 1
Related XRD data and experimental counts to Ij, Ij0, and P(hkl) on the longitudinal section of the specimens
η
Intensity of related (hkl) diffractions (counts per second)
P(hkl)
(111)Cu
(110)Fe
(200)Cu
(220)Cu
(200)Fe
(311)Cu
Ij0
(111)Cu
(110)Fe
(200)Cu
(220)Cu
(200)Fe
(311)Cu
0
12 209.4
460.5
3532.8
104.1
2685.6
1879.5
21 786.0
0.56
0.02
0.16
0.005
0.12
0.04
1.0
14 590.0
11 450.5
13 287.5
10 088.0
11 933.5
11 563.0
79 199.5
0.18
1.24
0.17
0.13
0.15
0.13
4.0
21 847.8
21 400.5
22 225.2
20 448.6
27 003.1
21 768.4
153 711.3
0.14
0.14
0.14
0.14
0.18
0.14
6.0
36 452.4
31 444.2
32 509.2
30 295.2
38 502.6
31 468.2
224 973.6
0.16
0.16
0.17
0.16
0.17
0.14
8.6
45 290.0
460.5
43 422.0
40 279.0
51 686.0
41 244.0
257 678.5
0.18
0.02
0.17
0.16
0.20
0.16
The degree of preferred orientation in the alloy can be described by the Lotgering factor (Lotgering, 1959)
,
where
,
,
where I(hkl) and I0(hkl) are the intensities of (hkl) diffraction in the deformed and undeformed speci-mens, and Ij and Ij0 are the intensities of any diffractions in the deformed and undeformed specimens, respectively. It is obvious that there should be a random orientation of (hkl) if L(hkl)=0 or there should be a perfect preferred orientation of (hkl) if L(hkl)=1. In general, the presented probability of the preferred orientation of (hkl) must decrease with the reduction in L(hkl). Based on Eqs. (4)–(6) and the experimental XRD data, related experimental counts to Ij, Ij0, and P(hkl) are given in Table 1 and Table 2.
Table 2
Related XRD data and experimental counts to Ij, Ij0, and P(hkl) on the transverse section of the specimens
η
Intensity of related (hkl) diffractions (counts per second)
P(hkl)
(111)Cu
(110)Fe
(200)Cu
(220)Cu
(200)Fe
(311)Cu
Ij0
(111)Cu
(110)Fe
(200)Cu
(220)Cu
(200)Fe
(311)Cu
0
6 446.6
570.4
1 960.4
81.4
1 418.0
992.4
12 032.1
0.54
0.05
0.13
0.01
0.11
0.08
1.0
19 511.0
10 707.0
12 006.0
10 068.0
10 249.0
10 613.0
93 744.0
0.26
0.14
0.16
0.13
0.14
0.14
4.0
35 784.0
21 464.0
22 038.4
20 056.0
20 204.8
20 856.0
181 590.4
0.25
0.15
0.15
0.14
0.14
0.14
6.0
44 679.0
31 526.4
31 863.0
30 041.4
30 203.4
30 811.8
260 746.8
0.21
0.15
0.15
0.15
0.14
0.14
8.6
67 311.4
42 376.0
41 769.4
40 025.2
40 127.8
40 412.2
354 277.4
0.23
0.15
0.15
0.14
0.14
0.14
Fig. 5 shows the Lotgering factors of different crystal planes from the longitudinal and transverse sections of the alloy at different drawing strains. From the longitudinal section of Cu-12% Fe, L(220) of Cu obviously increases and L(200) of Fe slightly increases with an increase in the drawing strain. L(111) of Cu and L(110) of Fe decrease while L(200) of Cu hardly changes with an increase in the drawing strain. From the transverse section, L(111) of Cu and L(110) of Fe increase with the drawing strain. L(200) and L(220) of Cu and L(200) of Fe maintain basically a constant or slightly decrease with an increase in the drawing strain. Those results indicate that the drawing strain can produce the preferred orientations of <110> in Cu filaments and <100> in Fe filaments on the longitudinal section, and the drawing strain can produce the preferred orientations of <111> in Cu filaments and <110> in Fe filaments on the transverse section.
Fig.5 Lotgering factors of different crystal planes from the longitudinal section (a) and transverse section (b) of Cu-12% Fe at different drawing strains
3.3. Vickers hardness
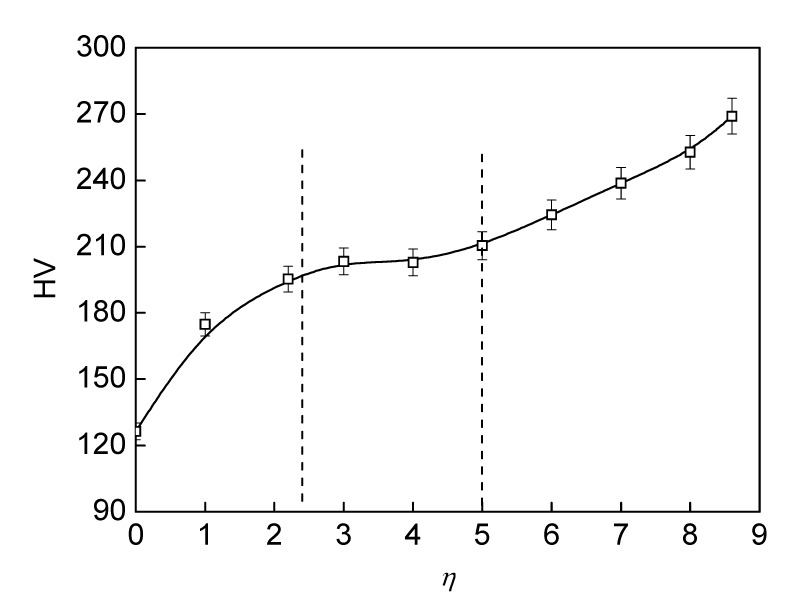
Fig. 6 shows the change of the hardness of Cu-12% Fe with the drawing strain. The hardness obviously increases in the initial drawing process and at η>5.0, and slowly increases at η=2.2–5.0.
Fig.6 Dependence of the hardness on longitudinal section of Cu-12% Fe with the drawing strain
4. Discussion
4.1. Microstructure evolution
During drawing, Fe dendrites were evolved into aligned filaments on the longitudinal section and into curled ribbons on the transverse section. The aspect ratio k is defined to describe the morphological evolution by determining the width w and thickness t of Fe ribbons on the transverse section
.
It is certain that a high drawing strain must produce a high aspect ratio. The true strain of Fe grains can be expressed as
,
where kFe and are the average aspect ratios of Fe grains in deformed and undeformed specimens, respectively.
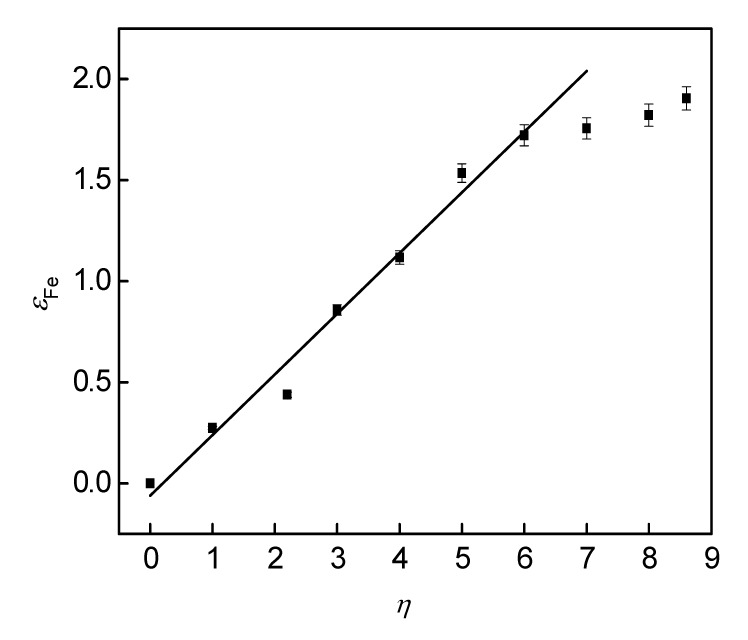
The relationship between the strain of Fe grains and the drawing strain of the wires is shown in Fig. 7. At η=0–6.0, the strain of Fe grains increases almost linearly with the drawing strain. This implies that Fe grains undergo a homogeneous strain with the reduction in the wire section or both strains of Fe and Cu phases being practically isochronous. At η>6.0, the increase in the strain of Fe grains becomes slow and deviates from the linear relation. This implies that the strain degree of Fe grains is lower than the strain of the wire or that the Cu matrix endures more strain than Fe ribbons at higher drawing strains. In this case, the Fe ribbons may need more curl to fit the strain of the Cu matrix, which is similar to the situation of Nb ribbons (Raabe et al., 2009; Hao et al., 2013).
Fig.7 Dependence of the strain of Fe grains on the drawing strain for Cu-12% Fe
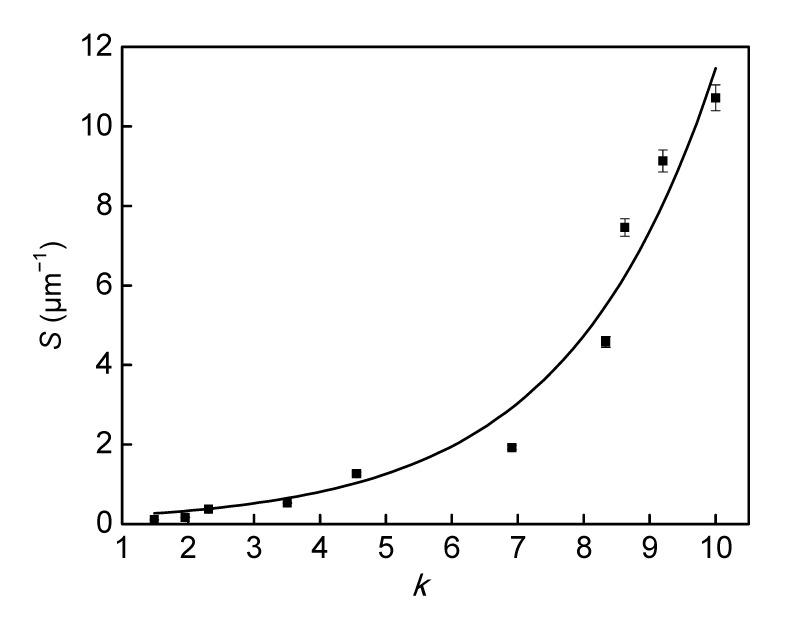
The microstructure evolution during the drawing strain must result in the change in the interface density and shows the relationship between the interface density of Cu and Fe phases and the aspect ratio of Fe ribbons. The interface density obviously increases with the aspect ratio of Fe ribbons and can be expressed by the exponential relationship as shown in Fig. 8,
.
Fig.8 Dependence of the interface density of Cu and Fe phases on the aspect ratio for Cu-12% Fe
4.2. Hardness
The hardness as a function of the Fe filament spacing is plotted in Fig. 9. It is obvious that the relationship between the hardness and Fe filament spacing can be expressed by the well-known Hall-Petch equation similarly as
,
where kH is the Hall-Petch coefficient reflecting the change in hardness with filament spacing, and HV0 is the intrinsic hardness of the specimen with a rather coarse filament.
Fig.9 Change in the hardness on the longitudinal section of Cu-12% Fe wire with the Fe ribbon spacing
The change in strain hardening with filament spacing shows the behavior in two stages. In the initial strain stage of η<3.0, the multiplication of dislocations or the refinement of subcells has a high rate in elongated Cu and Fe grains due to low dislocation density in the coarse initial microstructure, which results in a higher hardening rate or larger Hall-Petch coefficient from the microstructure refining. In the high strain stage of η>3.0, the dynamic recovery may occur because high deformation heat sufficiently releases the strain storage energy, which results in near equilibrium between dislocation generation and annihilation. The dynamic recovery has been well observed and discussed in cold drawn pure Cu and Cu-Nb alloys (Cairns et al., 1971; Spitzig et al., 1987). Moreover, at large drawing strains, the interface spacing approaches the minimum size of stable dislocation cells or the subcells have failed to be refined further in the subsequent drawing strain (Spitzig, 1991; Biselli and Morris, 1996; Zheng et al., 2013). Both mechanisms can be responsible for the reduced hardening rate or reduced Hall-Petch coefficient due to microstructure refining in the stage of a heavy drawing strain at η>3.0.
5. Conclusions
The Cu matrix and Fe dendrites in Cu-12% Fe evolved into the composite filamentary structure during the drawing process. The preferred orientations of <110> in Cu filaments and <100> in Fe filaments tend to be formed on the longitudinal section of the wires. The preferred orientations of <111> in Cu filaments and <110> in Fe filaments tend to be formed on the transverse section.
The thickness, width, and spacing of Fe ribbons in the filamentary structure exponentially decrease with an increase in the drawing strain. The density of the interface between Cu and Fe phases exponentially increases with an increase in the aspect ratio of Fe ribbons. With an increase in the drawing strain, the strain of Fe grains linearly increases at drawing strains lower than 6.0 and deviates from the linear relationship at drawing strains higher than 6.0.
Heavy drawing deformation results in high strain hardening. There is a similar Hall-Petch relationship between the hardness and Fe filament spacing. The hardening from the microstructure refining is more obvious at drawing strains below 3.0 than over 3.0.
[1] Biselli, C., Morris, D.G., 1994. Microstructure and strength of Cu-Fe in situ composites obtained from prealloyed Cu-Fe powders. Acta Metallurgica et Materialia, 42(1):163-176.
[2] Biselli, C., Morris, D.G., 1996. Microstructure and strength of Cu-Fe in situ composites after very high drawing strains. Acta Materialia, 44(2):493-504.
[3] Brokmeier, H.G., Bolmaro, R.E., Signorelli, J.A., 2000. Texture development of wire drawn Cu–Fe composites. Physica B: Condensed Matter, 276-278:888-889.
[4] Cairns, J.H., Clough, J., Dewey, M.A.P., Nutting, J., 1971. The structure and mechanical properties of heavily deformed copper. Journal of the Institute of Metals, 99:93-97.
[5] Funkenbusch, P.D., Courtney, T.H., 1981. Microstructural strengthening in cold worked in situ Cu-14.8 Vol.% Fe composites. Scripta Metallurgica, 15(12):1349-1354.
[6] Funkenbusch, P.D., Courtney, T.H., 1985. On the strength of heavily cold worked in situ composites. Acta Metallurgica, 33(5):913-922.
[7] Gao, H.Y., Wang, J., Shu, D., 2005. Effect of Ag on the microstructure and properties of Cu–Fe in situ composites. Scripta Materialia, 53(10):1105-1109.
[8] Gao, H.Y., Wang, J., Shu, D., 2007. Microstructure and strength of Cu–Fe–Ag in situ composites. Materials Science and Engineering: A, 452-453:367-373.
[9] Go, Y.S., Spitzig, W.A., 1991. Strengthening in deformation-processed Cu-20% Fe composites. Journal of Materials Science, 26(1):163-171.
[10] Hao, S.J., Cui, L.S., Jiang, D.Q., 2013. A transforming metal nanocomposite with large elastic strain, low modulus, and high strength. Science, 339(6124):1191-1194.
[11] He, L., Allard, L.F., Ma, E., 2000. Fe-Cu two-phase nanocomposites: application of a modified rule of mixtures. Scripta Materialia, 42(5):517-523.
[12] Hong, S.I., Hill, M.A., 2001. Microstructure and conductivity of Cu-Nb microcomposites fabricated by the bundling and drawing process. Scripta Materialia, 44(10):2509-2515.
[13] Jeong, E., Han, S., Goto, M., 2009. Effects of thermo-mechanical processing and trace amount of carbon addition on tensile properties of Cu–2.5Fe–0.1P alloys. Materials Science and Engineering: A, 520(1-2):66-74.
[14] Jin, Y., Adachi, K., Takeuchi, T., 1997. Correlation between the electrical conductivity and aging treatment for a Cu-15 wt% Cr alloy composite formed in-situ. Materials Letters, 32(5-6):307-311.
[15] Lotgering, F.K., 1959. Topotactical reactions with ferrimagnetic oxides having hexagonal crystal structures—I. Journal of Inorganic and Nuclear Chemistry, 9(2):113-123.
[16] Morris, D.G., Muñoz-Morris, M.A., 2011. The effectiveness of equal channel angular pressing and rod rolling for refining microstructures and obtaining high strength in a Cu–Fe composite. Materials Science and Engineering: A, 528(19-20):6293-6302.
[17] Qu, L., Wang, E.G., Zuo, X.W., 2011. Experiment and simulation on the thermal instability of a heavily deformed Cu–Fe composite. Materials Science and Engineering: A, 528(6):2532-2537.
[18] Raabe, D., Ohsaki, S., Hono, K., 2009. Mechanical alloying and amorphization in Cu-Nb-Ag in situ composite wires studied by transmission electron microscopy and atom probe tomography. Acta Materialia, 57(17):5254-5263.
[19] Sauvage, X., Wetscher, F., Pareige, P., 2005. Mechanical alloying of Cu and Fe induced by severe plastic deformation of a Cu–Fe composite. Acta Materialia, 53(7):2127-2135.
[20] Spitzig, W.A., 1991. Strengthening in heavily deformation processed Cu-20%Nb. Acta Metallurgica et Materialia, 39(6):1085-1090.
[21] Spitzig, W.A., Pelton, A.R., Laabs, F.C., 1987. Characterization of the strength and microstructure of heavily cold worked Cu-Nb composites. Acta Metallurgica, 35(10):2427-2442.
[22] Stepanov, N.D., Kuznetsov, A.V., Salishchev, G.A., 2013. Evolution of microstructure and mechanical properties in Cu–14%Fe alloy during severe cold rolling. Materials Science and Engineering: A, 564:264-272.
[23] Wu, Z.W., Chen, Y., Meng, L., 2009. Effects of rare earth elements on annealing characteristics of Cu-6 wt.% Fe composites. Journal of Alloys and Compounds, 477(1-2):198-204.
[24] Wu, Z.W., Liu, J.J., Chen, Y., Meng, L., 2009. Microstructure, mechanical properties and electrical conductivity of Cu–12wt% Fe microcomposite annealed at different temperatures. Journal of Alloys and Compounds, 467(1-2):213-218.
[25] Zheng, S.J., Beyerlein, I.J., Carpenter, J.S., 2013. High-strength and thermally stable bulk nanolayered composites due to twin-induced interfaces. Nature Communications, 4:1696
Open peer comments: Debate/Discuss/Question/Opinion


Open peer comments: Debate/Discuss/Question/Opinion
<1>