1. Introduction
With the rapid development of bridge engineering, multi-span cable-stayed bridges have become one of the main structures of modern highways and railways for crossing large rivers or straits. They have advantages of design and construction, lower cost, and better landscape effects (Virlogeux,
2001). Currently, more than ten multi-span cable-stayed bridges with main span exceeding 400 m have been built or are planned to be constructed all over the world, including the famous Ting Kau Bridge in Hong Kong and the Rion Antirion Bridge in Greece.
However, as the number of towers and the length of the main span increase, the structural stiffness of multi-span cable-stayed bridges degenerates significantly. This type of bridge might be vulnerable to seismic loading when different supports are subjected to significantly different seismic excitations (Gimsing and Georgakis,
2011).
Multi-support excitations are often considered to be one of the main contributors to the spatial variation of earthquake excitations. The assumption of non-uniform excitation, which is used in estimating the time lag factor of the wave propagation effects, should be taken into consideration when conducting seismic design and analysis of long span bridges, such as multi-span cable-stayed bridges (Mylonakis et al.,
2001).
Many previous studies concentrated on the dynamic mechanisms associated with the seismic responses of cable-stayed bridges under earthquake excitations, using theoretical deduction and numerical simulation. Ren and Makoto (
1999) investigated the elastic-plastic seismic behavior of a long span cable-stayed steel bridge under three strong earthquake records by considering the geometric and material nonlinearities. Abdel-Ghaffar and Khalifa (
1991) conducted a 3D nonlinear static analysis and dynamic analysis of cable-stayed bridges to explore the mechanisms associated with the seismic response. Their study showed the contribution of cable vibrations to the seismic response of cable-stayed bridges. Gattulli and Lepidi (
2007) systematized the problem showing the importance of the avoidance of 1:1 modal resonances from global and local modes in the dynamic performance of cable-stayed bridges. Raheem et al. (
2011) discussed the effects of spatial variability on the feasibility and efficiency of seismic control systems for controlling the vibration of cable-stayed bridges. Fang et al. (
2011) explored the influence of traveling-wave effects on the seismic response of a multi-span cable-stayed bridge with different constraint conditions manners among the towers and the main girder.
Compared with these numerous theoretical and numerical advances, the experimental study of seismic responses of cable-stayed bridges has lagged behind the demands of practical engineering. In recent years, the shaking table array system has become one of the most favorable techniques to perform earthquake simulation tests of long-span cable-stayed bridges under multi-support excitations (Huang et al.,
2008). For example, the dual tri-axial shaking table system in the Chongqing Transportation Research Institute was used to conduct earthquake shaking table tests of a scale Xiamen-Zhangzhou Bay Bridge (Zhang,
2009). Kitazawa and Fujita (
1989) completed seismic tests on a 1:100 scale model of a cable-stayed bridge under 3D earthquake excitations. Kawashima et al. (
1993) evaluated the damping mechanism of cable-stayed bridges by experimental study on a 1:150 scale model. Shoji et al. (
2008) carried out shaking table tests of a pre-stressed concrete cable-stayed bridge and clarified the mechanisms associated with the seismic responses of a long-period structure when subjected to a long-period seismic excitation. Yang and Cheung (
2011) conducted the shaking table tests of a double-deck concrete cable-stayed bridge with a scale ratio of 1:120 subjected to non-uniform excitations, and discussed the effects of non-uniform excitations on two types of tower-deck connection. However, there have been few experimental studies focusing on the whole structural dynamic behavior of multi-span cable-stayed bridges under multi-excitations.
The seismic response characteristics of multi-span cable-stayed bridges subjected to multi-support excitations have not been studied sufficiently from theoretical and experimental perspectives. To explore their sophisticated seismic characteristics, a 1:100 scale model of a three-tower cable-stayed bridge was selected to conduct shaking table tests under uniform and non-uniform excitations in this paper. In Section 2, the elaborate design of the scale model and the details of the shaking table tests are introduced. In Section 3, three kinds of experimental results are compared. The conclusions are given in Section 4. The experimental results from the shaking table tests provide valuable evidence which may be useful for the seismic design and analysis of this type of multi-tower cable-stayed bridge.
2. Shaking table tests
2.1. Prototype of Wuhan Erqi Yangtze River Bridge (WEYRB)
The Wuhan Erqi Yangtze River Bridge (WEYRB) (Fig.
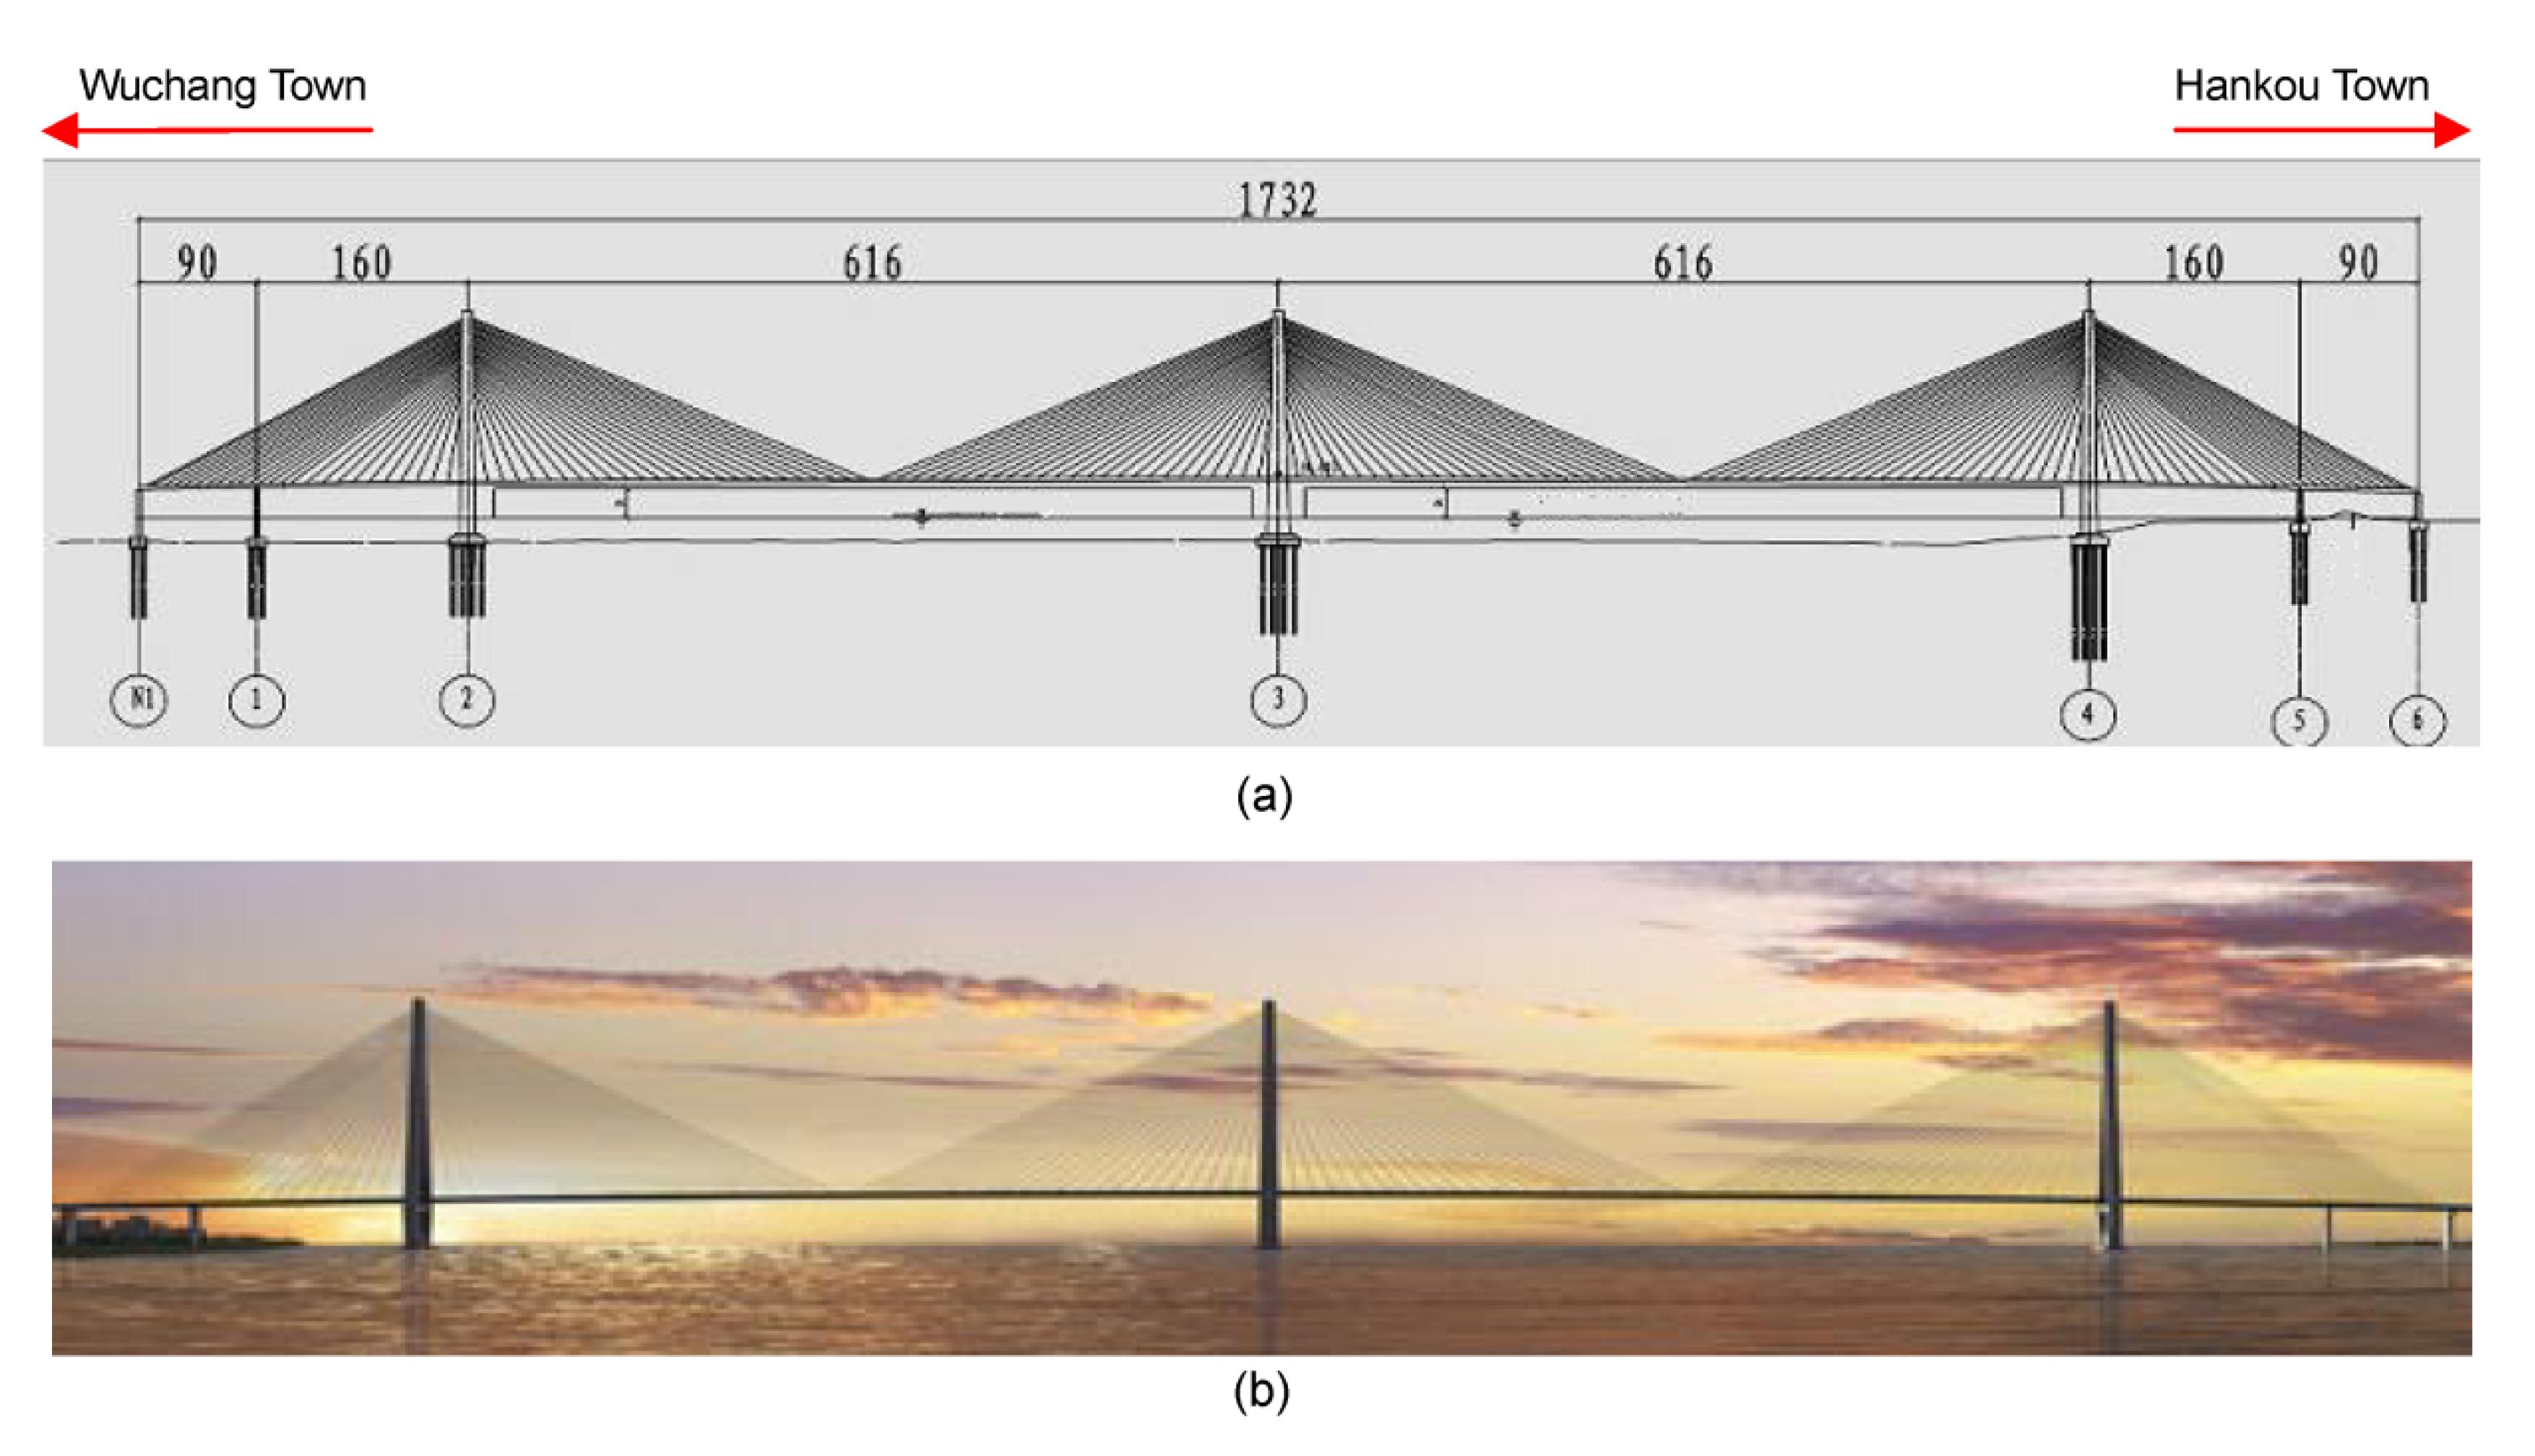
1) was selected as the prototype structure of a three-tower and double-cable-plane cable-stayed bridge. This bridge, connecting Wuchang and Hankou Towns in Wuhan city, was opened to traffic in December, 2011. The main span is a steel-concrete composite girder, while two side spans are pre-stressed concrete girders. The arrangement of the spans along the bridge is 90 m+160 m+616 m+616 m+160 m+90 m, with an overall length of 1732 m. The total width of the bridge deck is 31.4 m with six traffic lanes and two pedestrian walkways. There are total 132 cables, of which the longest has a length of 336.2 m, connecting the towers and main girder, and the typical distance between two cables on the bridge deck is 13.5 m. The cables are composed of a number of high-strength strands (1860 MPa level) with 15.2 mm in diameter. The height of the inverted H-shaped reinforced concrete tower is 205 m with a clear navigation height of 45 m. Two vertical bearings and longitudinal spacing blocks are located among each of the main towers and the main girder, and two two-way activity bearings and horizontal wind-resistant bearings are installed on each side of the towers among the towers and the main girder.
Fig.1
Wuhan Erqi Yangtze River Bridge (WEYRB): (a) elevation (unit: m); (b) prototype
2.2. Scale model of Wuhan Erqi Yangtze River Bridge (WEYRB)
In the process of designing the whole scale model of the WEYRB based on dynamic similitude laws, the following basic requirements were considered: (1) The scale model should be simple in terms of its fabrication and construction; (2) The geometric scale of 1:100 was selected according to the arrangement of the shaking table array system and the length of the prototype; (3) The scale model should be as large as possible to eliminate the effects of irregularities in structural configuration and variation caused by the properties of the materials (Shoji et al.,
2008); (4) The ratios between the scale model and the prototype bridge for the tensile stiffness and bending stiffness of the main girder, towers and cables, and the mass of these components, should be similar. Detailed derivations and descriptions of dimensional analysis and modeling theory can be found in (Harris and Sabnis,
1999). Based on these requirements, the similarity ratios of the scale model with respect to the prototype bridge were determined (Table
1).
Table 1
Similarity ratios of the scale model to the prototype bridge
|
Physical quantity |
Similarity ratio |
| Material property |
Modulus of elasticity, E
|
1/12.81 |
| Strain, ε
|
1/1 |
| Stress, Eε
|
1/12.81 |
Equivalent quality density, 
|
1/1.432 |
|
| Geometry property |
Length, l
|
1/100 |
| Area, l
2
|
1/1.0×104
|
| Moment of inertia, l
4
|
1/1.0×108
|
| Flexural rigidity, El
2
|
1/1.28×105
|
| Tensile rigidity, El
4
|
1/1.28×109
|
|
| Dynamic property |
Mass, 
|
1/1.43×106
|
Time, ^{1/2}}\]
)
|
1/0.043 |
Frequency, ^{ - 1/2}}\]
)
|
1/23.35 |
Velocity, ^{1/2}}\]
)
|
1/0.233 |
Horizontal acceleration, \]
)
|
1/5.45 |
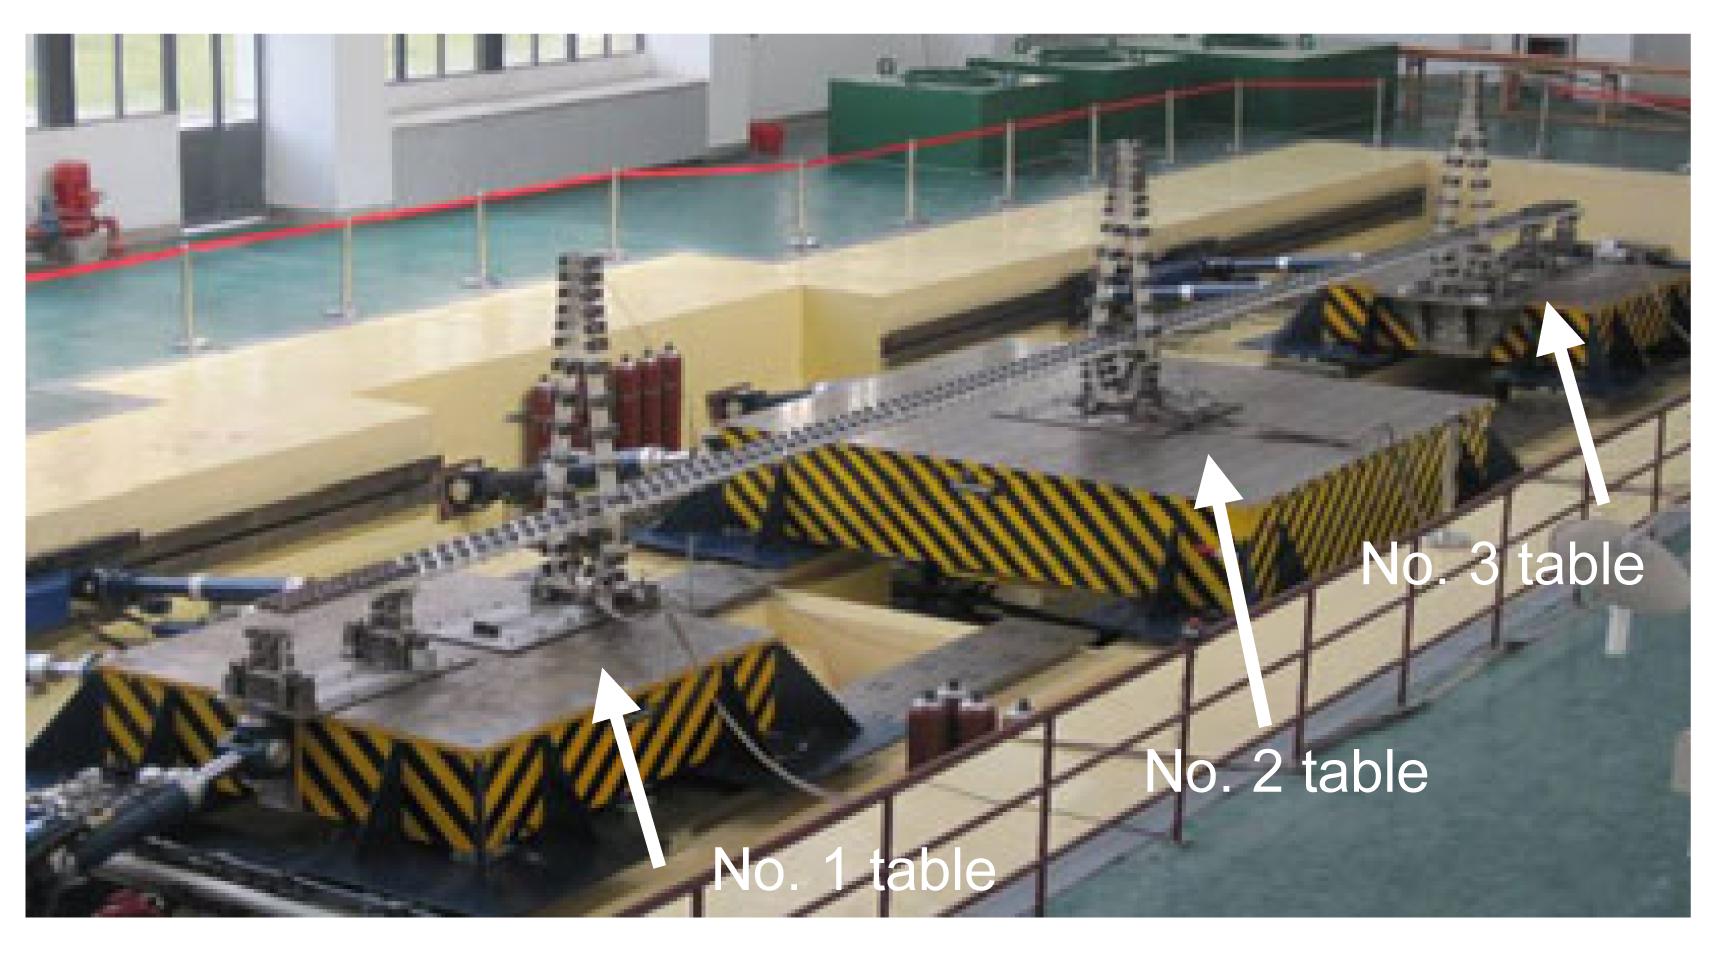
The span arrangement of the scale model was 0.90 m+1.60 m+6.16 m+6.16 m+1.60 m+0.90 m, with a total length of 17.32 m, and the height of the main tower was 2.05 m, excluding the foundation piles. The middle tower of the scale model was located in the middle of a fixed table (No. 2 table) and the two side towers were located on two mobile side-tables (No. 1 and No. 3 tables) (Fig.
2). The clear distance between the No. 2 table and No. 1 table (or No. 3 table) was 3.46 m, and steel plates were adopted to simulate a rigid foundation. The supplemented mass of the scale model was attached to the corresponding components after calculation.
Fig.2
Three-tower cable-stayed bridge model test
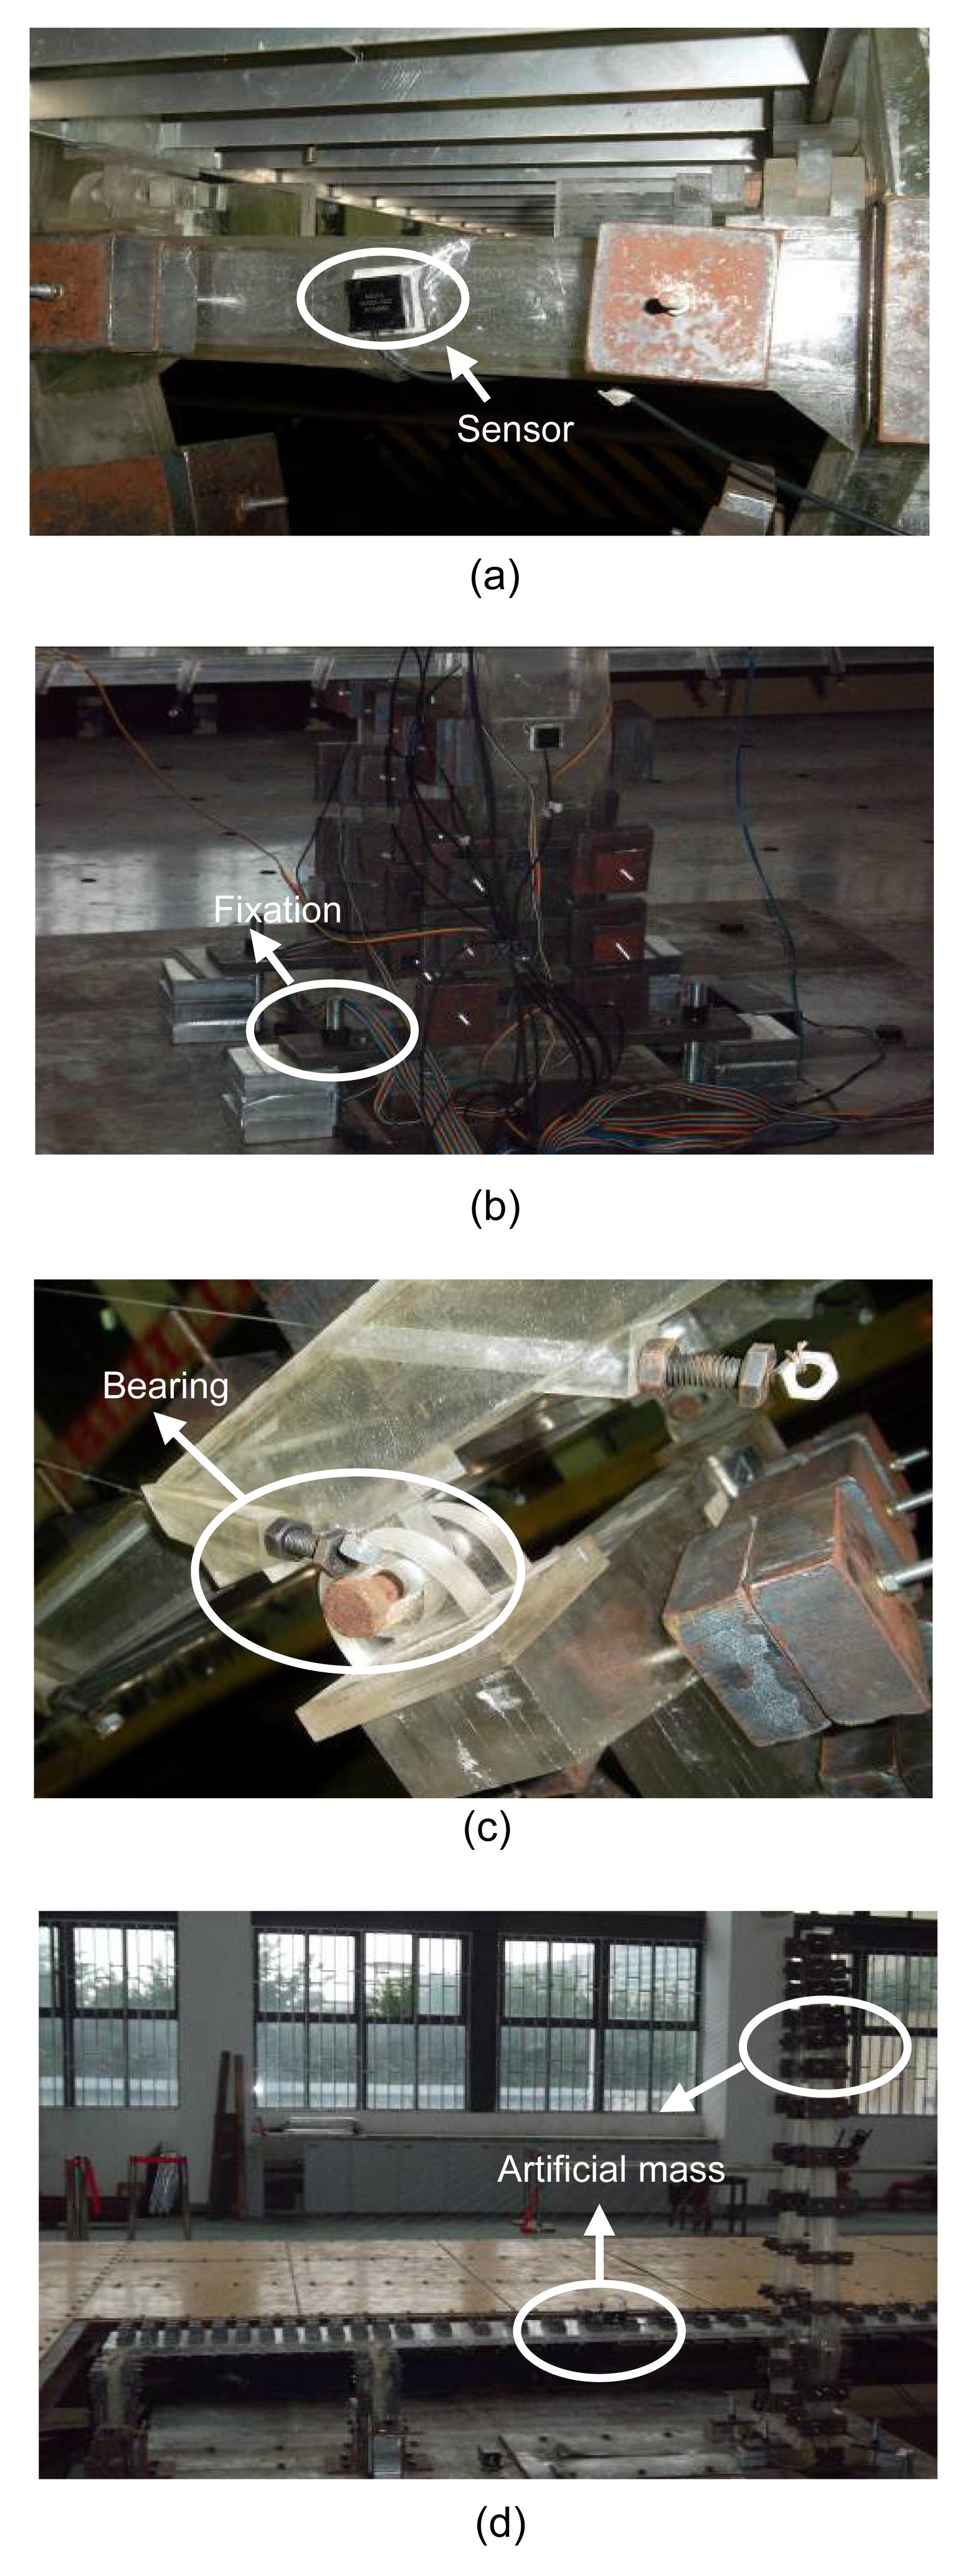
The main towers and side-span concrete girder were made of polymethyl methacrylate (PMMA) material, and the cables were made of high-strength steel wire with a diameter of 0.6 mm (Fig.
3). Based on the similar stiffness relations, the steel-concrete composite girder was simplified to composite components, including a groove aluminum alloy stringer of 1 mm thickness, a small angle-type aluminum alloy stringer of 0.8 mm thickness, an aluminum alloy transom of 0.8 mm thickness, and the PMMA bridge deck of 0.4 mm thickness. The free and the fixed support conditions of the longitudinal, transverse, and rotational movements among the towers and the main girder were idealized by combining a slider and a bearing. The detailed parameters of the materials of the scale model are listed in Table
2 (where
E represents the modulus of elasticity,
ρ is the density,
ε is the Poisson’s ratio, and
σ is the yield strength). These materials had good fabricating performance in machining and bonding, and also helped the reduction of the total weight of the scale model within the maximum payload capacity of the shaking table array system. Additional structurally uncoupling mass (artificial mass simulation) was attached to the model to augment the mass density.
Fig.3
Detail construction of the scale model: (a) acceleration sensor; (b) fixation of the middle tower; (c) construction of strand anchor and bearing; (d) artificial mass arrangement of sided-span
Table 2
Parameters of materials used in the scale model bridge
| Material |
E (MPa) |
ρ (kg/m3) |
ε
|
σ (MPa) |
| PMMA |
2.69×10³
|
1180 |
0.391 |
126 |
| Aluminum |
7.53×10⁴
|
2700 |
0.326 |
187 |
| Steel cable |
1.95×10⁵
|
7850 |
0.300 |
1330 |
2.3. Input ground motions
A total of 34 channels of accelerometers and 32 channels of strain gauges were instrumented in the scale model to measure the vertical and transverse accelerations of the main girder surface, the transverse and longitudinal accelerations of each tower, and the strain level in the key cross-sections of the main towers. The data acquisition system Dewesoft was selected to obtain the test data, and the sampling frequency was 200 Hz. Unfortunately, the laser displacement transducers could not be instrumented to measure the superstructure dynamic displacements of the scale model.
Before each formal earthquake excitation, white-noise scanning was conducted to track the dynamic properties of the scale model. Three synthetic earthquake waves with a duration of 20.5 s, including the Wuchang (WC), Jiangxin (JX), and Hankou (HK) waves, were selected as the input excitations based on an earthquake safety evaluation report provided by the Seismological Bureau of Hubei Province. The acceleration peak values of these waves were 1.836 m/s
2, 1.65 m/s
2, and 1.826 m/s
2, respectively. To unify the intensity, the EC wave from the Pacific Earthquake Engineering Research Center (PEER) Strong Motion Database was also employed to excite the shaking tables, but was modified by compressing the peak acceleration values. The time history curves of these earthquake waves are given in Fig.
4. The frequency band distribution of the JX wave was the widest among the four waves and the prime energy of the EC wave was concentrated on the lowest frequency area through the fast Fourier transform (FFT). The interval between each pair of steps was 0.02 s when conducting dynamic time history analysis on the scale model.
Fig.4
Time history curves of four earthquake waves: (a) WC wave; (b) JX wave; (c) HK wave; (d) EC wave
Tables
3 and
4 list the typical cases for the shaking table tests. Uniform excitations of the four earthquake waves and non-uniform excitations of only the EC wave were conducted in both the
X and
Y directions with the same ground motion. Due to the conflict between the acceleration similarity rule of the input excitations and the experimental load condition, the peak acceleration values of all input excitations were adjusted to the integer multiple of 1 m/s
2. This was done to compare the seismic responses of the scale model conveniently under four earthquake waves and at different strength amplitudes of the EC wave without reflecting the prototype properties. During the non-uniform excitation cases, different input waves were applied to different tables. The wave propagation effects were explored by changing the wave passage velocity of the EC wave to 308 m/s, 616 m/s, 1232 m/s or infinite. The distances between the two main towers were used to calculate the difference in the arrival time for different tables. Only the longitudinal input was considered in this study.
Table 3
Multi-support uniform excitations cases
| Case |
Wave |
Acceleration peak (m/s2) |
Input direction |
| 1 |
EC |
1 |
X+Y
|
| 2 |
WC |
1 |
X+Y
|
| 3 |
JX |
1 |
X+Y
|
| 4 |
HK |
1 |
X+Y
|
| 8 |
EC |
2 |
X+Y
|
| 9 |
EC |
3 |
X+Y
|
| 10 |
EC |
4 |
X+Y
|
Table 4
Multi-support non-uniform excitations cases
| Case |
Wave |
Acceleration peak (m/s2) |
Input direction |
Apparent wave velocity (m/s) |
No. 1 table (s) |
No. 2 table (s) |
No. 3 table (s) |
| 1 |
EC |
1 |
X+Y
|
Infinite |
0 |
0 |
0 |
| 5 |
EC |
1 |
X+Y
|
1232 |
0 |
0.5 |
1 |
| 6 |
EC |
1 |
X+Y
|
616 |
0 |
1 |
2 |
| 7 |
EC |
1 |
X+Y
|
308 |
0 |
2 |
4 |
3. Experimental
3.1. Seismic responses of the scaled model under uniform excitations
3.1.1. Acceleration responses of the main girder
When the acceleration peak values were set to 1.0 m/s
2 of the above four earthquake waves, the acceleration amplification coefficient was defined as the ratio of the measured acceleration value of the structural component to the input acceleration value of the shaking tables. The results of the acceleration amplification coefficients of the main spans in the vertical and transverse directions are compared in Figs.
5a and 5b, and the corresponding time history curves of the largest response points in the two directions are shown in Figs.
5c and 5d.
Fig.5
Comparison of the seismic responses of the main girder under uniform excitations: (a) vertical amplification coefficients; (b) transverse amplification coefficients; (c) vertical time history in the right main span; (d) transverse time history in the left main span
The acceleration amplification coefficients of the main girder under different excitations show the same variation trends as a whole. The largest values of the vertical amplification coefficients in the right main span under the EC, WC, JX, and HK waves are 3.94, 4.75, 8.47, and 6.25, respectively; and the corresponding transverse amplification coefficients in the left main span are 2.94, 4.28, 6.25, and 4.95, respectively. Therefore, for the scale cable-stayed bridge, the seismic response of the main girder is the greatest under the JX wave excitation, followed by the HK wave. The EC wave gives the slightest response due to the different frequency spectrum characteristics of those earthquake excitations.
The largest values of the vertical acceleration response in the right main span and left main span under 1 m/s
2 acceleration of JX wave excitation are 8.47 m/s
2 and 6.25 m/s
2, respectively. Strong vibration appeared in the main girder under horizontal earthquake excitations, which may cause strong vibration of cable strands under strong earthquake excitations.
3.1.2. Acceleration responses of the main towers
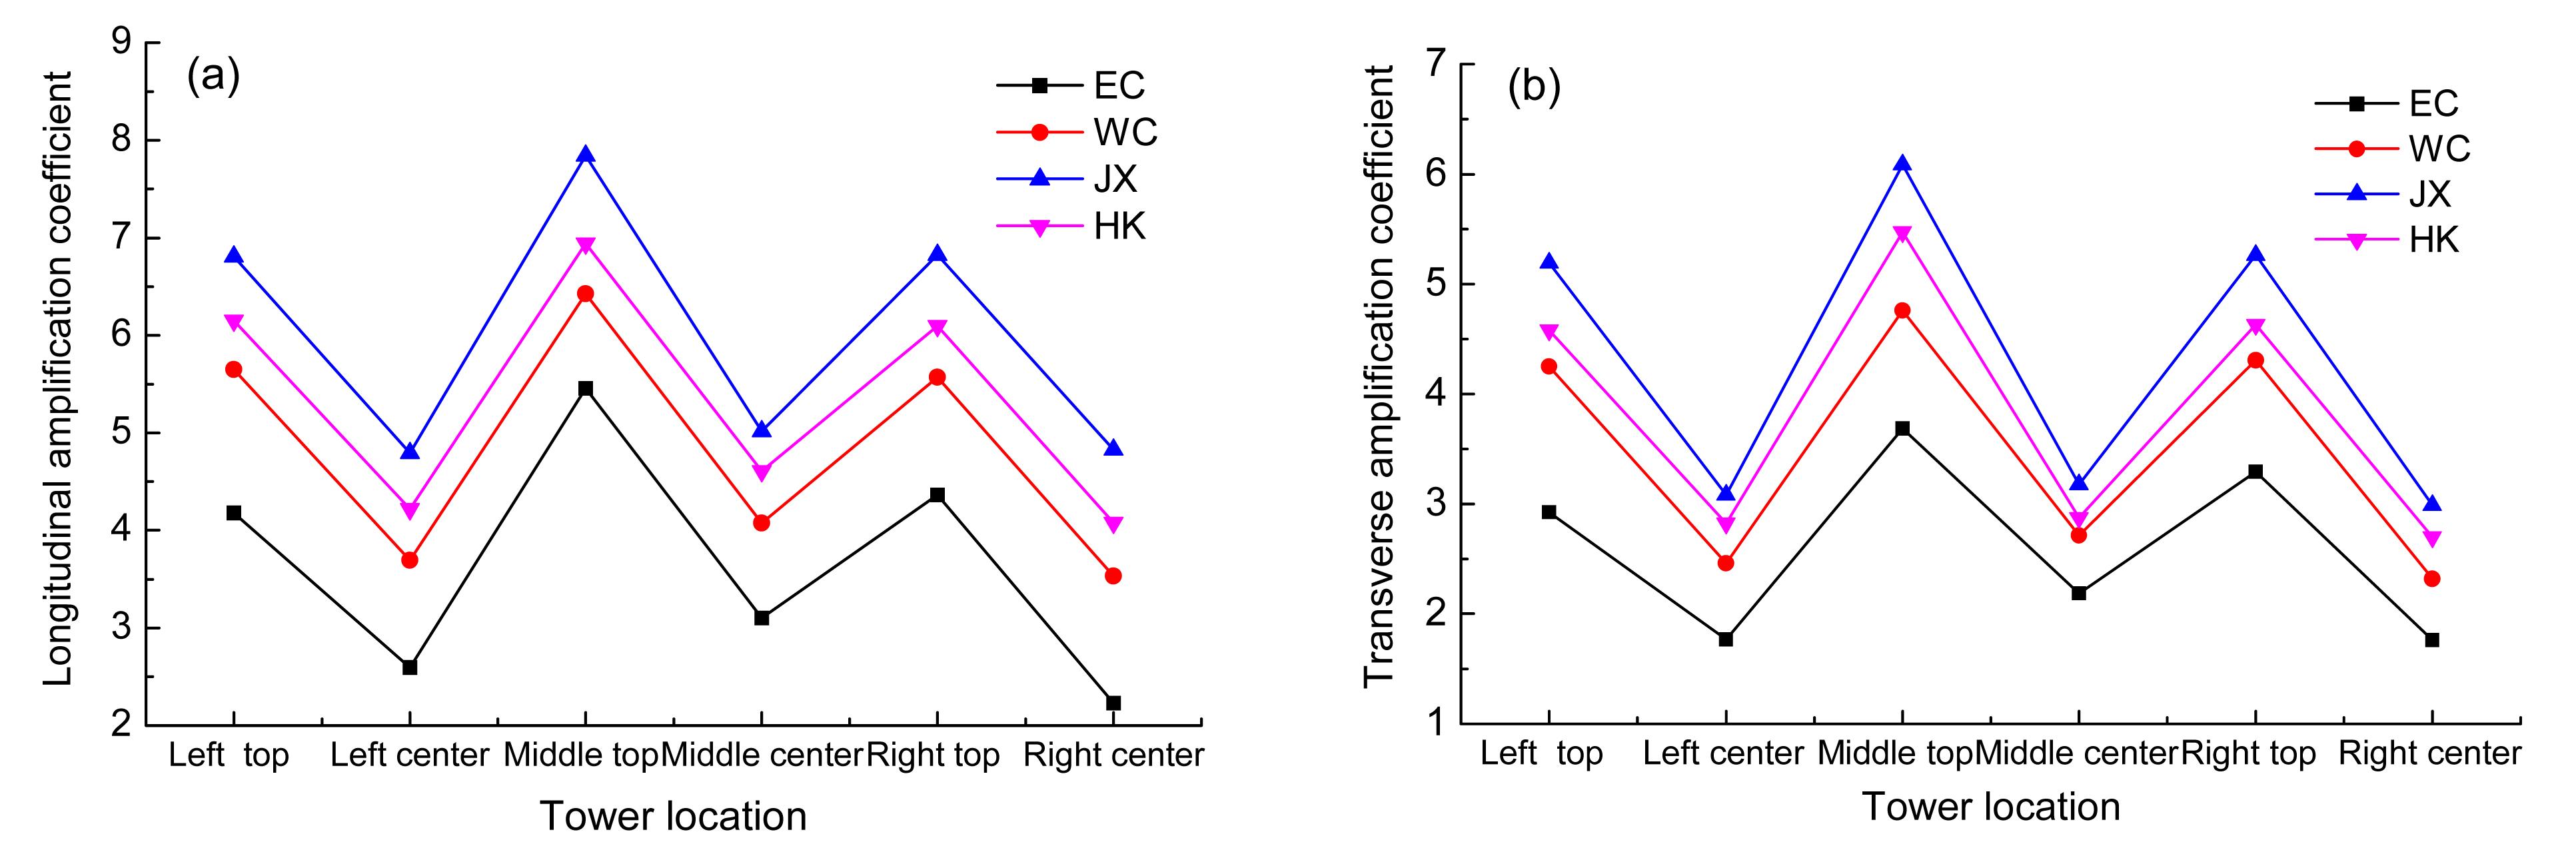
Similarly, the results for the acceleration amplification coefficients of the main towers in the longitudinal and transverse directions are compared in Fig.
6. The acceleration sensors were located at the top and in the middle of each tower. The amplification coefficients at the top are larger than those in the centre of the main tower, and the values of the middle main tower are the highest among the three main towers. The coefficients at the top of the middle main tower in the longitudinal and transverse directions are 7.93 and 6.13, respectively, when the acceleration peak value of the input JX wave is 1.0 m/s
2. This phenomenon suggests that some technical measures should be taken to increase the stiffness of the middle towers to improve the seismic performance of the three-tower cable-stayed bridge.
Fig.6
Comparison of the seismic responses of the main towers under uniform excitations: (a) longitudinal amplification coefficients; (b) transverse amplification coefficients
On the other hand, under the earthquake excitation, the vibration of stayed-cable will aggravate the vibration of the main towers. Because the cables of the scale model are too small, the forces and deformations of the stayed cables are difficult to be measured during the tests. So the interaction of the cables and the main towers were not considered in this study.
3.1.3. Strain responses of the main towers
Strain responses in the bottom sections of three-towers and two side piers under four different earthquake excitations with the 1 m/s
2 input acceleration are summarized in Table
5. All the strain responses under the EC wave are smaller than those under the other three waves, but the range of these values under different earthquake excitations is not so large. All the strain responses of the main towers are larger than those of the side piers, and the responses of the middle tower are the largest. The characteristics of the measured strain responses are similar to those of the acceleration responses of the scale model.
Table 5
Strain responses of the bottom sections at the acceleration peak of 1.0 m/s2
| Wave |
Left outside pier |
Left inside pier |
Left tower |
Middle tower |
Right tower |
Right inside pier |
Right outside pier |
| EC |
345.31 |
357.43 |
920.66 |
1059.41 |
972.28 |
345.78 |
326.20 |
| WC |
352.19 |
357.59 |
926.09 |
1064.65 |
989.69 |
353.39 |
327.68 |
| JX |
353.20 |
358.47 |
930.14 |
1070.36 |
992.20 |
354.83 |
330.28 |
| HK |
352.95 |
358.27 |
927.46 |
1054.05 |
971.57 |
353.59 |
329.04 |
However, the strain responses of the main girder in the scale model could not be measured during the tests. If possible, the dynamic strain of the main girder should be included.
3.2. Seismic responses of the scaled model under non-uniform excitations
The wave velocity depends on the type of soil on which the bridge foundations are constructed, and the size of the wave velocity has different effects on the various structural systems of cable-stayed bridges (Nazmy and Abdel-Ghaffar,
1990a;
1990b;
1992). Therefore, the influence of the traveling wave on the seismic responses of the main girder and towers of the scale three-tower cable-stayed bridge was compared using three wave velocities in this study. Because of the limitations of the tests data, the principles of seismic performance of multi-span cable-stayed bridges under multi-support excitations will not be discussed in detail here.
3.2.1. Acceleration responses of the main girder
Three wave velocities of the EC waves, such as 1232 m/s, 616 m/s, and 308 m/s, were adopted to study the seismic responses of the scale model. The acceleration amplification coefficients of the main girder in the vertical and transverse directions are shown in Figs.
7a and 7b, and the corresponding time history curves of the largest response points in the vertical and transverse directions under non-uniform excitations are shown in Figs.
7c and 7d.
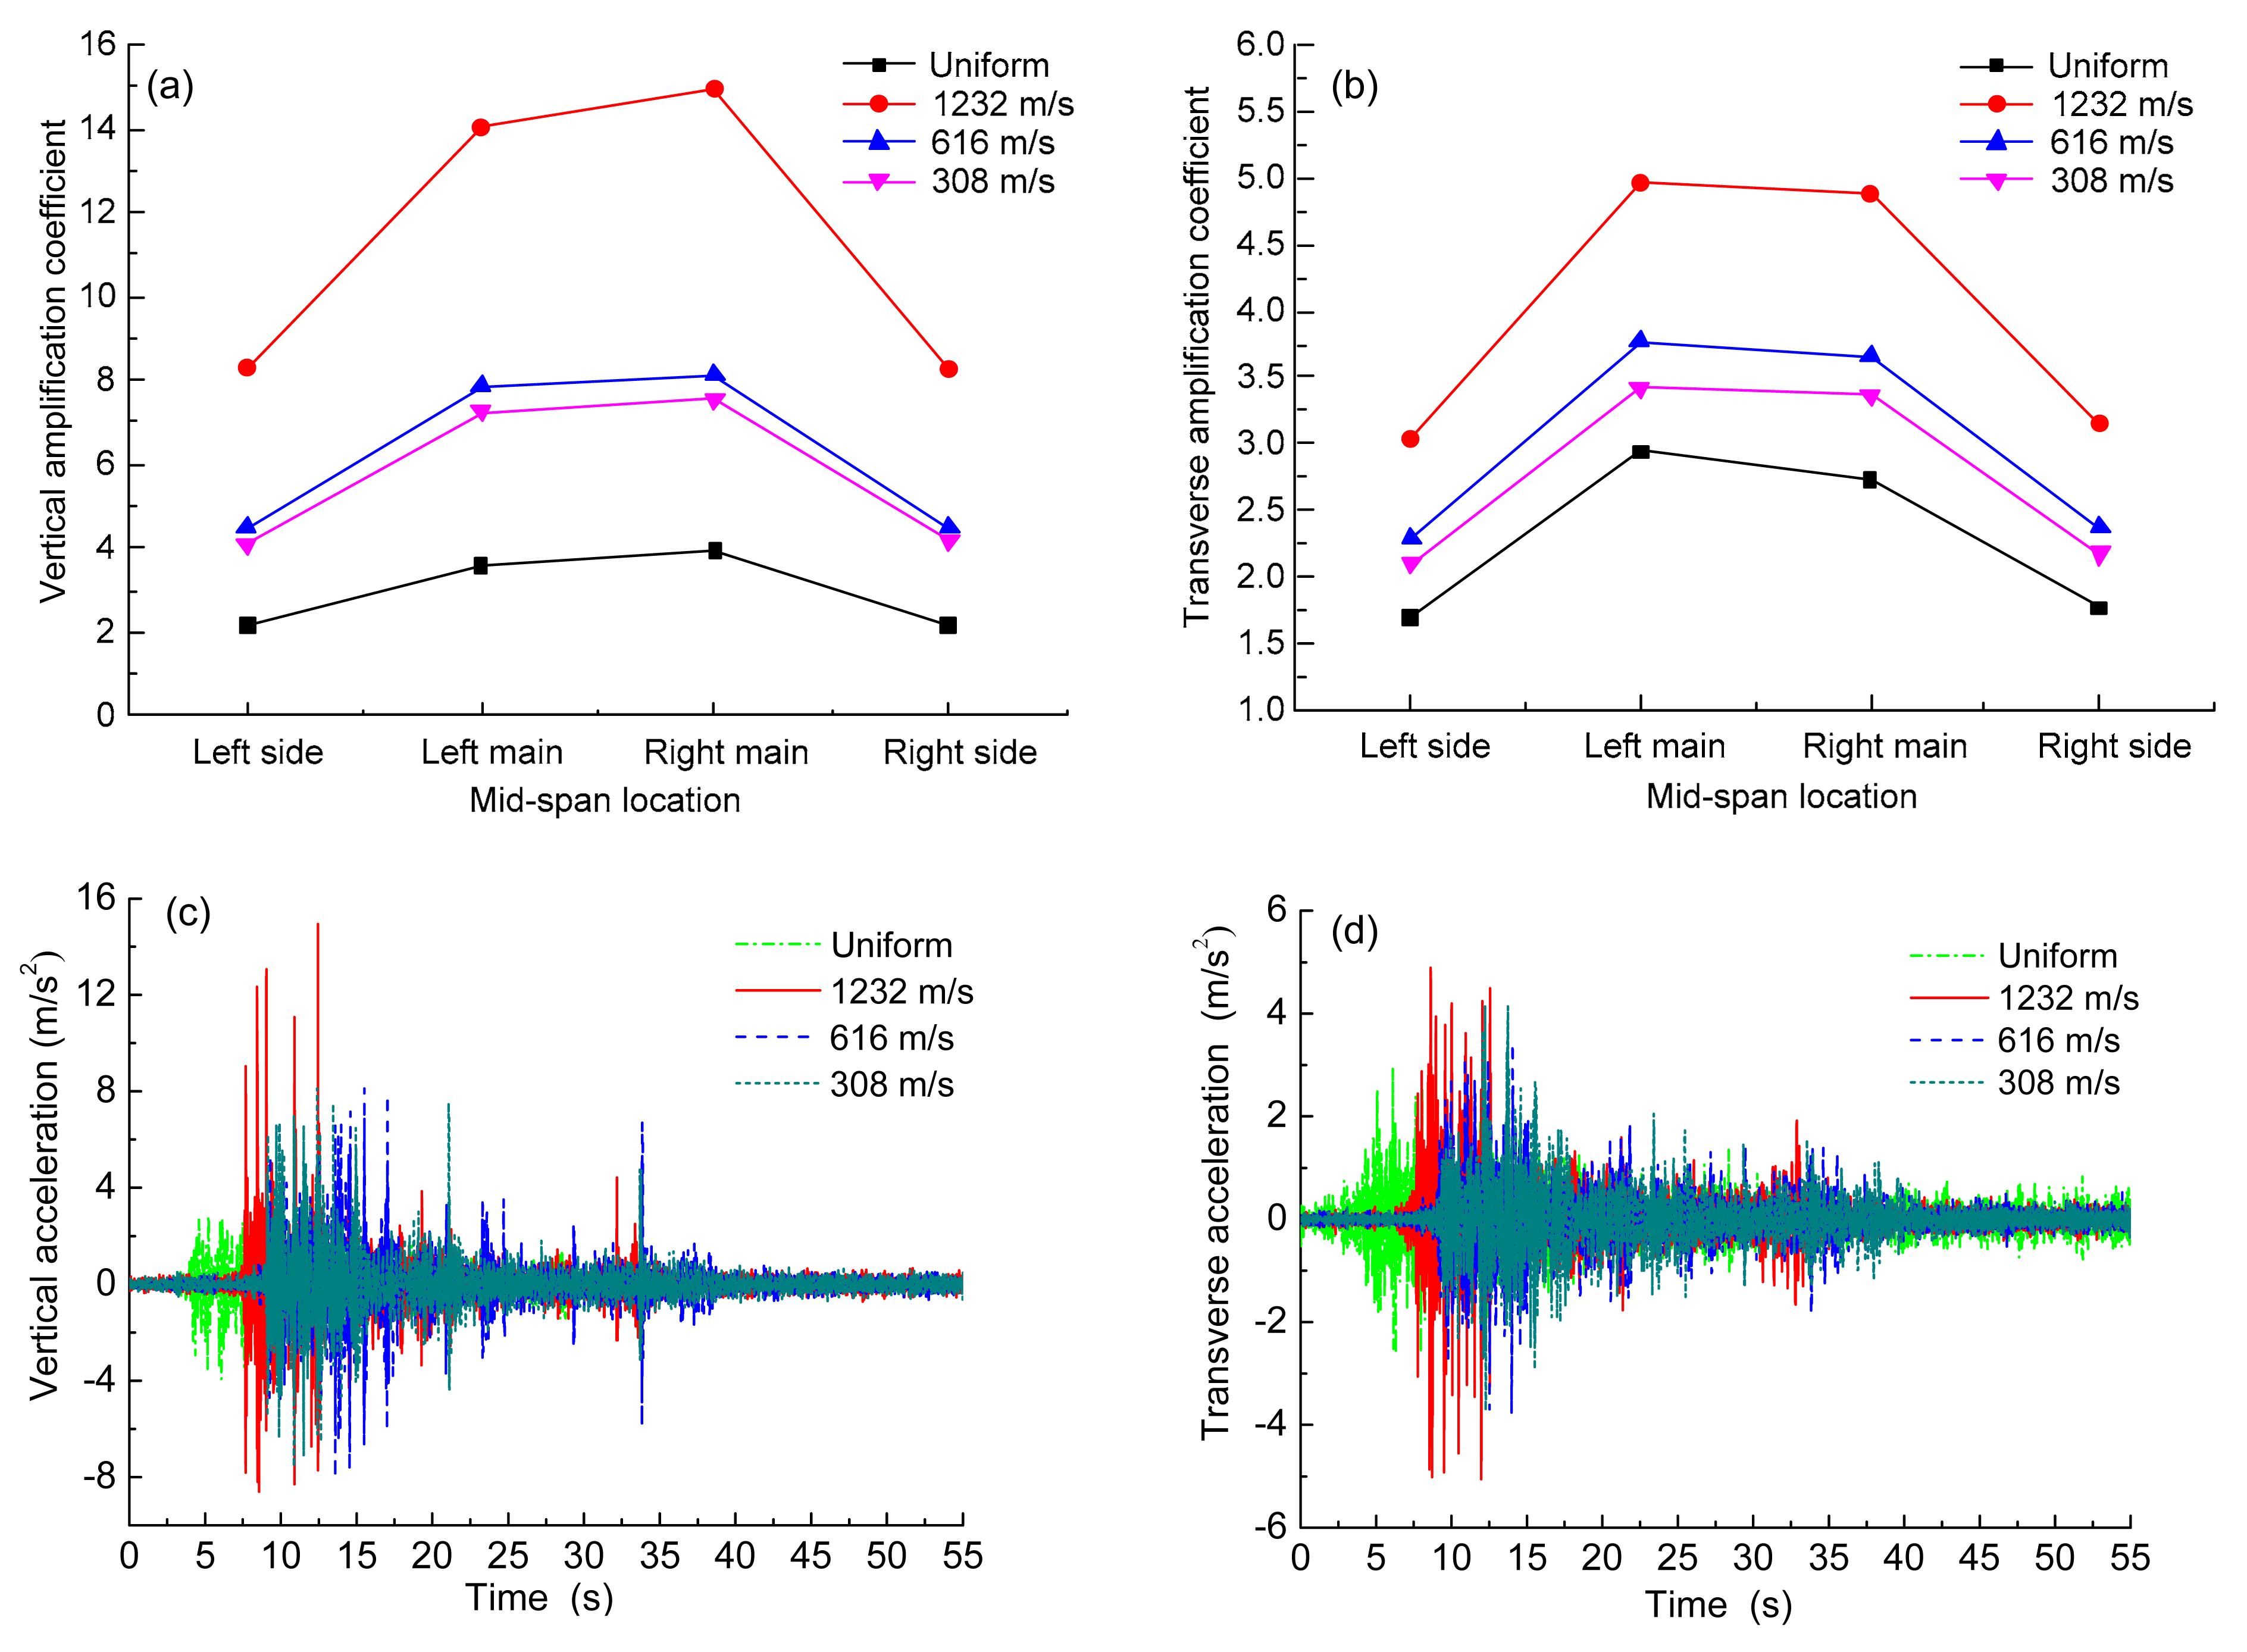
Fig.7
Comparison of the seismic responses of the main girder under non-uniform excitations: (a) vertical amplification coefficients; (b) transverse amplification coefficients; (c) vertical time history in the right main span;(d) transverse time history in the left main span
All acceleration amplification coefficients of the main girder under non-uniform excitations in two directions are larger than those under uniform excitations. The largest ratios of the vertical acceleration amplification coefficients under different velocities of 1232 m/s, 616 m/s, and 308 m/s, compared with those from the uniform excitations, are 14.95, 8.13, and 7.58, respectively. The corresponding largest ratios in the transverse direction are 4.96, 3.76, and 3.43, respectively. Therefore, the seismic responses of the main girder of the scale model become larger as the wave velocity increases. The results reveal that the seismic performance of the main girder of a three-tower cable-stayed bridge should be markedly affected by traveling wave effects, especially when the velocity exceeds 616 m/s. It is suggested that the apparent wave velocity should not been neglected during the seismic design of multi-span cable-stayed bridges with large span. Under non-uniform excitations, the stiffness of the main girder of a multi-span cable-stayed bridge should be enhanced.
3.2.2. Acceleration responses of the main towers
In the same way, the acceleration amplification coefficients of the main towers considering traveling wave effects are also compared with those from uniform excitations (Fig.
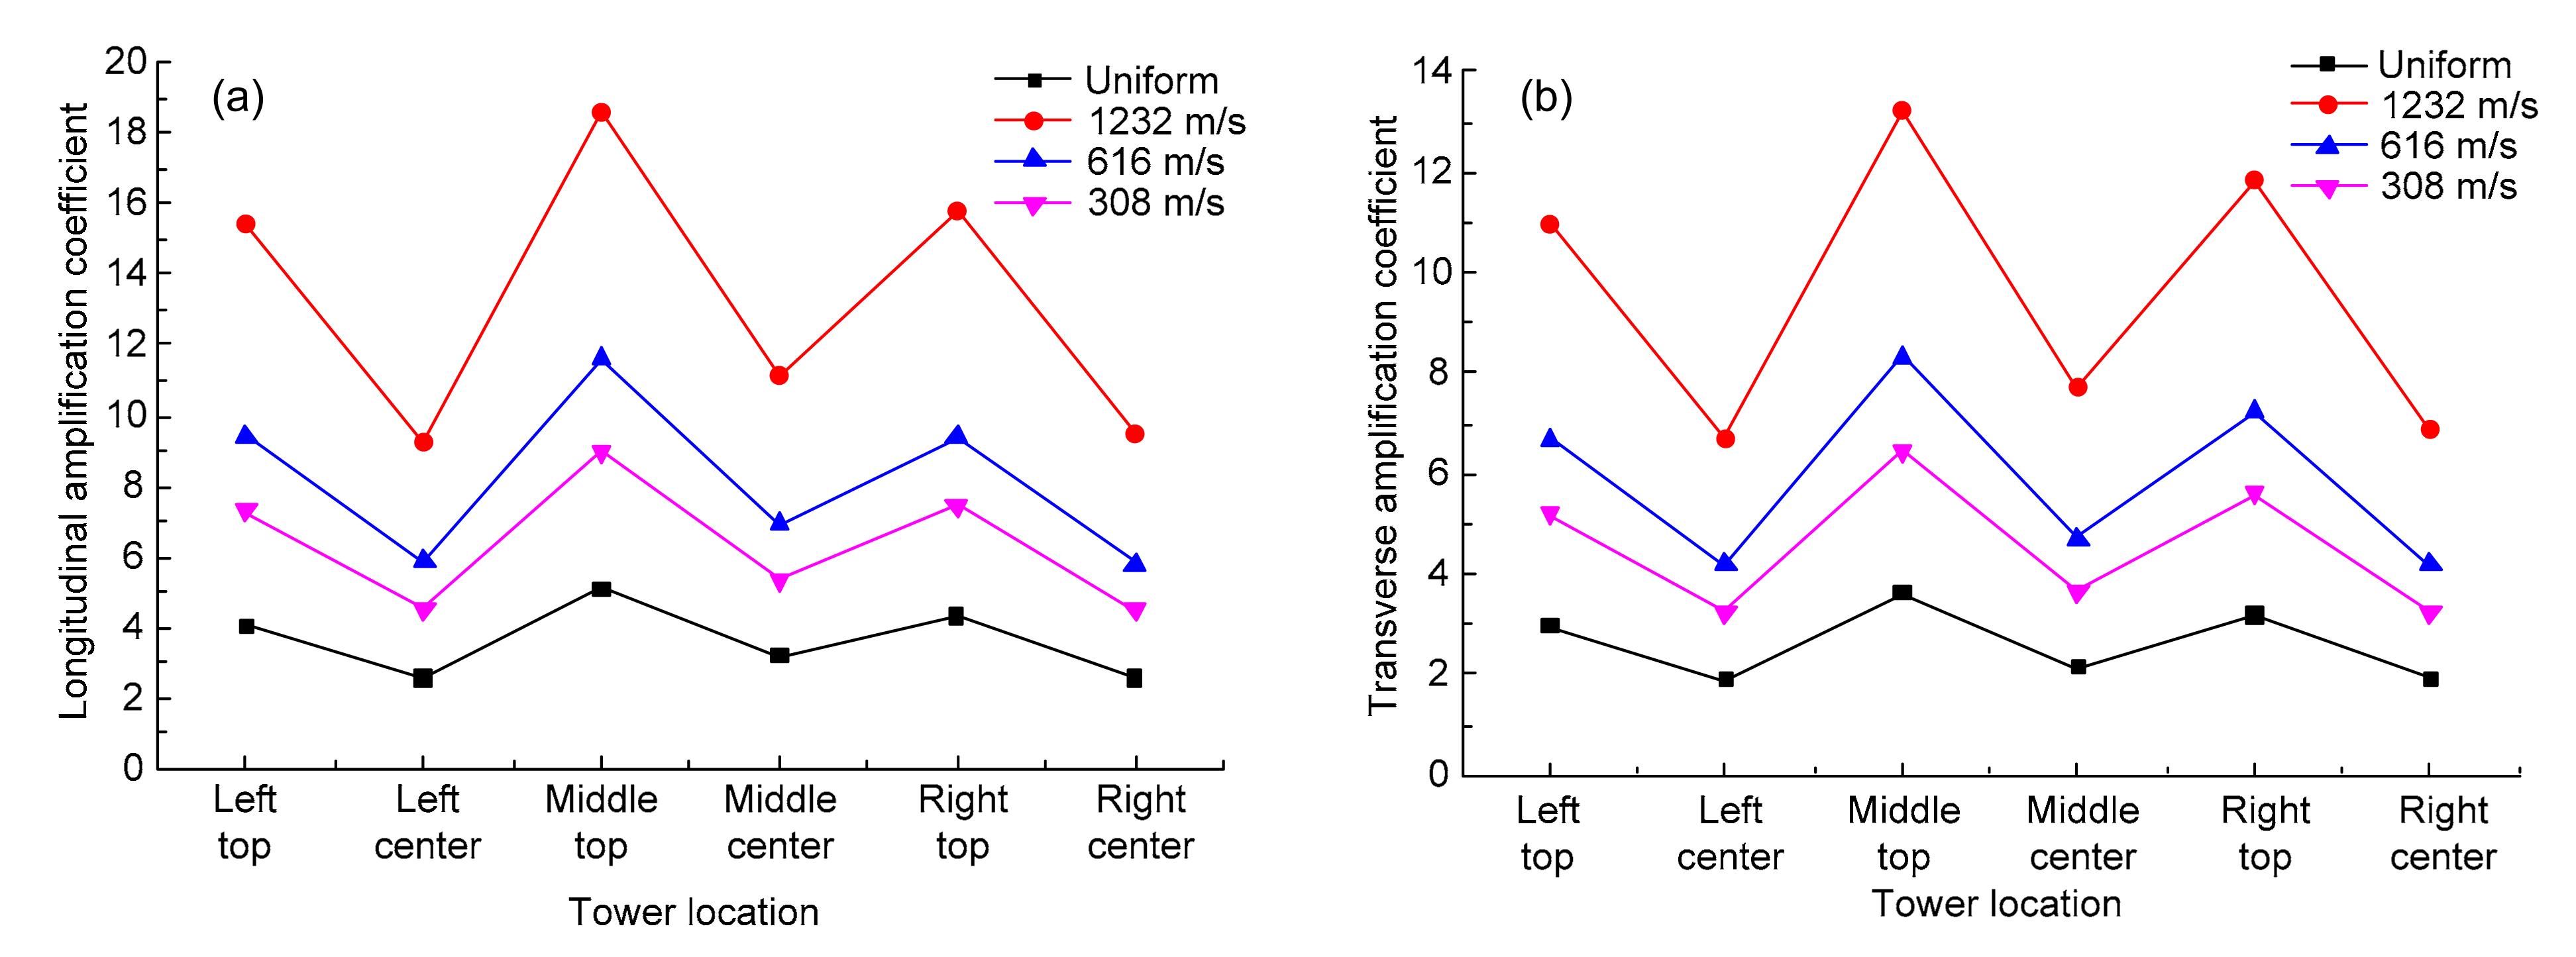
8). As the apparent wave velocity increases, the acceleration responses of the main towers become obviously larger, and the values in the longitudinal direction are larger than those in the transverse direction. For example, the longitudinal and transverse acceleration coefficients at the top position in the middle tower under a velocity of 1232 m/s are 18.58 and 13.23, respectively. The results suggest that the seismic performance of the main towers of the three-tower cable-stayed bridge is also markedly influenced by traveling wave effects. So the stiffness and strength of the main towers of the three-tower cable-stayed bridge should also be improved to withstand strong earthquakes.
Fig.8
Comparison of seismic responses of the towers under non-uniform excitations: (a) longitudinal amplification coefficients; (b) transverse amplification coefficients
3.3. Seismic responses of the scaled model under different intensities uniform excitations
As strong earthquakes have occurred worldwide in recent years, the characteristic and mechanism of failure mode of long span bridges under strong earthquake have attracted more attention (Chen et al.,
2008). If the intensity of input seismic waves grows, local failure of the long span cable-stayed bridge structure may occur, even causing progressive collapse. In this study, a scale model of a three-tower cable-stayed bridge was subjected to the amplitude of the EC wave with different intensities from 1.0 m/s
2 up to 4.0 m/s
2, and the seismic performance of the scale model was obtained by comparing the acceleration responses of the main girder and towers. When the acceleration peak value of the EC wave reached 4.0 m/s
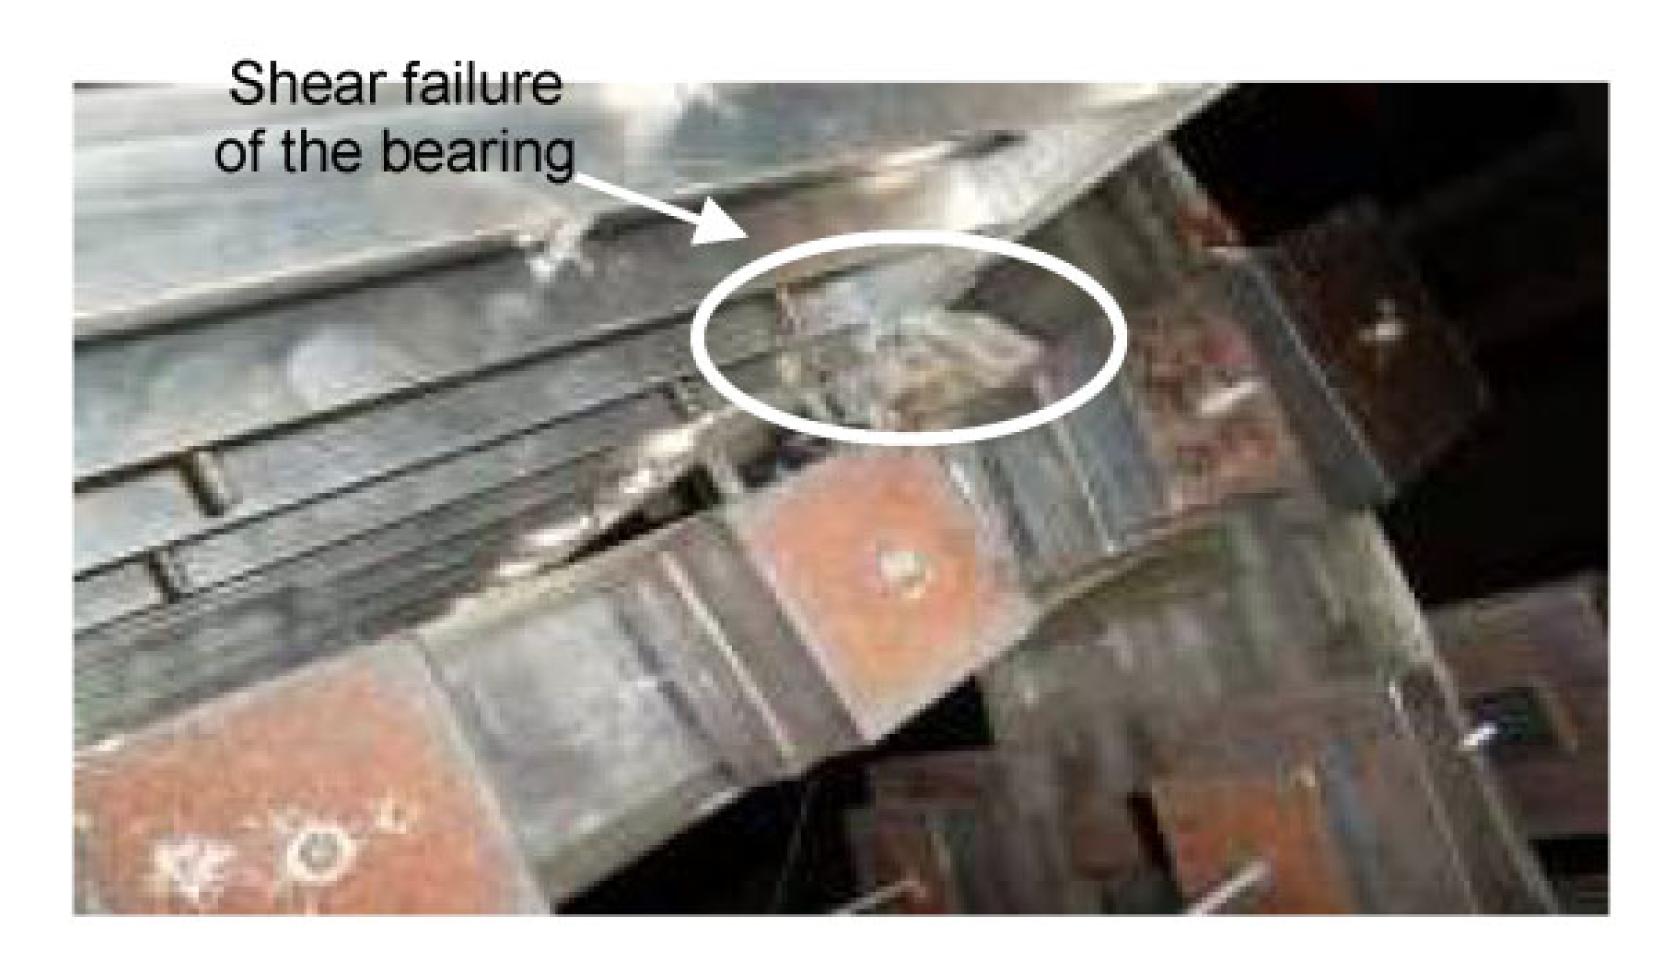
2, shear failure of the bearing of the middle tower occurred (Fig.
9). The phenomenon of a broken wire or cable was not observed during the tests.
Fig.9
Shear failure of the bearing in middle tower
3.3.1. Acceleration responses of the main girder
Acceleration amplification coefficients of the main girder under different excitation intensities are compared (Figs.
10a and 10b), and the corresponding time history curves of the largest response points of the main girder in vertical and transverse directions are described (Figs.
10c and 10d). The largest values of vertical amplification coefficients under amplitudes of 2.0 m/s
2, 3.0 m/s
2, and 4.0 m/s
2 are 4.81, 9.23, and 14.12, respectively. Similarly, the largest values of transverse amplification coefficients under the amplitudes of 2.0 m/s
2, 3.0 m/s
2, and 4.0 m/s
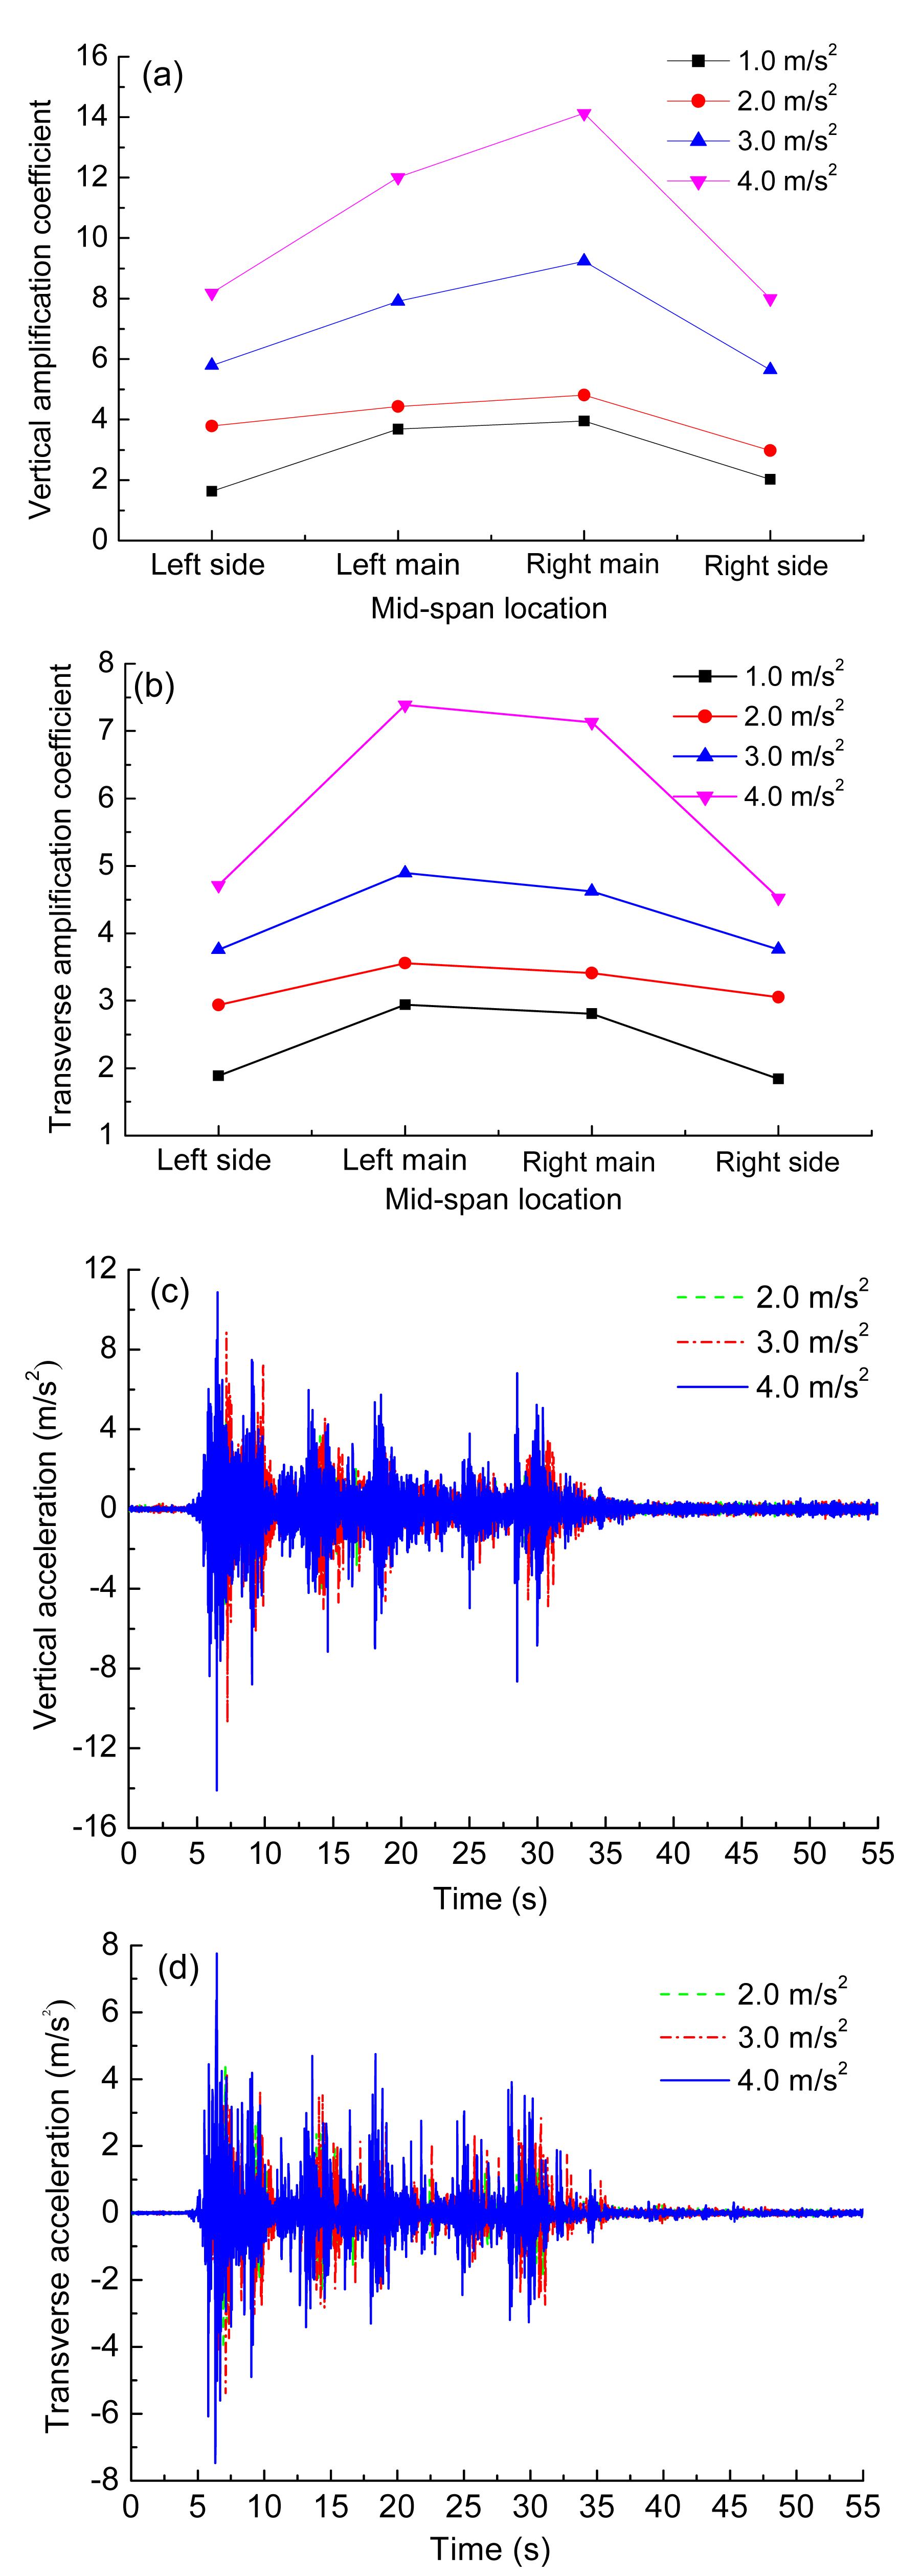
2 are 3.56, 4.89, and 7.39, respectively. The results indicate that the seismic responses of the main girder become larger with the intensity’s growth of input earthquake wave. It can be predicted that the shear failure of bearing components located in the middle tower may occur first under a strong earthquake, and then cable may rupture. Local component failure may have a negative impact on seismic performance, and may even cause progressive collapse of the whole bridge.
Fig.10
Comparison of seismic responses of the decks under different amplitudes: (a) vertical amplification coefficients; (b) transverse amplification coefficients; (c) vertical time history in the right main span; (d) transverse time history in the left main span
3.3.2. Acceleration responses of main towers
The acceleration responses of towers under different earthquake excitation intensities are compared (Fig.
11). The seismic responses of the main towers also become larger as the acceleration intensity increased. For example, when the acceleration of the input wave reaches 4.0 m/s
2, the longitudinal and transverse acceleration peak values at the top of the middle tower are 19.06 m/s
2 and 13.81 m/s
2, respectively. This may cause strong vibration of the cable strands and increase the vibration of the main girder.
Fig.11
Seismic responses of towers under different amplitudes: (a) longitudinal amplification coefficients; (b) transverse amplification coefficients
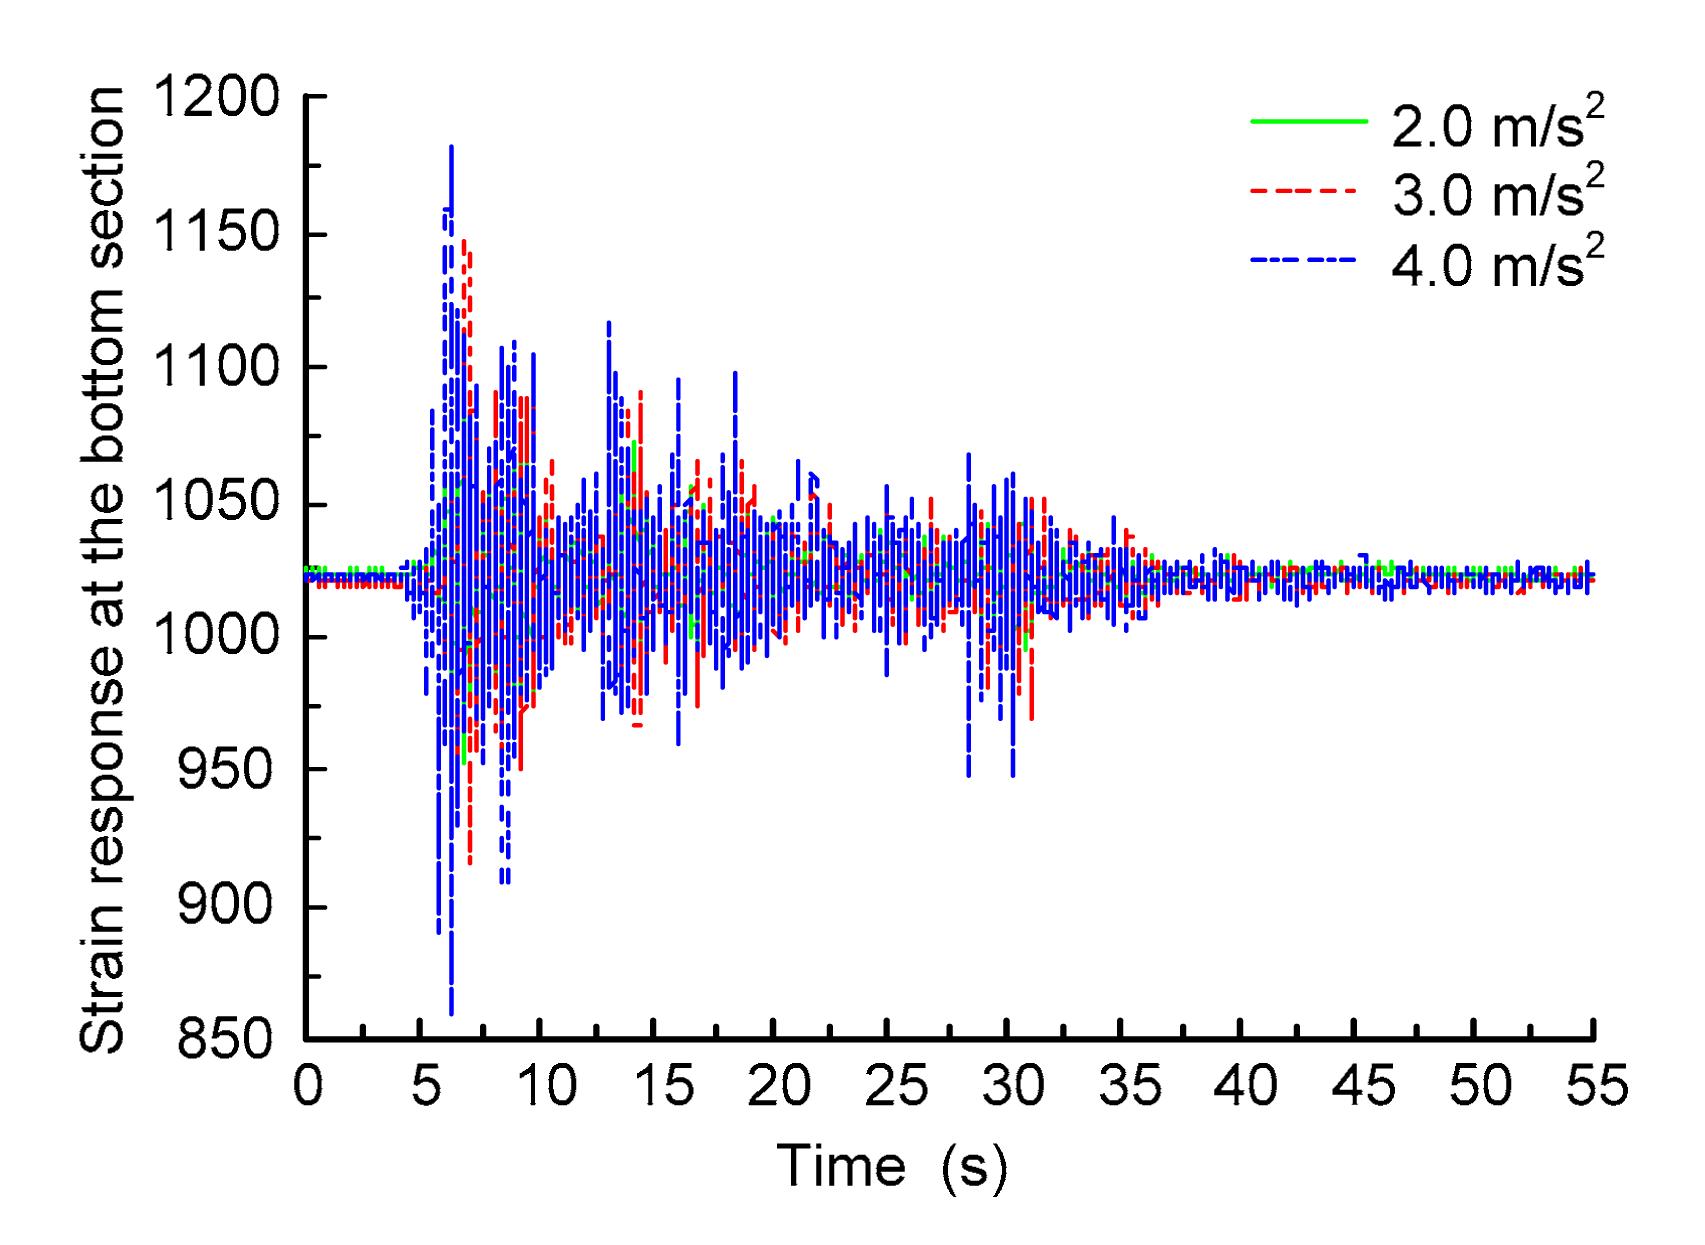
3.3.3. Strain responses of main towers
Fig.
12 shows the strain time history at the bottom of the middle tower under four input wave intensities. The peak values of strain under the amplitudes of 2.0 m/s
2, 3.0 m/s
2, and 4.0 m/s
2 are 1096.82, 1147.05, and 1188.32, respectively. The strain response law at the bottom section of the middle tower is consistent with the acceleration response of the middle tower. During the process of this test, the local failure did not appear in the main towers.
Fig.12
Strain responses of the middle tower under different amplitudes
4. Conclusions
In this paper, a 1:100 scale model of a three-tower cable-stayed bridge was designed and constructed for shaking table tests under multi-excitation. The following conclusions have been drawn from the study:
-
Under the same intensities of uniform excitations, the seismic responses of the main girder and towers under the JX wave excitation are the largest, followed by the HK wave and WC wave excitation. The responses from the EC wave are the smallest because of different frequency spectrum characteristics of input earthquake waves. The strongest vibration responses, including acceleration and dynamic displacement in the main girder and towers under horizontal excitations, were identified. The internal force responses at the bottom of the side piers are much smaller than those of the middle tower. These rules reveal that some necessary technical measures should be adopted to improve the stiffness of the main girder and the middle tower to enhance the seismic performance of multi-tower cable-stayed bridges.
-
Under non-uniform excitations, all acceleration amplification coefficients of the main girder and main towers are larger than those from uniform excitations. The seismic performance of the main girder and main towers of the scale cable-stayed bridge were obviously affected by traveling wave effects, especially when the wave velocity is larger than 616 m/s. It is suggested that traveling wave effects should be considered in the seismic design of multi-tower cable-stayed bridges.
-
Under different intensities of uniform excitations, the seismic responses of the main girder and main towers become larger with the growth of intensity of the input earthquake wave. When the acceleration peak value of the El-Centro wave arrived at 4.0 m/s2, shear failure of the bearing in the middle tower occurred. Local component failure may have a negative impact on the seismic performance of the multi-tower cable-stayed bridge.
-
This kind of shaking table tests will help to improve our understanding of the dynamic performance of multi-tower cable-stayed bridges subjected to spatially varying earthquake ground motions. In the future, numerical simulation and progressive collapse will be studied for comparison with experimental results.
* Project supported by the National Natural Science Foundation of China (Nos. 51178101 and 51378112), the Doctoral Program Project of the Ministry of Education (No. 20110092110011), and the National Key Laboratory of Civil Engineering Disaster Prevention of Tongji University (No. SLDRCE08-HZ-02), ChinaReferences
[1] Abdel-Ghaffar, A.M., Khalifa, M., 1991. Importance of cable vibration in dynamics of cable-stayed bridges.
Journal of Engineering Mechanics, 117(11):2571-2589.

[2] Chen, Y., Feng, M., Soyoz, S., 2008. Large-scale shake table test verification of bridge condition assessment methods.
Journal of Structural Engineering, 134(7):1235-1245.
[3] Fang, Y., Li, J.Z., Peng, T.B., 2011. Influence of traveling-wave effect on seismic response of a long-span multi-span cable stayed bridge.
Journal of Vibration and Shock, (in Chinese),29(10):148-152.
[4] Gattulli, V., Lepidi, M., 2007. Localization and veering in cable-stayed bridge dynamics.
Computer & Structures, 85(21-22):1661-1668.
[5] Gimsing, N.J., Georgakis, C.T., 2011. Cable Supported Bridges: Concept and Design. Wiley,Chichester, UK :150-160.
[6] Harris, H.G., Sabnis, G.M., 1999.
Structural Modeling and Experimental Techniques, CRC Press,:121-124.
[7] Huang, B.F., Lu, W.S., Zong, Z.H., 2008. Study on model experimental methodology utilizing the multiple earthquake simulation shake table system.
China Civil Engineering Journal, (in Chinese),41(3):46-52.
[8] Kawashima, K., Unjoh, S., Tunomoto, M., 1993. Estimation of damping ratio of cable-stayed bridges for seismic design.
ASCE Journal of Structural Engineering, 119(4):1015-1031.
[9] Kitazawa, M., Fujita, K., 1989. Seismic Test on Higashi-Kobe Bridge: Cable Stayed Bridge-using Scale Models.
Earthquake Behavior of Buried Pipelines, ASME Pressure Vessels and Piping Conference, 162:131
[10] Mylonakis, G., Papastamatiou, D., Psycharis, J., 2001. Simplified modeling of bridge response on soft soil to non-uniform seismic excitation.
ASCE Journal of Bridge Engineering, 6(6):587-597.
[11] Nazmy, A.S., Abdel-Ghaffar, A.M., 1990. Three-dimensional nonlinear static analysis of cable-stayed bridges.
Journal of Computers and Structures, 34(2):257-272.
[12] Nazmy, A.S., Abdel-Ghaffar, A.M., 1990. Nonlinear earthquake-response analysis of long-span cable-stayed bridges: theory.
International Journal of Earthquake Engineering and Structural Dynamics, 19(1):45-62.
[13] Nazmy, A.S., Abdel-Ghaffar, A.M., 1992. Effects of ground motion spatial variability on the response of cable-stayed bridges.
Earthquake Engineering & Structural Dynamics, 21:1-21.
[14] Raheem, S.E.A., Hayashikawa, T., Dorka, U., 2011. Ground motion spatial variability effects on seismic response control of cable-stayed bridges.
Earthquake Engineering and Engineering Vibration, 10(1):37-49.
[15] Ren, W.X., Makoto, O., 1999. Elastic-plastic seismic behavior of long span cable-stayed bridges.
ASCE Journal of Bridge Engineering, 4(3):194-203.
[16] Shoji, G., Kitahara, J., Kojima, A., 2008. Mechanism of seismic response of a PC cable-stayed bridge subject to a long-period seismic excitation.
Structural Engineering/Earthquake Engineering, 25(2):982-1001.
[17] Virlogeux, M., 2001. Bridges with multiple cable-stayed spans.
Structural Engineering International, 11(1):61-82.
[18] Yang, C.Y., Cheung, M., 2011. Shake table test of cable-stayed bridge subject to non-uniform excitation.
Procedia Engineering, 14:931-938.
[19] Zhang, C.L., 2009. Shaking Table Test for the Effect of Ground Motion Input to Seismic Response of Long-span Bridge. (in Chinese), Chongqing Jiaotong University,Chongqing, China :25-40.


Open peer comments: Debate/Discuss/Question/Opinion
<1>