Affiliation(s):
1.
Key Laboratory of Biomass Chemical Engineering of Ministry of Education, Institute of Industrial Ecology and Environment, Zhejiang University, Hangzhou 310027, China; moreAffiliation(s): 1.
Key Laboratory of Biomass Chemical Engineering of Ministry of Education, Institute of Industrial Ecology and Environment, Zhejiang University, Hangzhou 310027, China; 2.
Institute of Environmental Engineering, Zhejiang University, Hangzhou 310058, China; less
Yun Shi, Yin-feng Xia, Bi-hong Lu, Nan Liu, Lei Zhang, Su-jing Li, Wei Li. Emission inventory and trends of NOx for China, 2000–2020[J]. Journal of Zhejiang University Science A, 2014, 15(6): 454-464.
@article{title="Emission inventory and trends of NOx for China, 2000–2020", author="Yun Shi, Yin-feng Xia, Bi-hong Lu, Nan Liu, Lei Zhang, Su-jing Li, Wei Li", journal="Journal of Zhejiang University Science A", volume="15", number="6", pages="454-464", year="2014", publisher="Zhejiang University Press & Springer", doi="10.1631/jzus.A1300379" }
%0 Journal Article %T Emission inventory and trends of NOx for China, 2000–2020 %A Yun Shi %A Yin-feng Xia %A Bi-hong Lu %A Nan Liu %A Lei Zhang %A Su-jing Li %A Wei Li %J Journal of Zhejiang University SCIENCE A %V 15 %N 6 %P 454-464 %@ 1673-565X %D 2014 %I Zhejiang University Press & Springer %DOI 10.1631/jzus.A1300379
TY - JOUR T1 - Emission inventory and trends of NOx for China, 2000–2020 A1 - Yun Shi A1 - Yin-feng Xia A1 - Bi-hong Lu A1 - Nan Liu A1 - Lei Zhang A1 - Su-jing Li A1 - Wei Li J0 - Journal of Zhejiang University Science A VL - 15 IS - 6 SP - 454 EP - 464 %@ 1673-565X Y1 - 2014 PB - Zhejiang University Press & Springer ER - DOI - 10.1631/jzus.A1300379
Abstract: The rapid growth of NOx emissions in china is mainly due to intensive fossil fuel consumption. In order to control NOx emissions, a multiyear NOxemission inventory was established by a bottom-up approach for the period 2000–2010. The results showed that NOx emissions increased by 2.1 times from 11.81 million tons (Mt) in 2000 to 24.33 Mt in 2010. We found that NOx emissions had exceeded SO2 emissions in 2009 by comparison with their emission trends. We also found that the unbalanced NOx emissions in Eastern china and Western china are mainly due to the different gross regional product and industrial structure. Accounting for 70% of total energy consumption in china, coal is the largest NOx emission source among all the fossil fuels. In addition, the increased use of diesel and gasoline has spurred the increase of NOx emissions from the transportation sector. Manufacturing, electricity production, and transportation together composed about 90% of the national NOx emissions. Meanwhile, energy consumption and NOx emissions in china are predicted to be 3908.5 Mt standard coal equivalent (SCE) and 19.7 Mt in 2020 with this scenario analysis, respectively. To achieve a desired NOx reduction target, china should take strict measures to control NOx emissions, such as improvement in reduction technology, promulgation of new emission standards, and joint control by various Chinese provinces.
Darkslateblue:Affiliate; Royal Blue:Author; Turquoise:Article
Article Content
1. Introduction
Anthropogenic nitrogen oxides, mainly from the consumption of fossil fuels, have a series of complicated influences on tropospheric chemistry, leading to phenomena such as summer photochemical smog (Dimitriades, 1972; Rubio et al., 2002), the increase in urban and tropospheric ozone levels (Volz and Kley, 1988; Melkonyan and Wagner, 2013), acid deposition (Galloway, 1995; Sickles and Shadwick, 2007; Matsumoto et al., 2011), and the formation of nitrate aerosol (Kim et al., 2012). These are major concerns for ambient air quality and have broad impact on human health (Weschler, 2006). Due to the rapid growth of the economy between 2000 and 2010, China became the second largest economy in the world and experienced a rapid increase of energy consumption, which directly spurred the increase of NOx emissions. Consequently, China is the largest NOx emission country in Asia contributing 41%–57% of Asian NOx emissions (Streets and Waldhoff, 2000; Ohara et al., 2007; Klimont et al., 2009; Zhang et al., 2009), and has been suffering from severe environmental pollution and public health problems (Zhang Q.Y. et al., 2007; Kan et al., 2012). To control NOx emissions, a 10% cut of NOx emissions by 2015 has been listed as an obligatory target in the 12th Five-Year Plan (FYP, 2011–2015) of China (MEP, 2011), on the basis of conditions that exist in 2010.
To assess the impacts of NOx emissions on the troposphere and to develop practical strategies for NOx mitigation, detailed knowledge of emission loads, spatial environment and temporal distribution are required. Although several emission inventories for China have been established over the past decade (Streets and Waldhoff, 2000; Hao et al., 2002; Ohara et al., 2007; Zhang Q. et al., 2007; Cao et al., 2011; Saikawa et al., 2011), they are either out of date or just cover a short period. In this work, we carried out a multiyear NOx emission inventory by bottom-up approaches in China during the period 2000–2010, which described NOx emission variation, and we analyzed the contributions of NOx emissions by different fossil fuels, provinces, and economic sectors. The NOx emission trends over the period 2011–2020 are predicted by using scenario analysis approaches, and then some suggestions on sustainable development and NOx emission control are proposed.
2. Analysis methods and data sources
2.1. Bottom-up method
The NOx emissions estimated by bottom-up methods in this research only come from fossil fuel consumption from different economic sectors in China, including coal, coke, crude oil, gasoline, kerosene, diesel, residual oil, and natural gas. Gschwandtner et al. (1986) described the concept of the bottom-up method that we applied here. Our estimate of NOx emissions for China was developed with the widely used equations as given below (Hao et al., 2002; Streets et al., 2006; Klimont et al., 2009; Zhang et al., 2009): ,
,
,
,
where T represents the national NOx emissions of China, y represents the year, i represents the province, j represents the economic sector, k represents the fuel type, m represents the emission reduction technology type, E is China’s NOx emissions calculated as NO2, A is the activity levels, such as fuel consumption, ef is the emission factor weighted as NO2, R is the removal efficiency of the emission reduction technology, and X is the fraction of fuel for a sector j that is consumed by a specific technology m.
2.2. NOx emission factors of China
As China has promulgated a series of improved national emission standards for coal-fired power plants, industrial boilers, and vehicles, the NOx emission factors in China varied over the period 2000–2010. By selecting the appropriate emission factors, we multiplied the uncontrolled emission factors by removal efficiency, which is described in Eq. (2-4). The removal efficiency was valued as 20%–40% from 2000 to 2010 with an annual average growth rate, based on Hao et al. (2002) and the National Development and Reform Commission of China (NDRC, 2013). Emission factors for different economic sectors and fuel types are derived from a wide range of sources as summarized in Table 1.
Table 1
NOx emission factors* (kg NO2/t)
Fuel type
NOx emissions
Industry
Electricity
Transportation
Domestic use
Others
Coal
2.38–7.50
4.00–11.80
7.50
1.19–2.24
3.75
Coke
9.00
9.00
2.25
4.50
Crude oil
3.35–7.26
2.10–10.60
5.09
1.70
3.05
Gasoline
16.70
2.10–16.70
15.00–58.20
16.70
16.70
Kerosene
7.46
21.20
27.40
2.49
4.48
Diesel
9.62
2.10–8.54
13.24–58.20
3.21
5.77
Residual oil
5.84
2.10–10.06
27.40–54.10
1.95
3.50
Natural gas**
20.85–27.14
17.27–55.67
20.85
14.62
14.62
*These emission factors were summarized from (Hao et al., 2002; Streets et al., 2003; Ohara et al., 2007; Klimont et al., 2009; Zhao et al., 2010; Wang et al., 2011)
**Emission factors are in kg NO2/t, except for values of natural gas, which are in 10−4 kg NO2/m3
2.3. Activity levels of China and analysis uncertainty
The scope of the inventory includes all the administrative regions of China, except Hong Kong, Macau, and Taiwan, due to the lack of available data. Fossil fuel consumption data from each economic sector (including manufacturing, electricity, transportation, construction, domestic use, and others) and each province in the period 2000–2010 was obtained from the National Bureau of Statistics of China (NBS, 2000–2012), and the China Energy Statistical Yearbook (CESY) (DESNBS, 2000–2010). The accuracy of NOx emission estimates mainly depend on activity levels, source categories and emission factors. Due to the difficulty in data collection on energy consumption of small boilers, and emission factors in the manufacturing sectors, such as cement production, uncertainties may be introduced into the NOx emission inventory. The uncertainties of a bottom-up emission inventory of NOx in China have been comprehensively quantified by Zhao et al. (2011), who suggested that the uncertainties (95% confidence intervals around central estimates) of Chinese NOx emissions were estimated to be −13%–37%. In view of some arguments that the Chinese government probably underestimated the energy consumption during the period of 2000–2002 (Akimoto et al., 2006), we also used energy consumption data from various relevant literature (Zhang Q. et al., 2007; Zhao et al., 2011) to reduce any uncertainties.
2.4. Method for projected emissions
In modern society, each human individual poses a negative impact on the environment. The total negative impacts can be expressed by the IPAT (I: environmental impact; P: population; A: affluence; T: technology) equation, which was proposed by Ehrlich and Holdren (1971). It is a simple conceptual expression that the factors, such as population, economic growth, and technological change, create an environmental impact. We use the IPAT variants Eqs. (2-5) and (2-6) to project the future energy consumption and NOx emissions of China in different scenarios (Lu, 2009). ,
,
where b represents the base year, f represents the forecast year, g is the average annual growth rate of gross domestic product (GDP) between b and f, t is the average annual decline rate of energy consumption per unit of GDP between b and f, d is the average annual decline rate of NOx emissions per unit of GDP between b and f, D is the amount of energy consumption, and B is the amount of NOx emissions.
3. Results and discussion
3.1. Growth of NOx emissions, energy consumption, and GDP, 2000–2010
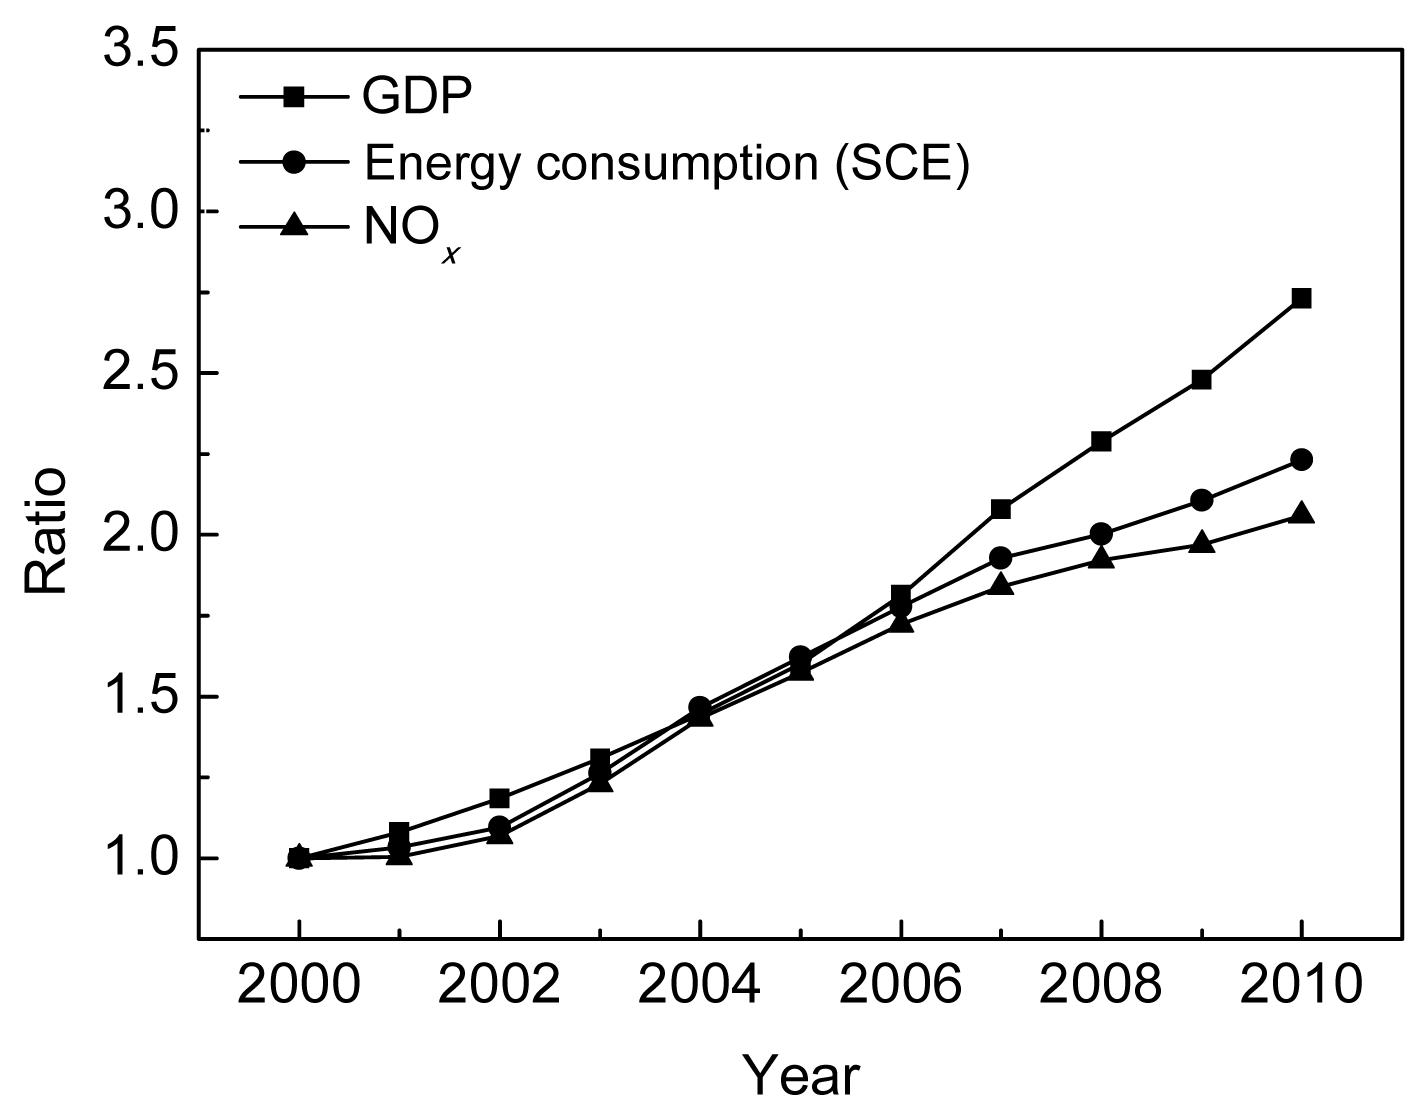
Table 2 summarizes the annual NOx emissions that were estimated by either bottom-up methods or top-down methods (satellite observation) in China for the period 2000–2010. The differences between our estimation and other researchers’ were due to the utilization of different data sources. China’s economy has been maintaining a dramatic growth rate since the late 1970s, accompanying with an increased use of fossil fuels. As a main pollutant from fossil fuel combustion, NOx has caused many environment problems and its emissions are growing annually in China. Fig. 1 shows the growth trends of GDP, energy consumption (calculated as standard coal equivalent (SCE)), and NOx emissions in China for the period 2000–2010. To rule out the impacts of alternative prices on environmental loads per unit of GDP in different years, GDP was calculated at constant prices for the year 2000. Chinese GDP increased dramatically by 2.7 times from 9921.4 billion CNY in 2000 to 27 095.6 billion CNY in 2010. At the same time, energy consumption in China grew by 2.2 times, which directly spurred the increase in NOx emissions. As a result, China’s NOx emissions increased rapidly by 2.1 times, increasing from 11.81 million tons (Mt) in 2000 to 24.33 Mt in 2010.
Fig.1 GDP growth trends, energy consumption and NOx emissions of China
Both energy consumption and NOx emissions per unit of GDP increased slightly in 2003, compared with those in 2002, as shown in Fig. 2. It can be explained by the fact that China had come out of the shadow of the Asian economic recession, and flung itself into another economic boom. The year-over-year growth rates for energy consumption and NOx emissions in 2003 were 15.3% and 15.1%, respectively, which was higher than that of the GDP (10.5%). The secondary industry shares for the GDP of China increased from 49.7% in 2002 to 58.5% in 2003, which was the highest share during the period 2000–2010. With the boom of energy-intensive secondary industries, including electricity, construction, and manufacturing, the energy consumption and NOx emissions increased significantly. However, in the long term, energy consumption and NOx emissions per unit of GDP decreased by 18.2% and 24.7% for the period 2000–2010, respectively. This is because the Chinese government has introduced a number of energy conservation and emission reduction policies, which accelerated the industrial restructuring process over the past years. For instance, compared with the secondary industries, the tertiary industries are a well-accepted and environmental friendly industries, whose share of China’s GDP increased from 39.0% in 2000 to 43.2% in 2010 (NBS, 2000–2012). These changes had a positive effect on reducing NOx emissions.
Fig.2 Energy consumption and NOx emissions per unit of GDP in China
3.2. Comparison of SO2 and NOx emissions
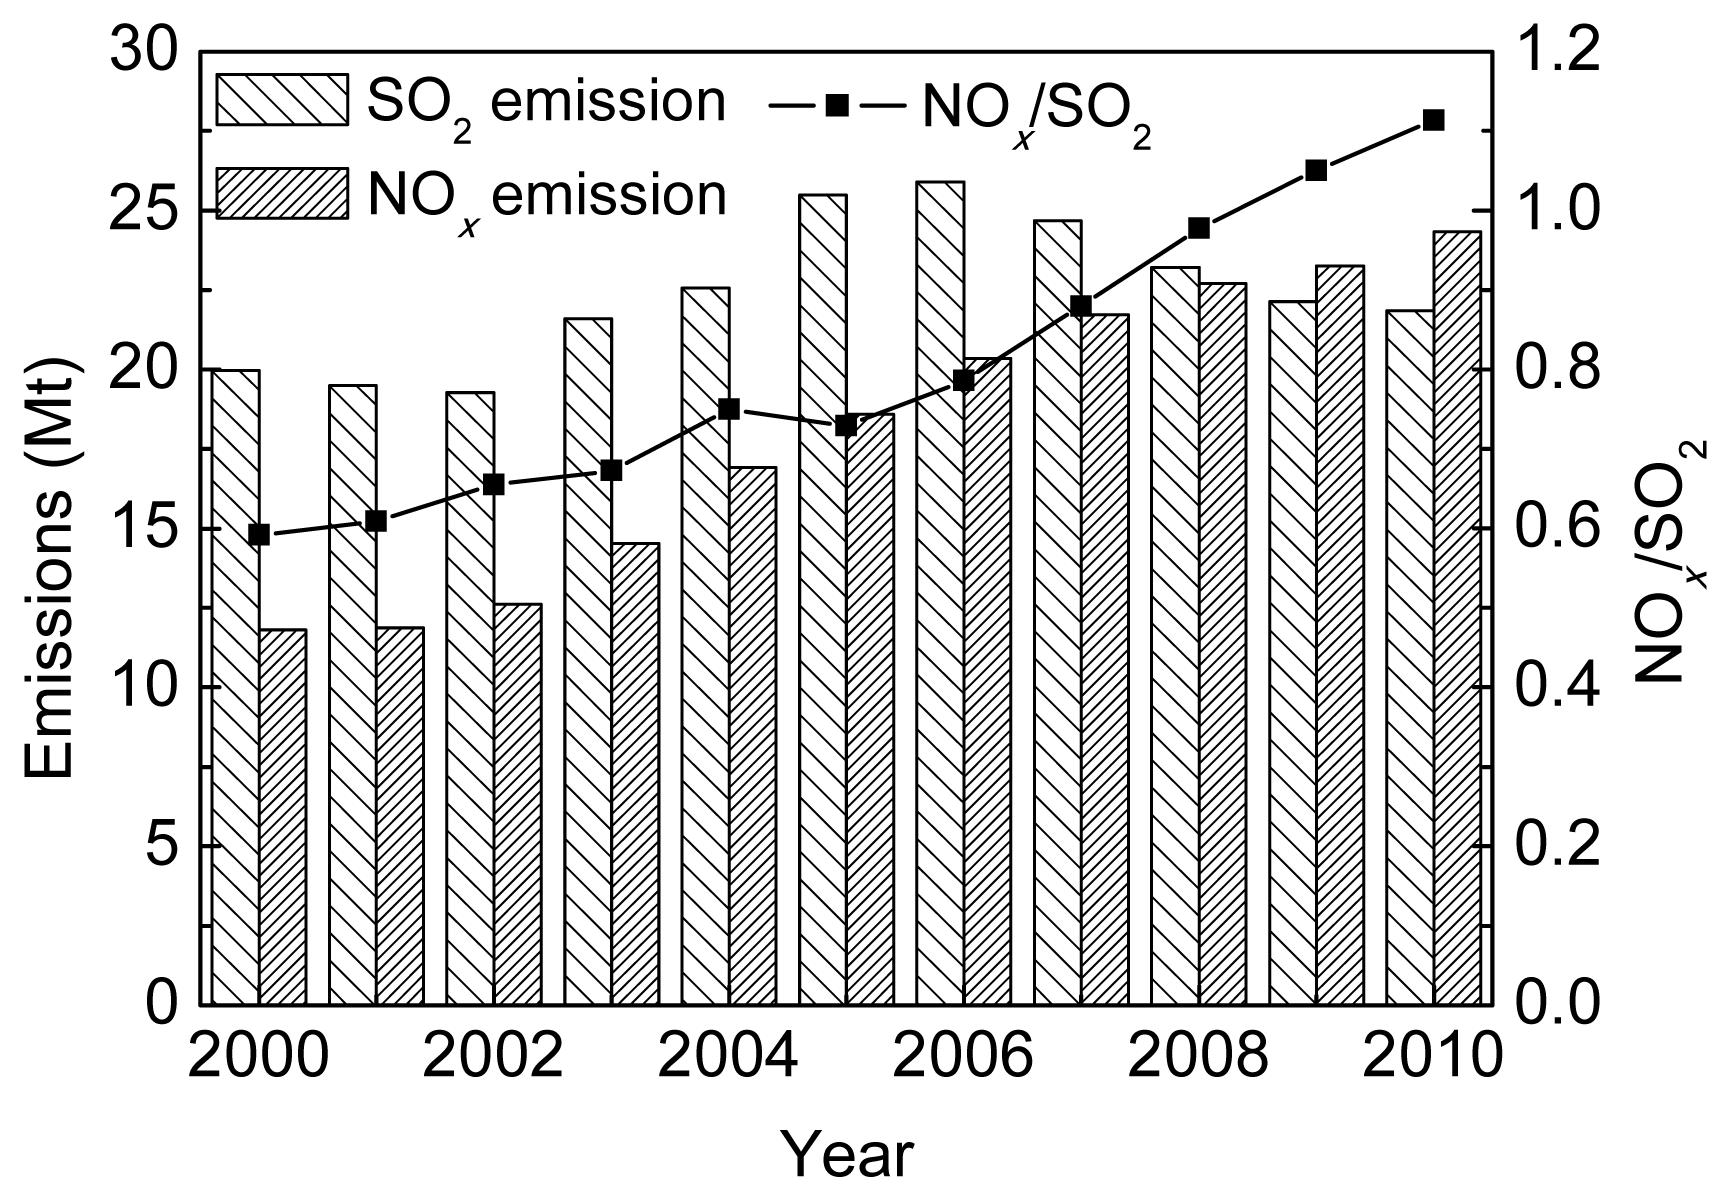
To control SO2 emissions, flue gas desulfurization (FGD) technology has been widely implemented in coal-fired power plants in China due to its high efficiency and reliability. The FGD penetration rate in coal-fired power plants was approximately 86% in 2010 (Schreifels et al., 2012). Therefore, the emissions of SO2 have been under effective control as shown in Fig. 3 (NBS, 2000–2012). On the other hand, the NOx emissions have increased over the past few years due to the lack of an effective control technology. It has been shown that NOx emissions had exceeded SO2 emissions in 2009, and the emission ratio of NOx to SO2 increased from 0.59 in 2000 to 1.11 in 2010 in China. This means that the achievements on curbing acid rain from reducing SO2 emissions are compromised by the increase in NOx emissions (Zhao et al., 2009). In addition, the type of acid rain in China may convert from sulfuric dominant into nitric dominant. As NOx can react with other pollutants to form a secondary pollution, such as photochemical smog and ground-level ozone, its impacts on the environment and human health may outstrip SO2 in China. Hence, the Chinese government should pay more attention to improving NOx emission control.
Fig.3 Comparison of SO2 and NOx emissions in China
3.3. NOx emission inventory of fossil fuels, 2000–2010
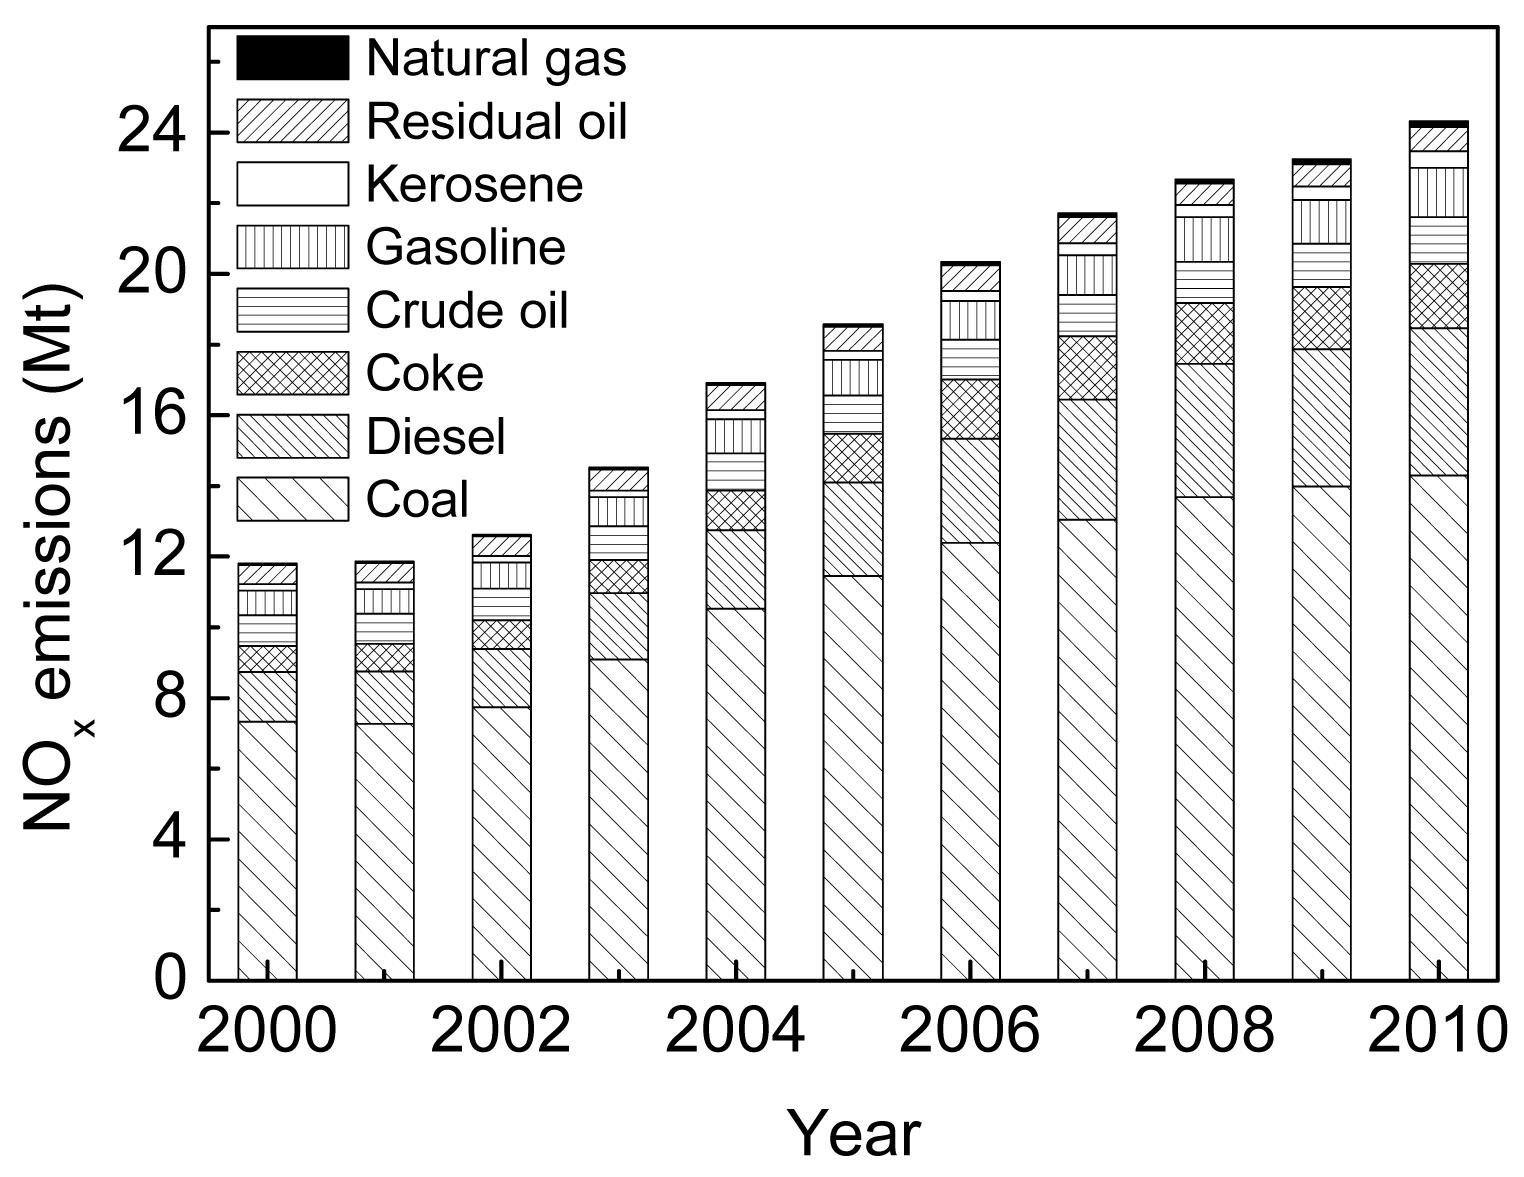
The NOx emissions from eight types of fossil fuels are presented in Fig. 4. Coal is the most important energy source in China, accounting for about 70% of the total energy consumption (DESNBS, 2000–2010). The combustion of coal produces abundant NOx, and becomes the biggest contributor for NOx emissions among all the fossil fuels. Coal consumption increased from 1245.37 Mt (SCE) in 2000 to 3122.36 Mt (SCE) in 2010 (NBS, 2000–2012). Meanwhile, NOx emissions from coal combustion almost doubled from 7.32 Mt in 2000 to 14.29 Mt in 2010, accounting for about 60% of the national total. With increased use of other types of fossil fuels, the share of NOx emissions from coal combustion slightly decreased from 62.0% in 2000 to 58.7% in 2010. Diesel was the second largest contributor for NOx emissions, followed by coke, crude oil, gasoline, residual oil, kerosene, and natural gas. NOx emissions from diesel and gasoline cars increased rapidly with the significant increase in the number of vehicles in China. From 2000 to 2010, NOx emissions from diesel and gasoline engines increased from 1.42 Mt and 0.69 Mt to 4.18 Mt and 1.39 Mt, respectively. The share of diesel engines as part of the national total for NOx rose from 12.0% to 17.2%, while the share of gasoline engines impact on NOx emissions declined slightly from 5.8% to 5.7% with effective control measures, such as the use of the three-way catalyst. Hence, the treatment of NOx from diesel engines has recently become a big challenge in China.
Fig.4 NOx emission inventory of fossil fuels in China
3.4. NOx emission inventory and the intensity of provinces, 2000–2010
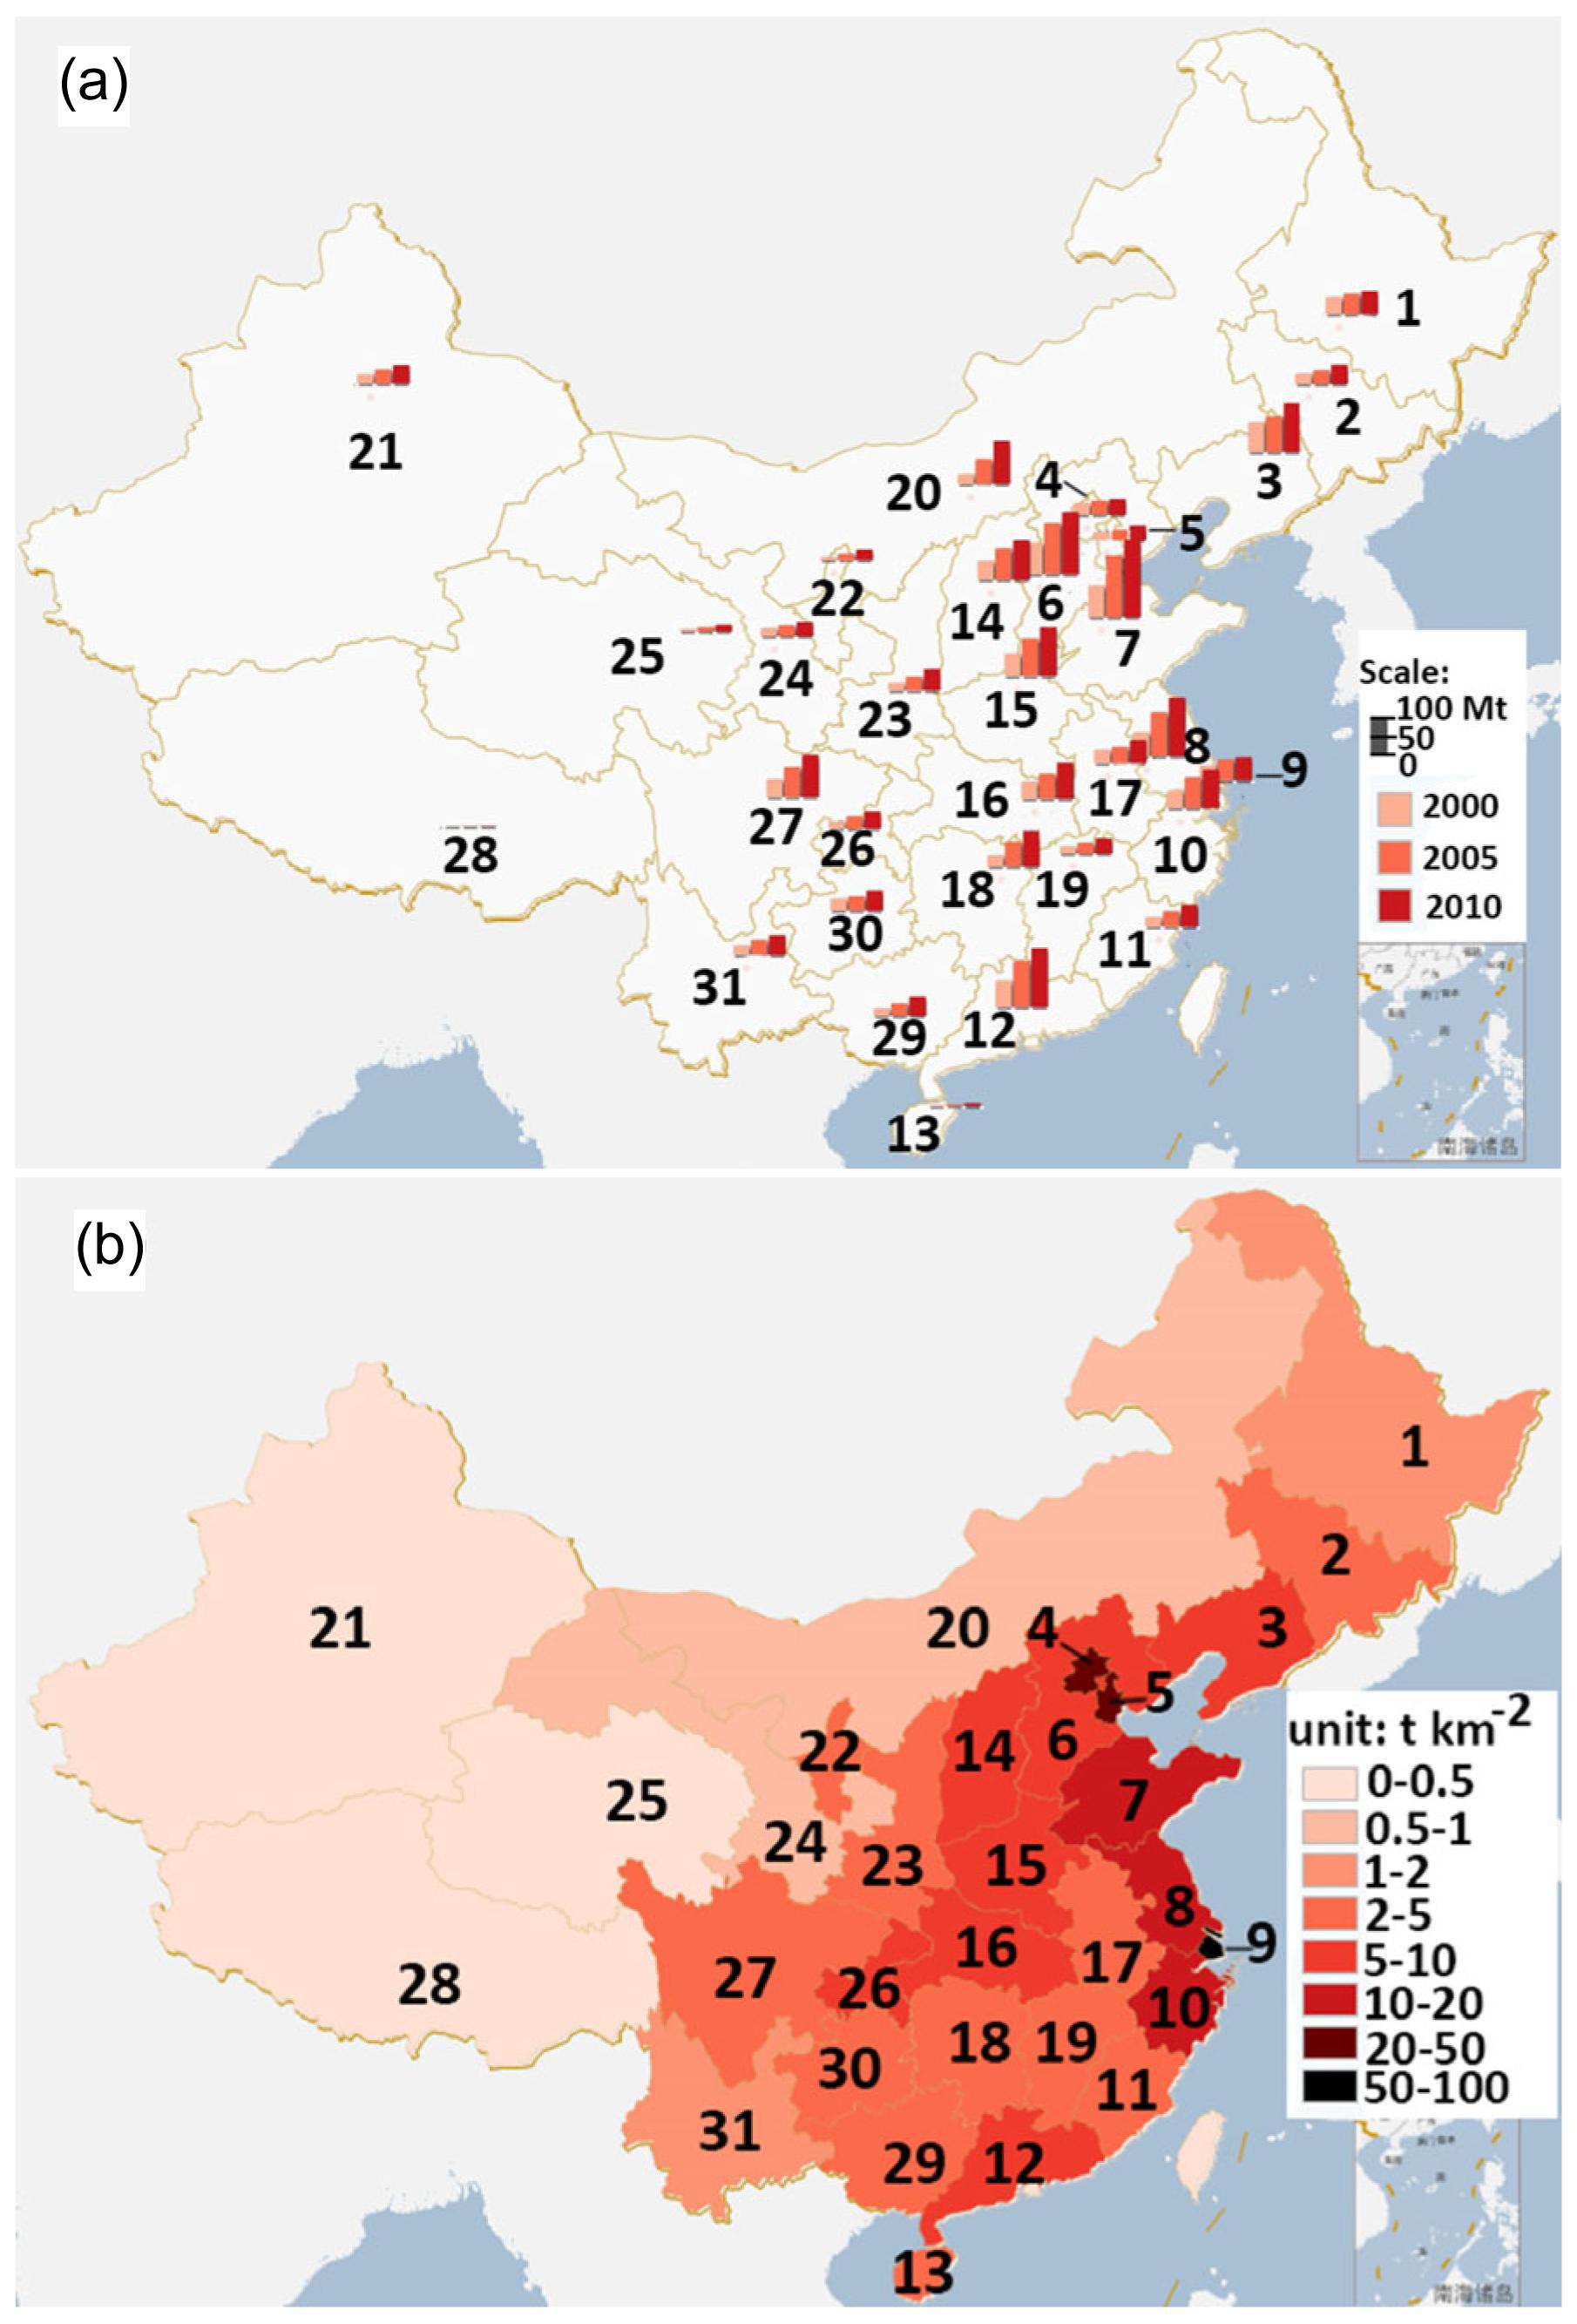
This study covered 31 administrative regions across mainland China. Hong Kong, Macao, and Taiwan were not included since detailed information from these areas was not available. Fig. 5a shows the NOx emission trends in different provinces in 2000, 2005, and 2010. All the provincial NOx emissions represent a growth trend. Due to the implementation of China’s Western Development Strategy since 2000, more factories and fossil-fuel power plants have been developed in the western provinces. Accordingly, the increase of NOx emissions in some western provinces was higher than that in the eastern provinces. NOx emissions in Inner Mongolia, Ningxia, and Shaanxi increased by 4.18, 3.15, and 2.78 times, respectively, while the national NOx emissions increased by 2.06 times from 2000 to 2010. Shandong, Hebei, Guangdong, Jiangsu, and Henan provinces were the five largest contributors to NOx emissions among all the 31 provinces. The NOx emissions for these five provinces were calculated as 2.09 Mt, 1.68 Mt, 1.59 Mt, 1.58 Mt, and 1.34 Mt in 2010, respectively, while Tibet only emitted about 0.03 Mt. In 2010, the five provinces that accounted for 38.9% of the national total GDP contributed to 34.0% of the national total NOx emissions while only occupying 8.2% of the total area. The unbalanced economic development is the primary cause of the unbalanced NOx emissions.
In 2010, the three lowest ratios of NOx emissions to gross regional product (GRP) in China were 3.03×10⁻⁴ kg/CNY for Beijing, 3.45×10⁻⁴ kg/CNY for Guangdong, and 3.70×10⁻⁴ kg/CNY for Shanghai, respectively. In the meantime, the three highest ratios were 17.20×10⁻⁴ kg/CNY for Ningxia, 13.26×10⁻⁴ kg/CNY for Qinghai and 11.69×10⁻⁴ kg/CNY for Guizhou, respectively. It can be seen that NOx emissions per unit of GRP in developed provinces, for instance Beijing, Shanghai and Guangzhou, is much lower than those in less developed provinces. The emission gap is mainly caused by different compositions of GRP. Taking Beijing’s GRP as an example, the tertiary industries contributed about 75.1%, while the primary and secondary industries account for 0.9% and 24.0%, respectively. In contrast, the tertiary industries only accounted for 41.6% of the GRP in Ningxia while 9.4% and 49.0% came from the primary and secondary industries (NBS, 2000–2012). It is well known that the tertiary industries produces less pollutants and are more environmentally-friendly. Hence, a higher proportion of tertiary industries in the industrial structure poses a positive effect on NOx emission control.
Fig. 5b shows the NOx emission intensity of each province in 2010. The regions with the most intensive NOx emission were located in the eastern China provinces that are more developed, such as Shanghai (100.00 t/(km2·y)), Tianjin (35.06 t/(km2·y)), Beijing (25.42 t/(km2·y)), Jiangsu (15.41 t/(km2·y)), Shandong (13.57 t/(km2·y)), and Zhejiang (10.13 t/(km2·y)). On the other hand, the western provinces are sparsely populated, less developed, and with relatively large undeveloped areas. The NOx emission intensity of these provinces was far less than that of the eastern provinces, for instance, Xinjiang (0.30 t/(km2·y)), Qinghai (0.25 t/(km2·y)), and Tibet (0.03 t/(km2·y)). High NOx emission intensity resulted in poor air quality since NOx is one of the main causes of haze. Many big cities in central and eastern China have frequently suffered from haze in winter. Consequently, health issues resulting from haze have aroused wide spread public attention in recent years. The hazardous dense haze, covering most parts of central and eastern China in January 2013, has enveloped a total of 1.4 million square kilometers of China (MEP, 2013). These regions are those with high NOx emission intensity, such as Beijing, Tianjin, Hebei, Henan, Shandong, Jiangsu, etc. This illustrates that haze is closely related to the severe intensities of NOx emissions. To improve ambient air quality in China, NOx emission reduction is drastically needed. In consideration of the widespread pollution sources, it is best to have joint control of NOx emissions by all the provinces.
3.5. NOx emission inventory of economic sectors, 2000–2010
NOx emissions from all the main economic sectors have been increasing for the past ten years. Manufacturing, electricity, and transportation were the three largest contributors, which together compromised about 90% of the national NOx emissions as shown in Fig. 6. Manufacturing that was the largest NOx emission source, emitted 8.34 Mt NOx in 2010, which was 1.9 times than that in 2000. The rapid and sustainable development of the national economy has resulted in an increasing demand for power during the past decade. Moreover, it is reported that thermal power consumption accounted for 80% of the national total electricity production (NBS, 2000–2012). Hence, the electricity sector that was the second largest contributor for NOx emissions emitted 7.85 Mt NOx in 2010, which was 2.0 times the total NOx emissions in 2000, as shown in Table 3.
Fig.6 Economic sector shares on NOx emissions in 2000, 2005, and 2010
Table 3
NOx emission inventory by economic sectors (unit: Mt)
Year
NOx emissions
Manufacture
Electricity
Transportation
Mining
Domestic use
Construction
Others
Total
2000
4.36
3.91
2.14
0.65
0.18
0.08
0.49
11.81
2001
4.26
3.97
2.21
0.66
0.18
0.08
0.50
11.86
2002
4.40
4.38
2.39
0.67
0.19
0.09
0.51
12.62
2003
5.01
5.09
2.74
0.87
0.20
0.09
0.51
14.53
2004
6.03
6.00
3.30
0.68
0.22
0.10
0.59
16.92
2005
6.62
6.47
3.74
0.80
0.23
0.11
0.60
18.59
2006
7.18
7.14
4.22
0.83
0.24
0.12
0.62
20.35
2007
7.47
7.57
4.79
0.91
0.25
0.12
0.62
21.72
2008
7.92
7.57
5.17
0.98
0.36
0.12
0.58
22.69
2009
8.03
7.77
5.31
1.04
0.39
0.13
0.59
23.26
2010
8.34
7.85
5.80
1.13
0.43
0.15
0.63
24.33
Fig. 7 shows the NOx emissions for the transportation sector, which increased by 2.7 times from 2000 to 2010, due to the rapid increase of vehicles in China. The number of vehicles increased from 16.1 million in 2000 to 78.0 million in 2010 (NBS, 2000–2012). Consequently, fuel consumption has increased significantly in this ten-year-period, which resulted in the dramatic increase of NOx emissions. NOx emissions from the transportation sector were 5.80 Mt in 2010, which made up of about 23.8% of the national total.
Fig.7 Transportation NOx emissions and possession of civilian vehicles in China
To control NOx emissions, China has promulgated a series of emission standards for thermal power plants as illustrated in Table 4. With the implementation of improved emission standards in 2004, NOx emissions from the electricity sector decreased by 2.5% during the period 2005–2010 as shown in Fig. 6.
Table 4
Emission standard for air pollutions from thermal power plants in China
It can be predicted that the electricity sector’s share on total NOx emissions will decrease sharply when the emission standard for air pollutions from thermal power plants in China (GB 13223–2011) is implemented, as the NOx emission limitation of a coal-fired boiler is 100 mg NO2/m3 in GB 13223–2011, less than 1/6 of that in GB 13223–2003.
Although China has improved its vehicle emission standards for the past decade, the transportation share of NOx emissions increased from 18.1% in 2000 to 23.8% in 2010. This is due to the remarkable increase of vehicles in China. The number of civilian vehicles exceeded 100 million units in 2012. This indicates that diesel and gasoline consumption will be on the rise with the increase in the number of vehicles. We can predict that the transportation share of NOx emissions will continue to increase. The rapid increase of vehicle numbers has aroused the Chinese government’s attention. It is believed that the growth rate of transportation NOx emissions will slow down with the implementation of more stricter vehicle emission standards (Euro V, even Euro VI in the future) and automobile purchase restrictions in big cities in China (such as Beijing, Tianjin, and Shanghai).
As the manufacturing industry is made up of many different production sectors, its waste gas has the following characteristics: widely distributed emission sources, small-scale, complex chemical components, and various physical conditions. Therefore, it is harder to control NOx emissions from manufacturing than from electricity and transportation. Existing reduction technologies such as selective catalytic reduction (SCR) and selective non-catalytic reduction (SNCR) cannot treat manufacturing waste gas effectively. Manufacturing’s share of NOx emissions is expected to increase in the future if NOx emissions from the electricity and transportation sectors are kept under control. Hence, new control techniques need to be developed to treat NOx emissions from the manufacturing sector.
3.6. Prediction of future NOx emissions
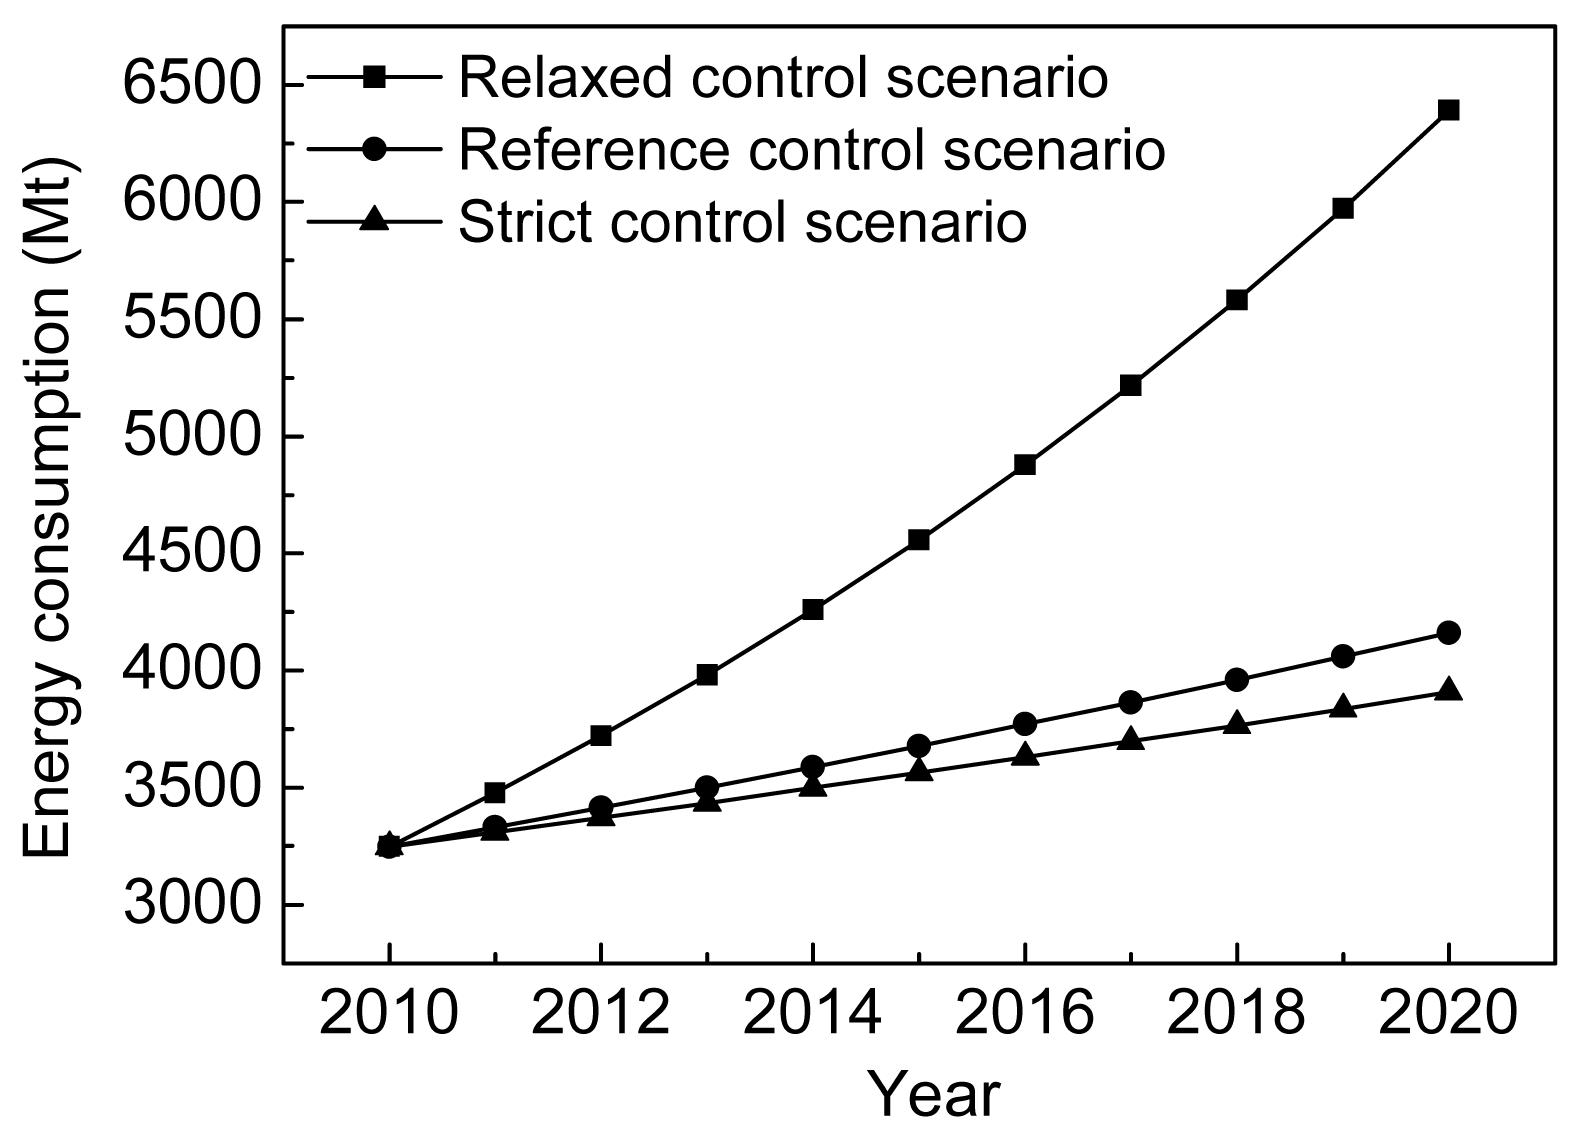
We designed three different scenarios to analyze the NOx emission trends in China for the period 2011–2020, including a relaxed control scenario, a reference control scenario, and a strict control scenario. The relaxed control scenario assumes that the energy structure and NOx control levels are the same as that in 2010, which means the energy consumption and NOx emissions per unit of GDP will not change between 2011 and 2020 (t=0, d=0, where t is the average annual decline rate of energy consumption per unit of GDP and d is the average annual decline rate of NOx emissions per unit of GDP). The reference scenario assumes that the progress of reduction technology innovation and energy structure adjustment are the same as that during the period 2005–2010. As a result, the average annual decline rates of energy consumption and NOx emissions per unit of GDP have the same values as those during the period 2005–2010 (t=0.042, d=0.052), respectively. The strict control scenario assumes Chinese government will implement NOx control strategies strictly as described in the 12th FYP (t=0.048, d=0.085). The Chinese government will promulgate a series of strict emission standards and promote the application of NOx reduction technology, including a low NOx burner (LNB), over fire air (OFA), SCR, and SNCR. For example, all the thermal power plants will need to be equipped with SCR to meet the new NOx emission standards of 2011.
The average annual growth rate of GDP for all the three scenarios was derived from the Report to the Eighteenth National Congress of the Communist Party of China and 12th FYP (g=0.07–0.075). The values of the other parameters were based on each scenario under different control levels.
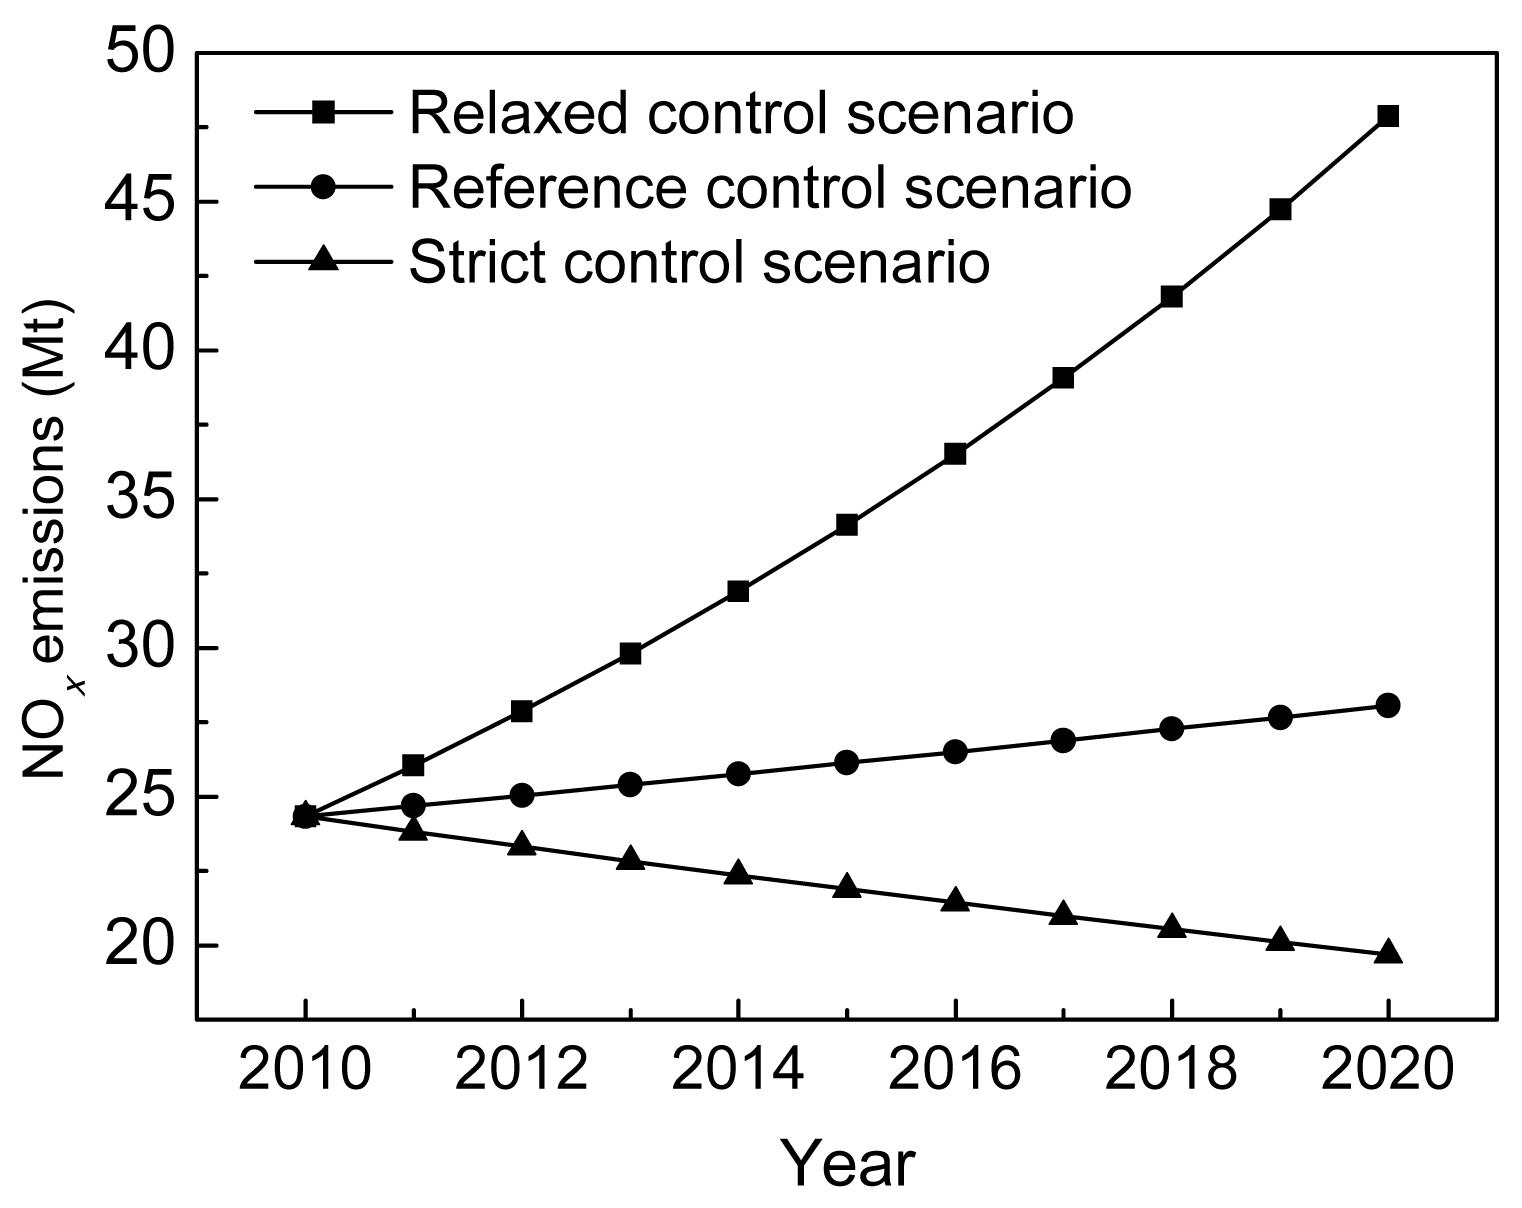
The predicted results are summarized in Fig. 8 and Fig. 9, which were calculated using Eqs. (2-5) and (2-6). Energy consumption calculated as SCE for all scenarios will continue to increase to meet the demand for economic growth, reaching 6392.0 Mt (SCE), 4161.9 Mt (SCE), and 3908.5 Mt (SCE) by 2020, respectively. The great demand for energy has caused energy shortages in China. Without further actions on energy conservation policies, like the relaxed control scenario, energy consumption will double during the period 2010–2020, which could aggravate the energy crisis. Consequently, China should strengthen supervision on energy-intensive industries, improve energy efficiency, and promote the utilization of renewable energy.
Fig.8 Prediction of energy consumption (calculated as SCE) in China, 2011–2020
Fig.9 Prediction of NOx emissions in China, 2011–2020
Under the relaxed control scenario and reference control scenario, NOx emissions are expected to raise to 47.9 Mt and 28.1 Mt by 2020, respectively. In theory, under a strict control scenario, NOx emissions would drop to 21.9 Mt by 2015, about 90% of NOx emissions in 2010, and 19.7 Mt by 2020. This indicates that China should take strict measures on NOx emission control to achieve the reduction target of a 10% cut as included in the 12th FYP. In this case, the removal efficiency of national NOx should reach 61.5% by 2015. However, early policies were unsuccessful at reducing NOx emissions. In fact, the NOx emissions in 2011 increased by 5.73% compared with that in 2010 as reported by MEP (2012). The emission factors of cement (Lei et al., 2011) and heavy-duty vehicles (Wu et al., 2012) even increased over the past decade. Hence, to achieve the NOx reduction target of the 12th FYP, the Chinese government is facing a big challenge on reducing NOx emissions over the next years. It is quite necessary to combine the following strategies: improvement of the reduction technology, transformation of the economic growth pattern, and strict administrative intervention.
4. Conclusions
This work aims to investigate the emission status of NOx during the period 2000–2010 and predict the future trends for the period 2011–2020 in China. Although NOx emissions per unit of GDP decreased by 24.7% during the period 2000–2010, China’s NOx emissions increased by 2.1 times and reached 24.33 Mt in 2010. The growth of NOx emissions is changing the composition of acid rain in China. Among the national total NOx emissions, about 60% came from coal consumption, so reducing coal consumption in fire power plants and industrial boilers will provide remarkable mitigations of NOx emissions. As diesel and gasoline consumption increased year by year, its NOx emission reductions should not be ignored. NOx emissions in the eastern provinces are much higher than that in the western provinces. The unbalanced NOx emissions resulted from the unbalanced economic development in the two regions. When it comes to economic sectors, manufacturing was the biggest contributor for NOx emissions, followed by electricity and transportation. With the implementation of new emission standards for air pollution from thermal power plants in China since 2013, the electricity share of NOx emissions will decrease, resulting in the sharp increase in the manufacturing and transportation shares. Hence, in consideration of the complex types of manufacturing NOx emissions, the Chinese government should focus on the treatment of manufacturing waste gas in the future. In order to achieve a 10% cut in NOx emissions in the 12th FYP (2011–2015) of China, it is necessary to take strict control measures to reduce NOx emissions. If so, the removal efficiency of national NOx should reach 61.5% in 2015.
[1] Akimoto, H., Ohara, T., Kurokawa, J., 2006. Verification of energy consumption in China during 1996–2003 by using satellite observational data. Atmospheric Environment, 40(40):7663-7667.
[2] Cao, G.L., Zhang, X.Y., Gong, S.L., 2011. Emission inventories of primary particles and pollutant gases for China. Chinese Science Bulletin, 56(8):781-788.
[3] DESNBS (Department of Energy Statistics, National Bureau of Statistics of China), 20002010. China Energy Statistical Yearbook 20002010 (CESY). (in Chinese), China Statistics Press,Beijing, China :
[4] Dimitriades, B., 1972. Effects of hydrocarbon and nitrogen oxides on photochemical smog formation. Environmental Science & Technology, 6(3):253-260.
[5] Ehrlich, P.R., Holdren, J.P., 1971. Impact of population growth. Science, 171(3977):1212-1217.
[6] Galloway, J.N., 1995. Acid deposition: perspectives in time and space. Water, Air, & Soil Pollution, 85(1):15-24.
[7] GB 132231996, . Emission standard of air pollutants for thermal power plants. (in Chinese), China Environmental Science Press,Beijing, China :
[10] Gschwandtner, G., Gschwandtner, K., Eldridge, K., 1986. Historic emissions of sulfur and nitrogen oxides in the United States from 1900–1980. Journal of the Air Pollution Control Association, 36(2):139-149.
[11] Hao, J.M., Tian, H.Z., Lu, Y.Q., 2002. Emission inventories of NOx from commercial energy consumption in China, 1995–1998. Environmental Science & Technology, 36(4):552-560.
[12] Kan, H.D., Chen, R.J., Tong, S.L., 2012. Ambient air pollution, climate change, and population health in China. Environment International, 42:10-19.
[13] Kim, M.J., Park, R.J., Kim, J.J., 2012. Urban air quality modeling with full O3-NOx-VOC chemistry: implications for O3 and PM air quality in a street canyon. Atmospheric Environment, 47:330-340.
[14] Klimont, B.Z., Cofala, J., Xing, J., 2009. Projections of SO2, NOx and carbonaceous aerosols emissions in Asia. Tellus Series B Chemical and Physical Meteorology, 61(4):602-617.
[15] Lei, Y., Zhang, Q., Nielsen, C., 2011. An inventory of primary air pollutants and CO2 emissions from cement production in China, 1990–2020. Atmospheric Environment, 45(1):147-154.
[16] Lu, Z.W., 2009. The Foundations of Industrial Ecology. (in Chinese), Science Press,Beijing, China :34-47.
[17] Matsumoto, K., Tominaga, S., Igawa, M., 2011. Measurements of atmospheric aerosols with diameters greater than 10 μm and their contribution to fixed nitrogen deposition in coastal urban environment. Atmospheric Environment, 45(35):6433-6438.
[18] Melkonyan, A., Wagner, P., 2013. Ozone and its projection in regard to climate change. Atmospheric Environment, 67:287-295.
[19] MEP (Ministry of Environmental Protection of the Peoples Republic of China), 2011. The 12th Five-year Plans comprehensive work plan for energy conservation and emission reduction in China, Available from
http://zfs.mep.gov.cn/fg/gwyw/201109/t20110907_217069.htm,[Accessed on May 18, 2014],(in Chinese),:
[20] MEP (Ministry of Environmental Protection of the Peoples Republic of China), 2012. 2011 report on the state of environment in China, Available from
http://jcs.mep.gov.cn/hjzl/zkgb/2011zkgb/,[Accessed on Feb. 1, 2014],(in Chinese),:
[21] MEP (Ministry of Environmental Protection of the Peoples Republic of China), 2013. The state of urban air quality in January 30, 2013, Available from , :
[22] NBS (National Bureau of Statistics of China), 20002012. China Statistical Yearbook 20002012. (in Chinese), China Statistics Press,Beijing, China :
[24] NDRC (National Development and Reform Commission of China), 2013. Expand the pilot scope of coal-fired plants electricity price after control NO emissions, Available from
http://www.ndrc.gov.cn/xwzx/xwfb/201301/t20130109_522666.html,[Accessed on May 18, 2014],(in Chinese),:
[25] Ohara, T., Akimoto, H., Kurokawa, J., 2007. An Asian emission inventory of anthropogenic emission sources for the period 1980–2020. Atmospheric Chemistry and Physics, 7(16):4419-4444.
[26] Rubio, M.A., Lissi, E., Villena, G., 2002. Nitrite in rain and dew in Santiago city, Chile. Its possible impact on the early morning start of the photochemical smog. Atmospheric Environment, 36(2):293-297.
[27] Saikawa, E., Kurokawa, J., Takigawa, M., 2011. The impact of China’s vehicle emissions on regional air quality in 2000 and 2020: a scenario analysis. Atmospheric Chemistry and Physics, 11(18):9465-9484.
[28] Schreifels, J.J., Fu, Y., Wilson, E.J., 2012. Sulfur dioxide control in China: policy evolution during the 10th and 11th Five-year Plans and lessons for the future. Energy Policy, 48:779-789.
[29] Sickles, J.E., Shadwick, D.S., 2007. Changes in air quality and atmospheric deposition in the eastern United State: 1990–2004. Journal of Geophysical Research, 112:D17301
[30] Streets, D.G., Waldhoff, S.T., 2000. Present and future emissions of air pollutants in China: SO2, NOx, and CO. Atmospheric Environment, 34(3):363-374.
[31] Streets, D.G., Bond, T.C., Carmichael, G.R., 2003. An inventory of gaseous and primary aerosol emissions in Asia in the year 2000. Journal of Geophysical Research, 108(D21):8809
[32] Streets, D.G., Zhang, Q., Wang, L.T., 2006. Revisiting China’s CO emissions after the transport and chemical evolution over the pacific (TRACE-P) mission: synthesis of inventories, atmospheric modeling, and observations. Journal of Geophysical Research, 111:D14306
[33] Volz, A., Kley, D., 1988. Evaluation of the montsouris series of ozone measurements made in the nineteenth century. Nature, 332(6161):240-242.
[34] Wang, S.W., Zhang, Q., Streets, D.G., 2012. Growth in NOx emissions from power plants in China: bottom-up estimates and satellite observations. Atmospheric Chemistry and Physics, 12(10):4429-4447.
[35] Wang, S.X., Xing, J., Chatani, S., 2011. Verification of anthropogenic emissions of China by satellite and ground observations. Atmospheric Environment, 45(35):6347-6358.
[36] Weschler, C.J., 2006. Ozone’s impact on public health: Contributions from indoor exposures to ozone and products of ozone-initiated chemistry. Environmental Health Perspectives, 114(10):1489-1496.
[37] Wu, Y., Zhang, S.J., Li, M.L., 2012. The challenge to NOx emission control for heavy-duty diesel vehicles in China. Atmospheric Chemistry and Physics, 12(19):9365-9379.
[38] Zhang, Q., Streets, D.G., He, K.B., 2007. NOx emission trends for China, 1995–2004: the view from the ground and the view from space. Journal of Geophysical Research, 112:D22306
[39] Zhang, Q., Street, D.G., Carmichael, G.R., 2009. Asian emissions in 2006 for the NASA INTEX-B mission. Atmospheric Chemistry and Physics, 9(14):5131-5153.
[40] Zhang, Q.Y., Wei, Y.M., Chen, Y.X., 2007. Environmental damage costs from fossil electricity generation in China, 2000–2003. Journal of Zhejiang University-SCIENCE A, 8(11):1816-1825.
[41] Zhao, B., Wang, S.X., Liu, H., 2013. NOx emissions in China: historical trends and future perspectives. Atmospheric Chemistry and Physics, 13:9869-9897.
[43] Zhao, Y., Wang, S.X., Nielsen, C.P., 2010. Establishment of a database of emission factors for atmospheric pollutants from Chinese coal-fired power plants. Atmospheric Environment, 44(12):1515-1523.
[44] Zhao, Y., Nielsen, C.P., Lei, Y., 2011. Quantifying the uncertainties of a bottom-up emission inventory of anthropogenic atmospheric pollutants in China. Atmospheric Chemistry and Physics, 11(5):2295-2308.
Open peer comments: Debate/Discuss/Question/Opinion


Open peer comments: Debate/Discuss/Question/Opinion
<1>