Affiliation(s):
1.
International Institute of Earthquake Engineering and Seismology, Tehran, Iran; moreAffiliation(s): 1.
International Institute of Earthquake Engineering and Seismology, Tehran, Iran; 2.
Faculty of Engineering, University of Guilan, Rasht, Iran; 3.
International Branch, University of Guilan, Rasht, Iran; less
Yaser Jafarian, Ali Ghorbani, Siavash Salamatpoor, Sina Salamatpoor. Monotonic triaxial experiments to evaluate steady-state and liquefaction susceptibility of Babolsar sand[J]. Journal of Zhejiang University Science A, 2013, 14(10): 739-750.
@article{title="Monotonic triaxial experiments to evaluate steady-state and liquefaction susceptibility of Babolsar sand", author="Yaser Jafarian, Ali Ghorbani, Siavash Salamatpoor, Sina Salamatpoor", journal="Journal of Zhejiang University Science A", volume="14", number="10", pages="739-750", year="2013", publisher="Zhejiang University Press & Springer", doi="10.1631/jzus.A1300032" }
%0 Journal Article %T Monotonic triaxial experiments to evaluate steady-state and liquefaction susceptibility of Babolsar sand %A Yaser Jafarian %A Ali Ghorbani %A Siavash Salamatpoor %A Sina Salamatpoor %J Journal of Zhejiang University SCIENCE A %V 14 %N 10 %P 739-750 %@ 1673-565X %D 2013 %I Zhejiang University Press & Springer %DOI 10.1631/jzus.A1300032
TY - JOUR T1 - Monotonic triaxial experiments to evaluate steady-state and liquefaction susceptibility of Babolsar sand A1 - Yaser Jafarian A1 - Ali Ghorbani A1 - Siavash Salamatpoor A1 - Sina Salamatpoor J0 - Journal of Zhejiang University Science A VL - 14 IS - 10 SP - 739 EP - 750 %@ 1673-565X Y1 - 2013 PB - Zhejiang University Press & Springer ER - DOI - 10.1631/jzus.A1300032
Abstract: In this study, drained and undrained triaxial tests under isotropic and anisotropic consolidations were conducted on reconstituted samples of Babolsar sand, which underlies a densely populated, seismic region of the southern coast of the Caspian Sea, Mazandaran, Iran. It was demonstrated that the sand experienced all possible states of liquefiable soil: flow failure, limited flow, and dilation. The steady-state and flow liquefaction lines of this sand were presented and compared with previously tested sands. It is shown that the initial stress anisotropy can affect the potential of volume change and pore pressure generation. The steady-state line (SSL), however, remains identical for the isotropically and anisotropically consolidated specimens under drained and undrained conditions. The tests data were then analyzed in order to investigate the liquefaction susceptibility of this sand in terms of parameters such as the state parameter, relative state parameter index, and lateral earth pressure ratio at failure.
Darkslateblue:Affiliate; Royal Blue:Author; Turquoise:Article
Article Content
1. Introduction
Soil liquefaction may occur in loose to medium soils subjected to either cyclic or monotonic loading. A significant part of shear strength in such soils loses due to the generation of high pore water pressure in medium to high levels of shear strains. Liquefaction occurrence near the ground surface commonly results in great deformations; thereby producing significant damage to man-made or natural structures. Liquefaction triggered within sloping ground or embankments may produce rapid flow failures, which usually cause tremendous damage. Advanced studies of soil liquefaction were initiated following the liquefaction-induced failures observed after two subsequent earthquakes occurred in Niigata, Japan and Alaska, USA in 1964.
Static liquefaction might be studied using a triaxial apparatus to gain a better understanding of its mechanism and its controlling parameters. Castro (1969) observed that cohesionless soils with different densities exhibit three basic phenomenological behaviours: termed liquefaction, limited liquefaction, and dilation when they undergo sufficient shear strains. The state in which the soil continually deforms under constant volume, shear, and confining stress was defined as the steady-state (Castro and Poulos, 1977; Poulos, 1981) and the corresponding strength of soil was called the steady-state, residual, or post-peak strength. Evaluation of steady-state strength of soils from static tests has been taken into consideration in previous studies (Castro, 1969; Della et al., 2011; Sivathayalan and Vaid, 2002). Yang (2002), Chu and Leong (2002), Chu et al. (2012), Rahman and Lo (2012), and Bobei and Wanatowski (2009) studied drained and undrained static instability of sands. Baki et al. (2012) tried to define the condition that links triggering of cyclic instability and that of static instability for different values of void ratio and fines content.
The locus of the steady-state in e-p′-q space (where e, p′, and q are void ratio, mean effective stress, and deviatoric stress, respectively, at large strains) yields a state criterion for determining the susceptibility of sand to flow liquefaction (or flow failure). Soil behaviour can be expressed by the determination of the current proximity of soil state relative to the steady-state line (SSL), at the same effective confining stress. The state parameter, which was defined by Been and Jefferies (1985), represents the difference between the current void ratio and the void ratio on the SSL at the same mean effective stress. Therefore, the state parameter could determine liquefaction susceptibility (or non-susceptibility) of soils.
There is experimental evidence confirming that initial stress anisotropy, which is produced in some circumstances such as surficial construction, may alter the liquefaction susceptibility of sands (Sivathayalan and Vaid, 2002; Jafarian et al., 2012). Jafarian et al. (2012) observed that testing on anisotropically consolidated samples is useful to simulate liquefaction susceptibility of the soil elements located within the sloping ground or beneath structures that tolerate high shear stresses. Bobei et al. (2009) conducted static liquefaction tests on silty sands and presented modified state parameters which could successfully unify the characterization of undrained responses of both sand with fines and parent sand. Chu and Leong (2002) and Rahman and Lo (2012) analysed the effect of fines content on the static liquefaction or instability of sands. Yang and Sze (2011) investigated the role of initial static shear on the cyclic instability of Toyoura sand. Sivathayalan and Vaid (2002) conducted hollow cylinder torsional shear experiments to study the influence of an initial stress state on the undrained response of sands. They concluded that the potential of sand for flow deformation is dependent upon the magnitude of initial shear stress, and that steady-state strength is not related to the void ratio alone.
An overview to the previous experimental works on various sands revealed that liquefaction susceptibility depends on two main factors: (1) the individual characteristics of sand like mineralogy, grains shape, aging, fines content, etc, and (2) state criteria. The latter expresses the initial stress-density state of sand. Therefore, specific experimental study is required for natural sands, with individual compositional characteristics, when subjected to various initial states. The current study presents results of the experimental investigation on the poorly graded coastal sand located in the Babolsar region, Mazandaran province of Iran. Initial effective stress, shear stress, and relative density were considered as state variables for evaluating the steady-state strength and liquefaction susceptibility of this sand. Several drained and undrained static triaxial tests under initial isotropic and anisotropic stress conditions were conducted. The steady-state and flow liquefaction lines of this sand were presented as a limit state boundary to recognize liquefaction susceptibility. Subsequently, dilative and contractive behaviours of this sand were expressed in terms of some parameters like state parameter and excess pore pressure ratio at failure. The incremental rates of excess pore pressure (for undrained tests) and volume change (for drained tests) were different for the isotropically and anisotropically consolidated specimens.
2. Experimental
2.1. Soil tested
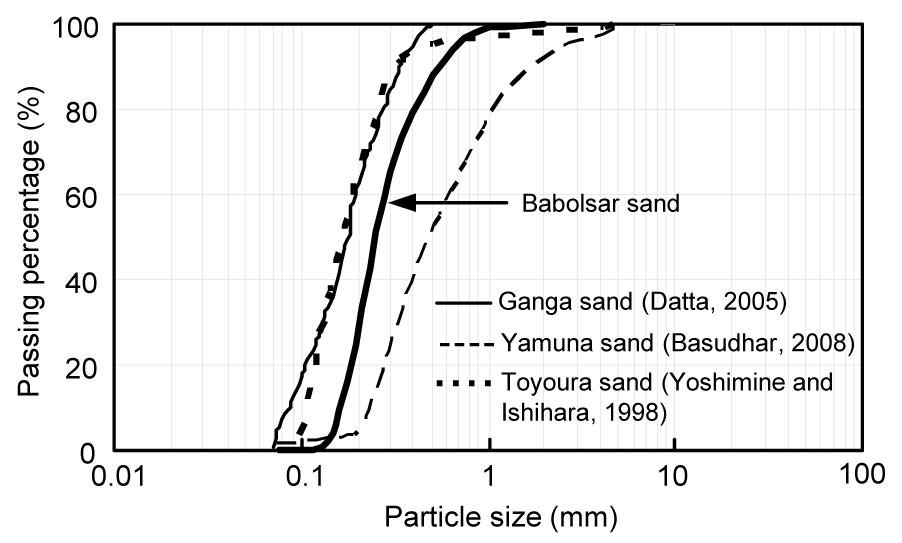
The triaxial experiments were performed on Babolsar sand, which underlies a densely populated, seismic region of the southern coast of Caspian Sea in Mazandaran, Iran. The reconstituted specimens of sand were prepared using bulk samples taken from borrow pits on the beach. The sand is poorly graded and classified as SP according to the unified soil classification system (USCS). The grains size distribution curve of this sand is shown in Fig. 1.
Fig.1 Comparison of grains size distribution of four sands
The relative density was utilized as an applicable parameter for sample preparation:
,
where emax and emin are the maximum and minimum void ratios of soil, respectively, measured according to the American Society for Testing and Materials (ASTM D4353 and ASTM D4354) methods. The index properties of this sand were determined in a laboratory, as summarized in Table 1, wherein Gs, D50, and Cu stand for specific gravity, mean grains size, and coefficient of uniformity of soil, respectively. Moreover, a comparison was made in Table 1 and Fig. 1 between the basic properties and gradation curves of Babolsar sand and some previously studied sands including Ganga (Datta, 2005), Toyoura (Yoshimine and Ishihara, 1998), and Yamuna (Basudhar, 2008) sands. Fig. 1 shows that the grain size distribution curve of Babolsar sands is located between the other curves.
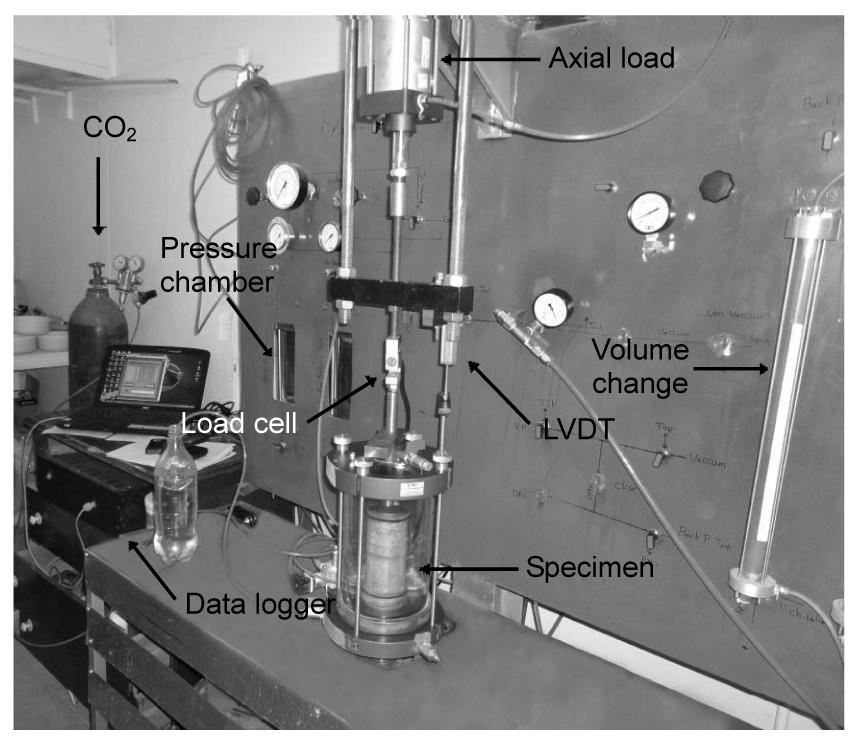
The employed triaxial apparatus was a hand-made machine which was assembled in Armoon Geotechnical Consultant Engineers, a private company in Babol, Iran. Design and production of this apparatus involve four main parts, as described subsequently.
2.2.1. Structure and electro mechanics
The triaxial apparatus contains a steel frame and panel on which the dial gages and displacement transducers (LVDTs) together with many controller valves are installed. The supporting frame has a 5×10³ kg capacity for vertical loading and never deforms during the tests. The main vertical hydraulic jack is installed beneath the desk and transfers axial compression or extension load with a velocity of 0.1 to 2.2 mm/min. An additional pneumatic jack was installed at the upper part of the frame for precise application of axial loads for anisotropic stress tests. The acrylic cell of the machine can hold confining pressure up to 2 MPa.
2.2.2. Pneumatic
Pneumatic force is supplied by a powerful air compressor in order to apply and control the following actions:
The pneumatic force produced by the compressor which has two cylinders each with 15×105 Pa capacity could apply 1×10⁵ to 10×105 Pa pressures.
2.2.3. Data acquisition
The triaxial apparatus contains an electronic device which has eight independent channels for analog to digital conversion of pressure, displacement, and force measurements. Data acquisition is carried out using the software installed on the computer for recording the required data. Calibration parameters were precisely measured for each channel and fed into the software. Fig. 2 shows the mentioned hand-made triaxial apparatus with the data logger system.
Fig.2 Static hand-made triaxial apparatus and data logger
2.3. Testing procedure
Moist tamping has been adopted as a reasonable method for specimen preparation. Oven-dried sands were carefully mixed with 5% of de-aired water and the wet samples were divided in five equal parts by weight. Each part was then carefully poured into the circular split-mold by a spoon and compacted into the mold to a predetermined height and leveled with caliper to achieve the desired uniform density. The rubber membrane with a thickness of 0.3 mm was kept in position by applying suction between the mold and the membrane. The top of any compacted layer was then scratched to promote the required friction between the layers. The procedure was repeated for each of the five layers. A low level of vacuum was applied to the specimen and then sample height and diameter were measured. The target height and diameter of samples were planned to be 100 mm and 50 mm, respectively. After detaching the mold, the cell was installed and the water supply was opened to fill out the cell with water. The confining pressure of about 10 kPa was applied while the vacuum was removed simultaneously. The sample was blowing with carbon dioxide for easier saturation. Then, de-aired water was flushed through the sample and a prescribed back pressure was applied to achieve 95% or more saturation.
After consolidation and recording the squeezed water, strain-controlled drained or undrained loading with the rate of about 1 mm/min was applied up to sample failure. For anisotropic tests, axial load was applied from the upper jack with a very low rate in drained condition prior to the undrained shearing.
3. Results
Several drained and undrained tests under isotropic and anisotropic consolidations were conducted on Babolsar sand. The initial conditions of tests are named as A to F series, as summarized in Table 2, where (Dr)c, B value, and (Dr)cr stand for relative density of sample after consolidation, Skempton’s saturation parameter, and relative density of sample in critical state, respectively. A brief description of these tests is given below:
A series: isotropically consolidated undrained (CIU-Test) triaxial tests, including 15 tests under the initial mean effective stresses of 40 to 410 kPa and the initial relative densities of 5% to 55%.
B series: isotropically consolidated drained (CID-Test) triaxial tests, including 10 tests under initial mean effective stress and relative densities the same as A series.
C series: anisotropically consolidated undrained (CAU-Test) triaxial tests, including six tests. For this condition, α was defined as the ratio of initial shear stress to effective confining stress, α=τ/σ3c′ (the initial shear stress is deviatoric stress divided by 2). Accordingly, α=0 denotes isotropically consolidated specimens. For this series, α=0.2 and initial mean effective stresses are 40 and 300 kPa while initial relative density varies from 5% to 55%.
D series: anisotropically consolidated undrained (CAU-Test) triaxial tests, including six tests which are the same as C series except for α=0.4.
E series: anisotropically consolidated drained (CAD-Test) triaxial tests, including four tests under initial mean effective stresses of 40 and 300 kPa, initial relative densities of 5% and 55%, and α=0.2.
F series: anisotropically consolidated drained (CAD-Test) triaxial test, including four tests which are the same as E series except for α=0.4.
Table 2
Summary of static triaxial tests conducted in the current study
No.
Series
Type of consolidation
(Dr)c (%)
Back pressure (kPa)
B value (%)
(Dr)cr (%)
P0′ (kPa)
α
Behaviour
1
A
CIU
8.48
48
>97
40
0
Flow liquefaction
2
A
CIU
11.77
49
>98
110
0
Flow liquefaction
3
A
CIU
15.07
58
>95
210
0
Flow liquefaction
4
A
CIU
18.37
51
>97
300
0
Limited liquefaction
5
A
CIU
20.20
54
100
410
0
Dilation
6
A
CIU
33.00
42
>95
40
0
Dilation
7
A
CIU
36.54
50
>95
110
0
Dilation
8
A
CIU
41.49
51
>98
210
0
Dilation
9
A
CIU
42.00
53
>97
300
0
Dilation
10
A
CIU
42.55
53
>96
410
0
Dilation
11
A
CIU
56.87
81
>98
40
0
Dilation
12
A
CIU
59.77
52
100
110
0
Dilation
13
A
CIU
61.30
53
>96
210
0
Dilation
14
A
CIU
62.73
52
>98
300
0
Dilation
15
A
CIU
65.05
53
>96
410
0
Dilation
16
B
CID
7.93
52
>96
3.33
40
0
Dilation
17
B
CID
10.52
47
>95
5.60
110
0
Dilation
18
B
CID
13.61
45
>98
9.74
210
0
Dilation
19
B
CID
18.37
44
100
13.95
300
0
Dilation
20
B
CID
22.47
45
>97
36.51
410
0
Dilation
21
B
CID
57.39
52
>95
29.11
40
0
Dilation
22
B
CID
58.44
43
>95
31.63
110
0
Dilation
23
B
CID
61.30
51
>98
37.78
210
0
Dilation
24
B
CID
64.44
44
>95
49.76
300
0
Dilation
25
B
CID
64.95
47
100
45.15
410
0
Dilation
26
C
CAU
9.39
41
>97
45.34
0.2
Dilation
27
C
CAU
19.83
53
100
340
0.2
Limited liquefaction
28
C
CAU
34.06
51
>98
45.34
0.2
Dilation
29
C
CAU
40.25
43
>95
340
0.2
Dilation
30
C
CAU
57.21
51
>96
45.34
0.2
Dilation
31
C
CAU
64.03
52
100
340
0.2
Dilation
32
D
CAU
9.03
52
>97
50.66
0.4
Dilation
33
D
CAU
18.91
54
>96
380
0.4
Dilation
34
D
CAU
33.36
51
>96
50.66
0.4
Dilation
35
D
CAU
42.20
43
>98
380
0.4
Dilation
36
D
CAU
57.04
44
>95
50.66
0.4
Dilation
37
D
CAU
68.12
48
>97
380
0.4
Dilation
38
E
CAD
7.45
44
>97
8.95
45.34
0.2
Dilation
39
E
CAD
17.78
46
>96
11.59
340
0.2
Dilation
40
E
CAD
57.21
47
100
29.91
45.34
0.2
Dilation
41
E
CAD
63.48
48
>97
41.31
340
0.2
Dilation
42
F
CAD
7.67
74
>96
4.46
50.66
0.4
Dilation
43
F
CAD
17.63
75
>96
15.4
380
0.4
Dilation
44
F
CAD
57.32
40
>98
35.11
50.66
0.4
Dilation
45
F
CAD
63.79
77
>98
42.14
380
0.4
Dilation
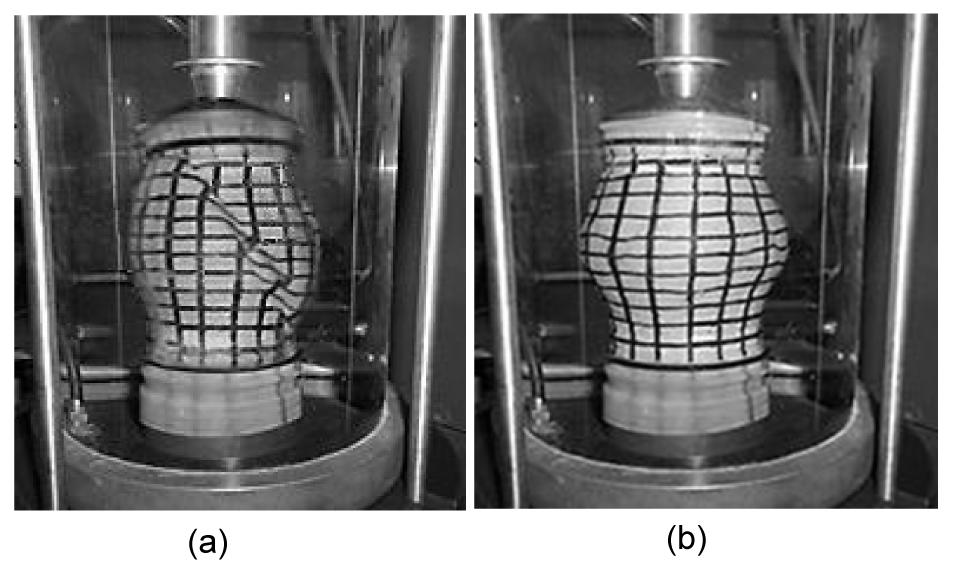
Figs. 3a and 3b illustrate the deformed shape of two loose (Dr=15.07%) and dense (Dr=61.3%) specimens, respectively, under undrained shearing at failure. Since the conventional platens were used, these samples exhibit non-uniformity at failure strains because of end restraints. Bolton (1986) reported that Bishop and Green (1965) concluded negligible effect for end condition; however, Rowe and Barden (1964) found that the peak friction angle measured with the lubricated platens at H/D=1 is less than that measured with conventional platen on samples with H/D=2. The effect of frictional platens is undetermined in the current study because this effect was assumed to be small and negligible.
Fig.3 Deformed shapes of two specimens of Babolsar sand (a) Loose sample (isotropically consolidated, relative density=15.07%, mean effective confining pressure=210 kPa); (b) Dense sample (isotropically consolidated, relative density=61.30%, mean effective confining pressure=210 kPa)
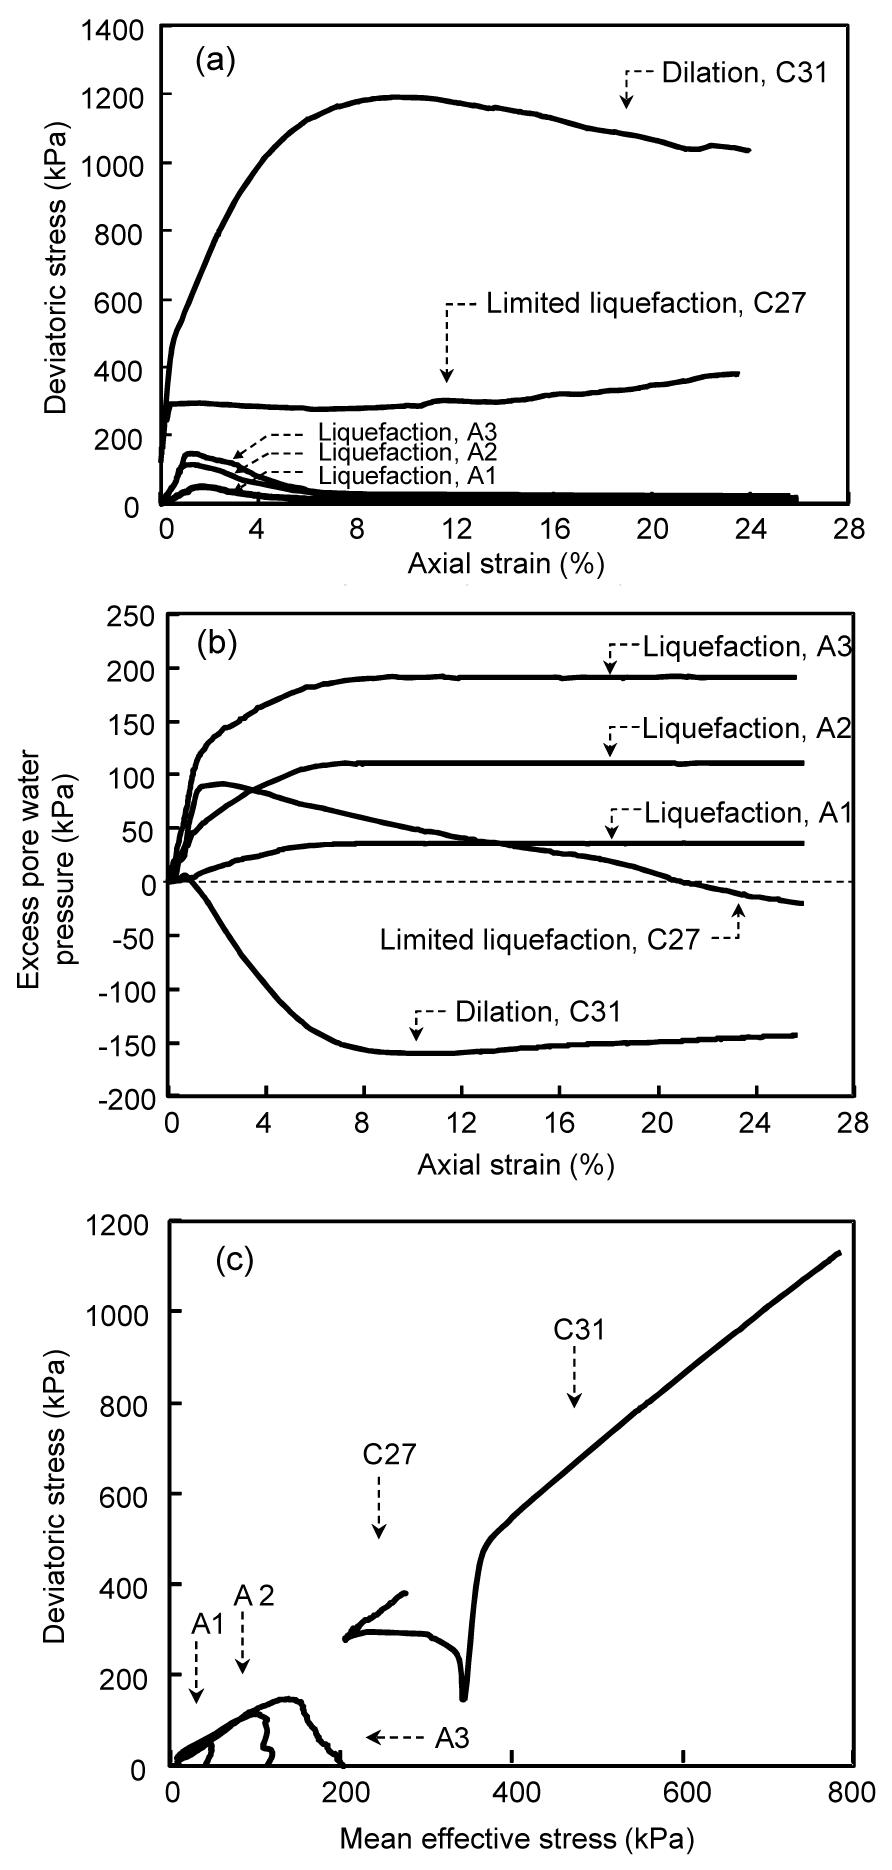
Among the isotropically consolidated undrained (CIU) tests from series A, three loose samples A1 to A3 (Figs. 4a to 4c) exhibit contractive behaviour throughout the shearing. When undrained shearing begins, the specimens with contractive behaviour generate positive excess pore water pressure and the shear resistance reaches a peak value that occurs at a relatively small strain and the specimens would then collapse.
After peak point, excess pore water pressure increases dramatically and the stress path reaches the SSL with considerable strain softening. In these cases, the specimens have exhibited flow liquefaction behaviour in which the static shear stress required for equilibrium (peak point) are greater than the available shear strength in steady-state condition. Fig. 4c also illustrates effective stress paths of two specimens which anisotropically consolidated with α=0.2. For specimen C27 (relative density of 19.83% and initial effective confining pressure of 340 kPa), the stress path initially shows contractive behaviour while larger strains causes an elbowing and the stress path switches to the dilative type of behaviour and moves along the SSL. This type of behaviour which contains the transition from contractive to dilative behaviour is called limited liquefaction. The curves of deviatoric stress and excess pore water pressure versus axial strain as well as effective stress path are shown in Figs. 4a to 4c for C27. The third type of behaviour which is observed for C31 (Figs. 4a to 4c) implies dilative behaviour throughout the shearing. The excess pore water pressure in this case is permanently negative (Fig. 4b).
Fig.4 Test results of samples A1 to A3, C27, and C31 (a) Stress-strain curves; (b) Excess pore water pressure versus axial strain; (c) Effective stress paths
The preliminary results of the tests reveal that Babolsar sand can experience the whole possible undrained behaviour of typical sands, i.e., flow liquefaction, limited liquefaction, and dilation.
4. Steady-state line (SSL)
When the shear strain level is large enough, soil samples undergo a state of continuous deformation with constant shear stress (q) and normal stress (p′). There exists a correlation between the ultimate values of void ratio and mean effective principal stress, which is referred to as the ultimate SSL. Soil behaviour can be described by expressing the state of effective confining stress and defining the location of this point relative to the SSL. The SSL is defined as the locus of all points within the void ratio-effective stress (e-p′) plane at which a soil mass deforms under the conditions of constant stress and void ratio. The steady-state concept and SSL have been well described in previous studies (Castro, 1969; Casagrande, 1975; Castro and Poulos, 1977; Poulos, 1981; Sivathayalan and Vaid, 2002). Results of all tests for Babolsar sand in q-p′ and e-logp′ planes are shown in Figs. 5a and 5b, respectively, where M and β identify the slope of the fitted p′-q line. Results of the tests with different initial stress-density conditions and stress paths such as isotropic or anisotropic consolidation, drained or undrained, and various relative densities fall along a unique SSL. By plotting the experimental data in e-logp′ plane (Fig. 5b), a linear equation for the SSL is achieved by regression (e=0.8632−0.0545logp′). Data scattering is observed in Fig. 5b especially for larger p′ values wherein the majority of data are located. Scattering of data around the SSL is represented by average root mean squared error (RMSE) which is 0.07006 for void ratio.
Fig.5 Steady-state line for all specimens in q-p′ plane (a) and e-logp′ plane (b)
According to the definition of SSL, specimens with the initial state located above the fitted SSL should be logically susceptible for static liquefaction. However, errors of the fitted SSL, which rise from the data measurement and curve fitting, may affect this postulation. Hence, the reported error (i.e., 0.07006) should be taken into account when calculating for the relevant parameters such as state parameter, which represents proximity of the current soil state to the fitted SSL.
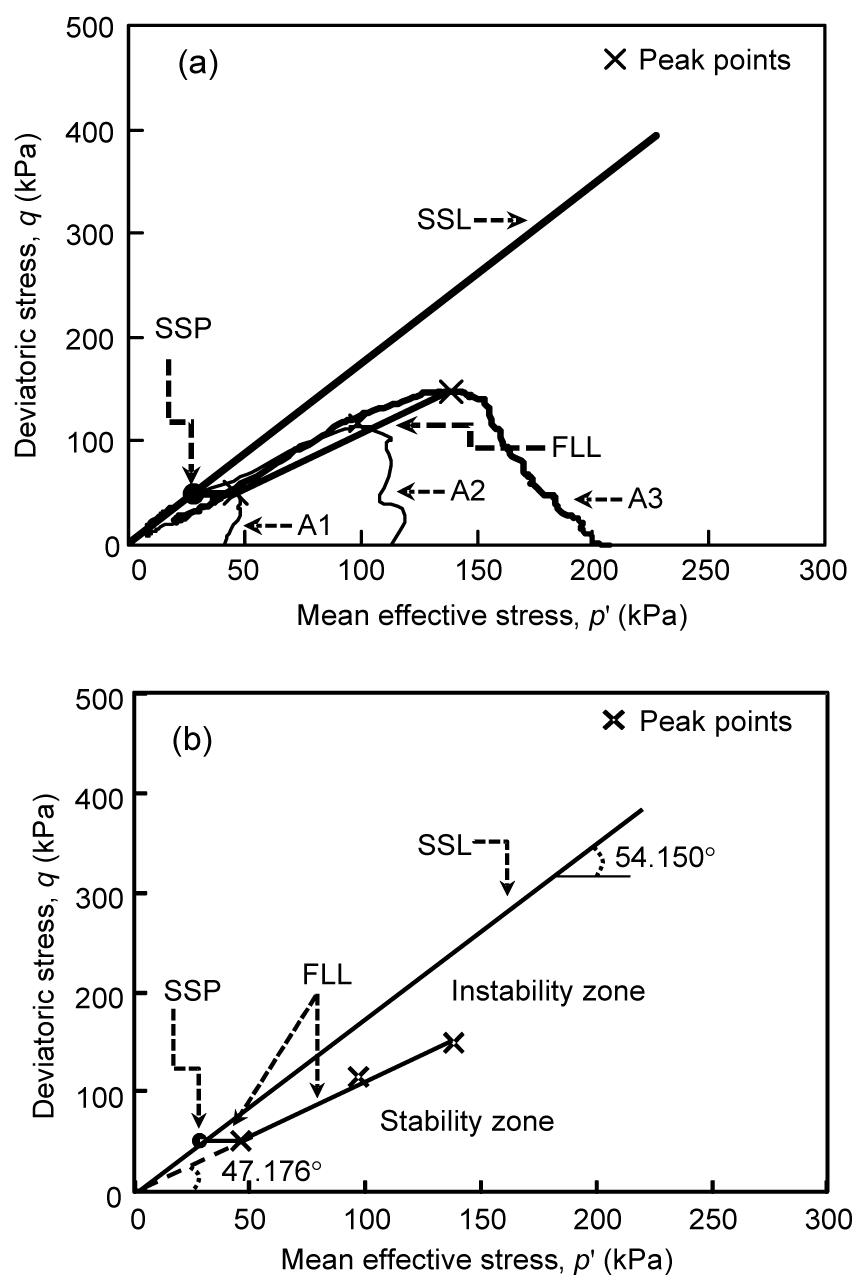
5. Flow liquefaction line (FLL)
Specimens of loose sand under high initial confining pressure are expected to exhibit contractive behaviour, thereby reaching the peak strength followed by significant strain softening or flow failure until the steady-state is reached. Kramer and Seed (1988), Hanzawa et al. (1979) and Vaid and Chern (1985) demonstrated a straight line, known as flow liquefaction line (FFL), as the locus of the initiation of flow liquefaction in q-p′ plane. The FLL is considered as a limit state boundary between the stable and the unstable states of soil undrained behaviour.
For isotropically consolidated specimens of Babolsar sand, undrained shearing has resulted in only three flow liquefactions for the loose specimens A1, A2, and A3. The FLL for this sand, which is the straight line passes through the peak points on the stress paths, is shown in Fig. 6a. The FLL and SSL are inclined at the angles of 47.176° and 54.150° above the horizontal, respectively (Fig. 6b), where SSP stands for the steady-state point.
Fig.6 Peak points on effective stress paths and flow liquefaction surface (a) and flow liquefaction surface and the steady-state point (b)
6. Liquefaction susceptibility
In this study, three indices including state parameter (ψ), relative state parameter index (ξR), and lateral earth pressure ratio at failure (kf) are considered to recognize liquefaction susceptibility of the studied sand.
6.1. State parameter (ψ)
Soil behaviour can be described by the positioning of the current stress-density state of soil relative to the SSL. Therefore, one can say that sand behaviour is not only dependent upon its relative density but also upon a description of stress state that has to be defined. Been and Jefferies (1985) demonstrated that the current state is expressed in terms of both initial void ratio e0 and effective mean stress, p0′. Hence, different combinations of e0 and p0′ can potentially obtain the whole possible phenomenological types of soil behaviour. State parameter (ψ) has been defined as the difference between the current void ratio and the void ratio at the same mean effective stress on the SSL in e-p0′ plane:
,
where Dr,ss is the relative density on SSL at the same effective stress, and Dr is the current relative density.
In undrained shearing, a positive ψ value is typically associated with flow failure, whereas a negative ψ value is associated with non-flow behaviour. Therefore, the state parameter can be used for describing the behaviour of granular materials over a wide range of initial stress-density conditions. In fact, the state parameter properly combines these parameters which are physically relevant to describe the behaviour of granular materials.
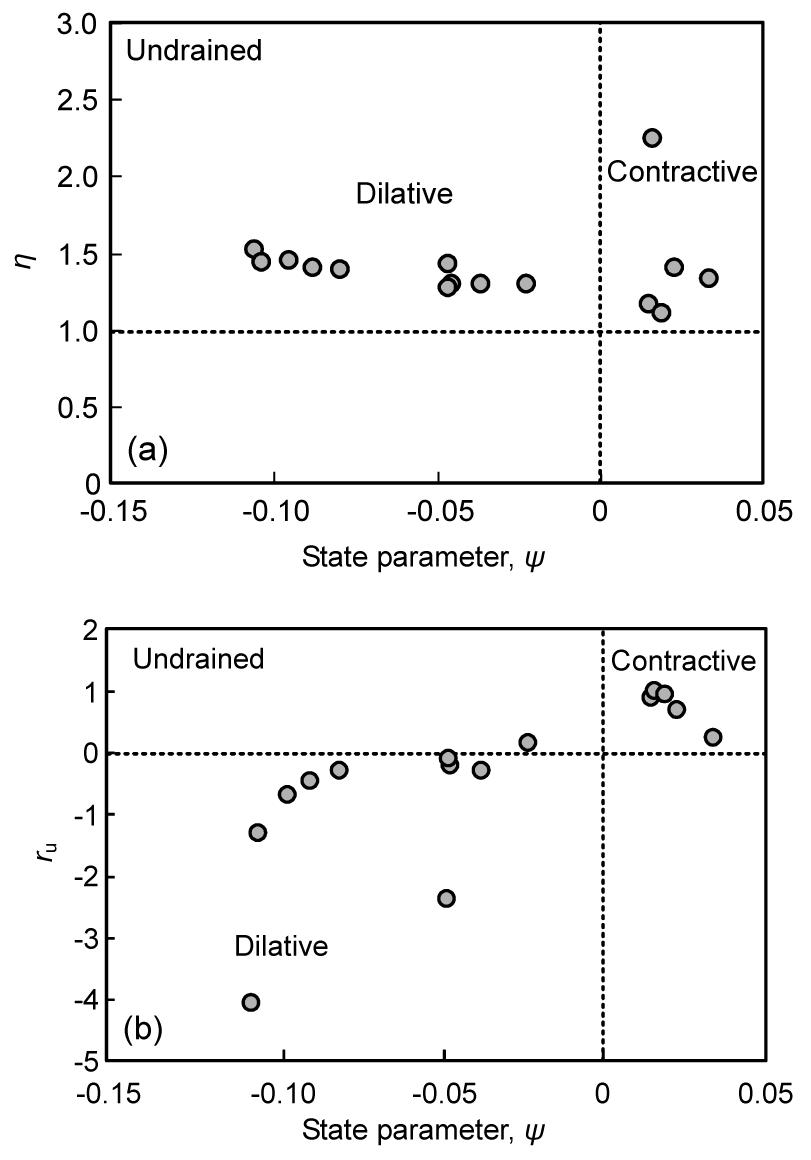
To better realize effectiveness of the state parameter, η (the ratio of deviatoric stress at failure to the mean effective stress at failure, qf/pf′) and ru (the ratio of excess pore water pressure at failure to the initial effective confining stress, uexcess/σ3c′) are plotted with the state parameter. Fig. 7a shows results of A1 to A15 within the η-ψ plane. Accordingly, five samples have positive ψ which indicates contractive behaviour or liquefiable state. The remaining tests of series A have negative state parameter (ψ) and dilative behaviour. Moreover, in all the tests η>1, meaning that deviatoric stress at failure were greater than the mean effective stress at failure. Fig. 7b also demonstrates that ru values are larger than zero (ru>0) for six samples, whereas ru might be considered as a criterion for liquefaction susceptibility. Comparison between Fig. 7a and Fig. 7b reveals that the combination of ru and ψ is more applicable because contractive and dilative behaviours are anticipated when both parameters are positive (ru>0 and ψ>0) and negative (ru<0 and ψ<0), respectively.
Fig.7 Results of triaxial tests on isotropically consolidated undrained samples (a) The ratio of deviatoric stress to mean effective stress at failure versus state parameter; (b) The excess pore water pressure at failure versus state parameter
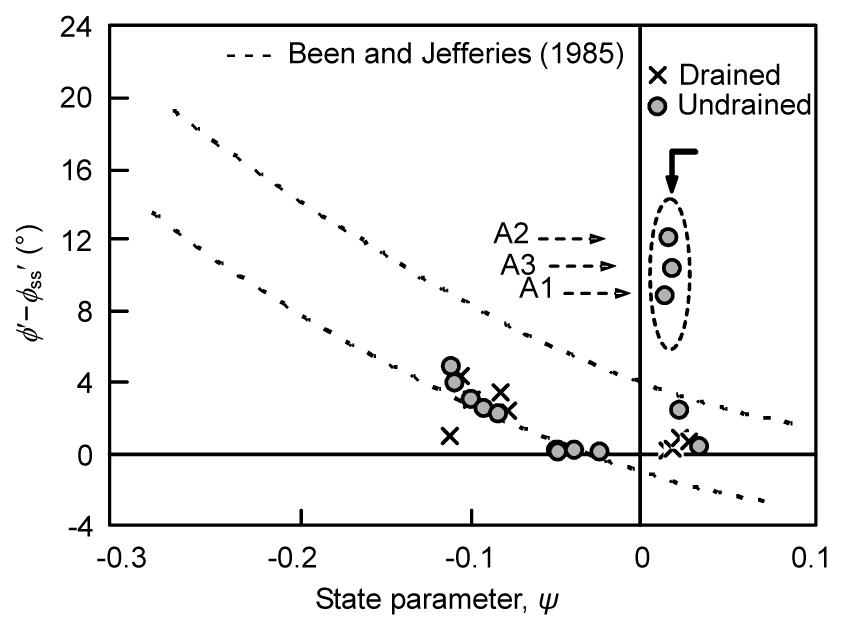
Peak strengths of sands are known to be dependent on the initial density of packing and the effective stress level. The combined influence of stress level and density on strength were studied and reported by Been and Jefferies (1985) and Bolton (1986). Bolton (1986) suggested that the difference between the peak and steady-state angles of friction can be estimated by
,
where ϕ′ and ϕss′ are the peak and steady-state angles of friction, respectively, 0<ϕ′−ϕ′ss<12°, ID is the initial relative density, and pf′ is the mean effective stress at failure.
For the CID and CIU tests (A and B series), the values of ϕ′ were calculated as the friction angle at failure and the values of ϕ′ss were estimated when stress path reached the SSL. As shown in Fig. 8, for A and B series, 0<ϕ′−ϕss′<12°. The figure also shows the upper and lower bounds reported by Been and Jefferies (1985) for six different clean and silty sands.
Fig.8 Difference between peak and steady-state friction angles versus state parameter for isotropically consolidated drained and undrained tests
Although the majority of tests data specify ϕ′−ϕss′<5° and fall within the rang reported by Been and Jefferies (1985), it can be seen that three liquefied samples are obtained out of range results. As indicated by Been and Jefferies (1985), this is due to the inaccuracies associated with the determination of ϕ′ from the results of the liquefied samples.
6.2. Relative state parameter index (ξR)
In spite of the described effectiveness of the state parameter, its estimation is difficult for the routine geotechnical practice. Bolton (1986) introduced the relative density index IR, as a measure to reflect dilatancy of granular soils. Konrad (1988) used this parameter and normalized the state parameter (ψ) with respect to emax−emin to propose the relative state parameter index (ξR), which is more applicable than ψ in the field condition:
,
where p′=(1+2k0)σv0′/3, p′ is the initial mean effective confining pressure, Pa is the atmosphere pressure, k0 is the lateral earth pressure at rest, σv0′ is the initial vertical effective stress, and Q is an empirical constant dependent on the mineralogy and breakage of soil. For most silicate sands, Q has been reported to be around 10 (Konrad, 1988). Jafarian et al. (2010) applied the relative state parameter index for modification of the results of cyclic triaxial tests and estimation of equivalent cyclic resistance in the field condition.
From the curve fitting of the results for CID and CIU tests, Q=8.28 for Babolsar sand while ξR varies from 0.25 to −0.35. Accordingly, relative density and mean effective confining stress were between 8.48% to 65% and 40 kPa to 410 kPa, respectively. Fig. 9 illustrates excess pore pressure at failure versus relative state parameter index for series A (CIU). Similar to the state parameter, ψ (Fig. 7b), the modified state parameter also results in reasonable performance because contractive and dilative behaviours are associated with positive-positive and negative-negative values of ru and ξR, respectively. Fig. 9 indicates that relative state parameter index can be employed as an alternative parameter for state parameter because it maintains the required capability while its estimation is more straightforward.
Fig.9 Excess pore pressure ratio versus relative state parameter index for undrained tests
6.3. Lateral earth pressure ratio at failure (kf)
kf has been defined as the ratio of initial effective confining stress to effective axial stress at failure kf=σ3c′/σ1f′. Fig. 10 demonstrates values of kf versus the friction angle at failure (ϕ′) for CID and CIU tests. It can be shown that the kf-ϕ′ data for these samples are located between two descending dash lines. The liquefied samples have maximum kf and minimum ϕ′ values compared with the rest of tests data. Larger values of kf for the liquefied samples might be associated with the decrease of axial stress at failure for these samples.
Fig.10 Lateral earth pressure at failure versus friction angle at failure for isotropically consolidated specimens under drained and undrained conditions
7. Effect of initial load anisotropy
Initial shear load (identified with shear parameter, α), which creates anisotropically consolidated specimens, can vary some soil parameters. Experimental results of the current study revealed that isotropically and anisotropically compressed samples approach toward an identical SSL.
For drained tests, Parry (1958) examined the rate of volume change at failure and plotted this ratio against pu′/pf′, where pu′ is the mean effective stress of the point on the SSL at the same specific volume and pf′ is the mean effective stress at failure. The rate of volume change is expressed as the ratio of volumetric strain increment δεv to the axial strain increment δεa. The rate of volume change describes the rate of movement towards the SSL at failure and there would be a clear correlation between δεv/δεa and pu′/pf′ Parry (1958) indicated that the movement rate increases as the distance between the failure and ultimate state of specimen increases. For Babolsar sand under isotropic and anisotropic consolidations (series B, E, and F), Fig. 11a shows the values of −δεv/δεa versus pu′/pf′. For CID condition, the fitted line for isotropic samples at pu′=0.97pf′ (point H) stands for the zero rate of volume change at failure state. The samples failed with positive −δεv/δεa demonstrate dilative behaviour at failure moment, and vice versa. For undrained tests, Parry (1958) examined the rate of pore pressure change at failure and plotted (δu/pf′)/δεs versus pu′/pf′. The rate of pore pressure change at failure is the largest for samples which fail farthest away from the SSL; the sign of the pore pressure change is such as to move the specimen towards the SSL. For Babolsar clean sand under undrained shearing, the rates of pore pressure versus p′u/p′f for CIU and CAU conditions are shown in Fig. 11b. The positive sign of (δu/pf′)/δεs denotes contractive behaviour, and vice versa. Similar to the drained tests, it is observed from the figure that the isotropic samples specify positive and zero (δu/pf′)/δεs values while the majority of anisotropic data points obtain negative and zero values. There is an evident data scatter in Figs. 11a or Fig. 11b for either isotropic or anisotropic tests results. To account for the uncertainties in the fitted lines, RMSE is presented herein. For drained tests in isotropic and anisotropic conditions, RMSE of the rate of volume change are 0.02273 and 0.0531, respectively. The lines plotted in Fig. 11b for undrained tests specify the error values of 0.0199 and 0.0161 for isotropic and anisotropic conditions, respectively.
Fig.11 Rate of the volume change at failure versus pu′/pf′ (a) and rate of pore water pressure at failure versus pu′/pf′ (b)
8. Conclusions
This paper presented the drained and undrained static triaxial tests on isotropically and anisotropically consolidated specimens of Babolsar clean sand which underlies a vast region in the southern coast of Caspian Sea. Several levels of relative densities from 8.48% to 68.12% with initial effective confining stresses of 40 to 410 kPa were specified in the experimental program. The results were analyzed through the framework of steady-state concept and liquefaction susceptibility of sands. The conclusions can be summarized as follows:
In the undrained triaxial test under monotonic loading, Babolsar sand can experience the whole possible behaviours of liquefiable soils, i.e., flow failure, limited liquefaction, and dilation. Loose samples with the initial relative density of 8.48% have flow failed even under relatively low levels of effective confining pressure (40 kPa). Nevertheless, the majority of the conducted triaxial tests have shown dilative behaviour.
The SSL of Babolsar sand was obtained and presented in e-logp′ and q-p′ planes. The SSL in e-logp′ plane introduces a state boundary for liquefaction susceptibility between the susceptible and non-susceptible states of sands. Babolsar sand with the initial state located in the upper region of this line is prone for flow type of failure. As expected, the decreasing trend of the SSL in e-logp′ plane confirms that sand behaviour varies from dilation to contractive state due to the increase in initial isotropic effective stress at the constant relative density. In fact, dilatancy is suppressed with increasing initial effective confining pressure. Previous field observations indicate that liquefaction commonly occurs within the depths of less than 20 m, which corresponds to the vertical effective overburden pressure of 200 kPa in the fully saturated and level ground. This is equivalent to the mean effective pressure of 120 kPa, considering K0=0.4 which is typical for the normally consolidated sands. For p′<120, the SSL denotes that Babolsar sand would flow failed only for the initial relative densities of less than 18.8%.
State parameter and relative state parameter index can reflect susceptibility of sand for contractive or dilative types of failure during undrained or drained loading. The flow failed samples of the present study have had positive values of state parameter and relative state parameter index.
State parameter and relative state parameter index, which are indices denoting the initial state of sand, and excess pore water pressure ratio at failure (ru) are proportional whereas sand demonstrates lower tendency for flow type of failure when the state indices increase. For the results of this study, a plot of both state indices with ru demonstrate positive-positive and negative-negative relationships for the flow failed and dilative samples, respectively.
It has been observed that the initial drained shearing affects the stress path, and hence behaviour of sand. Meanwhile, SSL is identical for either isotropically or anisotropically consolidated samples.
For undrained tests of the current study, it was observed that the isotropic samples specify positive and zero (δu/pf′)/δεs values while the majority of anisotropic data points obtain negative and zero values.
Comparing the SSL trend of Babolsar sand with the other sands like Ganga, Yamuna, and Toyoura denotes that the SSL slope of Babolsar sand is the largest value (0.128 kPa−1) in e-p′ plane while this values for Ganga, Yamuna, and Toyoura sands are about 0.0625, 0.065, and 0.0375, respectively. Therefore, in the framework of steady-state concept and according to the results of the current study, Babolsar sand is more susceptible for contractive behaviour than the other mentioned sands.
The above conclusions for Babolsar sand have been made based on the conditions of the current study such as the triaxial device, moist tamping method of sample preparation, strain-controlled compression loading mechanism, and etc. Hence, different results might be obtained for the other conditions.
Acknowledgements
Special thanks are extended to engineers from the Armoon Geotechnical Consultant, Iran for providing experimental facilities and the triaxial apparatus.
[1] Baki, M.A.L., Rahman, M.M., Lo, S.R., 2012. Linkage between static and cyclic liquefaction of loose sand with a range of fines contents. Canadian Geotechnical Journal, 49(8):891-906.
[2] Basudhar, P.K., 2008. Steady state strength behavior of Yamuna sand. Geotechnical and Geological Engineering, 26(3):237-250.
[3] Been, K., Jefferies, M.G., 1985. A state parameter for sands. Geotechnique, 35(2):99-112.
[4] Bishop, A.W., Green, G.E., 1965. The influence of end restraint on the compression strength of a cohesionless soil. Geotechnique, 15(3):243-266.
[5] Bobei, D.C., Wanatowski, D., 2009. Modified state parameter for characterizing static liquefaction of sand with fines. Canadian Geotechnical Journal, 46(3):281-295.
[6] Bolton, M.D., 1986. The strength and dilatancy of sands. Geotechnique, 36(1):65-78.
[7] Casagrande, A., 1975. Liquefaction and Cyclic Deformation of Sands, A Critical Review. Proceedings 5th Pan American Conference Soil Mechanic, Foundation Engineering, Buenos Aires, 5:80-133.
[8] Castro, G., 1969. Liquefaction of Sand. PhD Thesis, Division of Engineering and Applied Physics,Harvard University :
[9] Castro, G., Poulos, S.J., 1977. Factors affecting liquefaction and cyclic mobility. Journal of Geotechnical Engineering, 103(GT6):501-516.
[10] Chu, J., Leong, W.K., 2002. Effect of fines on instability behaviour of loose sand. Geotechnique, 52(10):751-755.
[11] Chu, J., Leong, W.K., Loke, W.L., Wanatowski, D., 2012. Instability of loose sand under drained conditions. Journal of Geotechnical & Geoenvironmental Engineering, 138(2):207-216.
[12] Datta, A., 2005. Steady State Strength Behavior of Ganga Sand. MS Thesis, Department of Civil Engineering, Indian Institute of Technology Kanpur,India :
[13] Della, N., Arab, A., Belkhatir, M., 2011. Static liquefaction of sandy soil: an experimental investigation into the effects of saturation and initial state. Acta Mechanica, 218:175-186.
[14] Hanzawa, H., Itoh, Y., Suzuki, K., 1979. Shear characteristics of a quick sand in the Persian Gulf. Soils and Foundations, 19(2):1-15.
[15] Jafarian, Y., Sadeghi, A., Vakili, R., Baziar, M.H., 2010. Probabilistic correlation between laboratory and field liquefaction potentials using relative state parameter index (ξR). Soil Dynamic Earthquake Engineering, 30(10):1061-1072.
[16] Jafarian, Y., Ghorbani, A., Salamatpoor, S., 2012. Experimental Study on Shear Resistance of Babolsar Sand under Anisotropic Consolidation. , 3rd International Conference on New Developments in Soil Mechanics and Geotechnical Engineering, Cyprus, :
[17] Konrad, J.M., 1988. Interpretation of flat plate dilatometer tests in sands in terms of the state parameter. Geotechnique, 38(2):263-277.
[18] Kramer, S.L., Seed, H.B., 1988. Initiation of soil liquefaction under static loading conditions. Journal of Geotechnical Engineering, 114(4):412-430.
[20] Poulos, S.J., 1981. The steady state of deformation. Journal of Geotechnical Engineering, 107(GT5):553-562.
[21] Rahman, M.M., Lo, S.R., 2012. Predicting the onset of static liquefaction of loose sand with fines. Journal of Geotechnical and Geoenvironmental Engineering, 138(8):1037-1041.
[22] Rahman, M.M., Lo, S.R., Baki, M.A.L., 2011. Prediction of Undrained Monotonic and Cyclic Behaviour of Sandy Soils Based on Equivalent Granular State Parameter, Melbourne, Australia 2:839-844.
[23] Rowe, P.W., Barden, L., 1964. The importance of free ends in triaxial testing. Journal of Soil Mechanics and Foundation Engineering, 90(l):l-27.
[24] Sivathayalan, S., Vaid, Y.P., 2002. Influence of generalized initial state and principal stress rotation on the undrained response of sands. Canadian Geotechnical Journal, 39(1):63-76.
[25] Vaid, Y.P., Chern, J.C.L., 1985. Cyclic and Monotonic Undrained Response of Saturated Sands. Advances in the Art of Testing Soils under Cyclic Conditions. ASCE,New York :120-147.
[26] Yang, J., 2002. Non-uniqueness of flow liquefaction line for loose sand. Gotechnique, 52(10):757-760.
[27] Yang, J., Sze, H.Y., 2011. Cyclic behaviour and resistance of saturated sand under non-symmetrical loading conditions. Geotechnique, 61(1):59-73.
[28] Yoshimine, M., Ishihara, K., 1998. Flow potential of sand during liquefaction. Soils and Foundations, 38(3):187-196.
Open peer comments: Debate/Discuss/Question/Opinion


Open peer comments: Debate/Discuss/Question/Opinion
<1>