Affiliation(s):
1.
Department of Civil Engineering, Shanghai Jiao Tong University, Shanghai 200240, China; moreAffiliation(s): 1.
Department of Civil Engineering, Shanghai Jiao Tong University, Shanghai 200240, China; 2.
School of Civil Engineering and Architecture, East China Jiaotong University, Nanchang 330013, China; 3.
Research Center of Coastal and Urban Geotechnical Engineering, Zhejiang University, Hangzhou 310058, China; less
Qi-yin Zhu, Ze-xiang Wu, Yan-ling Li, Chang-jie Xu, Jian-hua Wang, Xiao-he Xia. A modified creep index and its application to viscoplastic modelling of soft clays[J]. Journal of Zhejiang University Science A, 2014, 15(4): 272-281.
@article{title="A modified creep index and its application to viscoplastic modelling of soft clays", author="Qi-yin Zhu, Ze-xiang Wu, Yan-ling Li, Chang-jie Xu, Jian-hua Wang, Xiao-he Xia", journal="Journal of Zhejiang University Science A", volume="15", number="4", pages="272-281", year="2014", publisher="Zhejiang University Press & Springer", doi="10.1631/jzus.A1300331" }
%0 Journal Article %T A modified creep index and its application to viscoplastic modelling of soft clays %A Qi-yin Zhu %A Ze-xiang Wu %A Yan-ling Li %A Chang-jie Xu %A Jian-hua Wang %A Xiao-he Xia %J Journal of Zhejiang University SCIENCE A %V 15 %N 4 %P 272-281 %@ 1673-565X %D 2014 %I Zhejiang University Press & Springer %DOI 10.1631/jzus.A1300331
TY - JOUR T1 - A modified creep index and its application to viscoplastic modelling of soft clays A1 - Qi-yin Zhu A1 - Ze-xiang Wu A1 - Yan-ling Li A1 - Chang-jie Xu A1 - Jian-hua Wang A1 - Xiao-he Xia J0 - Journal of Zhejiang University Science A VL - 15 IS - 4 SP - 272 EP - 281 %@ 1673-565X Y1 - 2014 PB - Zhejiang University Press & Springer ER - DOI - 10.1631/jzus.A1300331
Abstract: Conventional consolidation tests on reconstituted specimens of numerous natural soft clays show a decreasing of creep index Cαe with increasing soil density. Based on all selected and conducted experimental results, a modified creep index Cαe* defined in double logarithmic plane lge-lgt, was plotted for various clays, from which Cαe* can be assumed as a constant for different soil densities. Then, the modified creep index was applied to a newly developed elastic viscoplastic model. In this way, the modified creep index Cαe* can naturally take into account the nonlinear Cαe revealing the influence of soil density in the soil assemblies without additional parameters. Finally, the enhanced model was incorporated into the finite element code ABAQUS and used to simulate a consolidation test and a test embankment. The improvement of simulations by the modified creep index was highlighted by comparing simulations using the conventional creep index Cαe.
Darkslateblue:Affiliate; Royal Blue:Author; Turquoise:Article
Article Content
1. Introduction
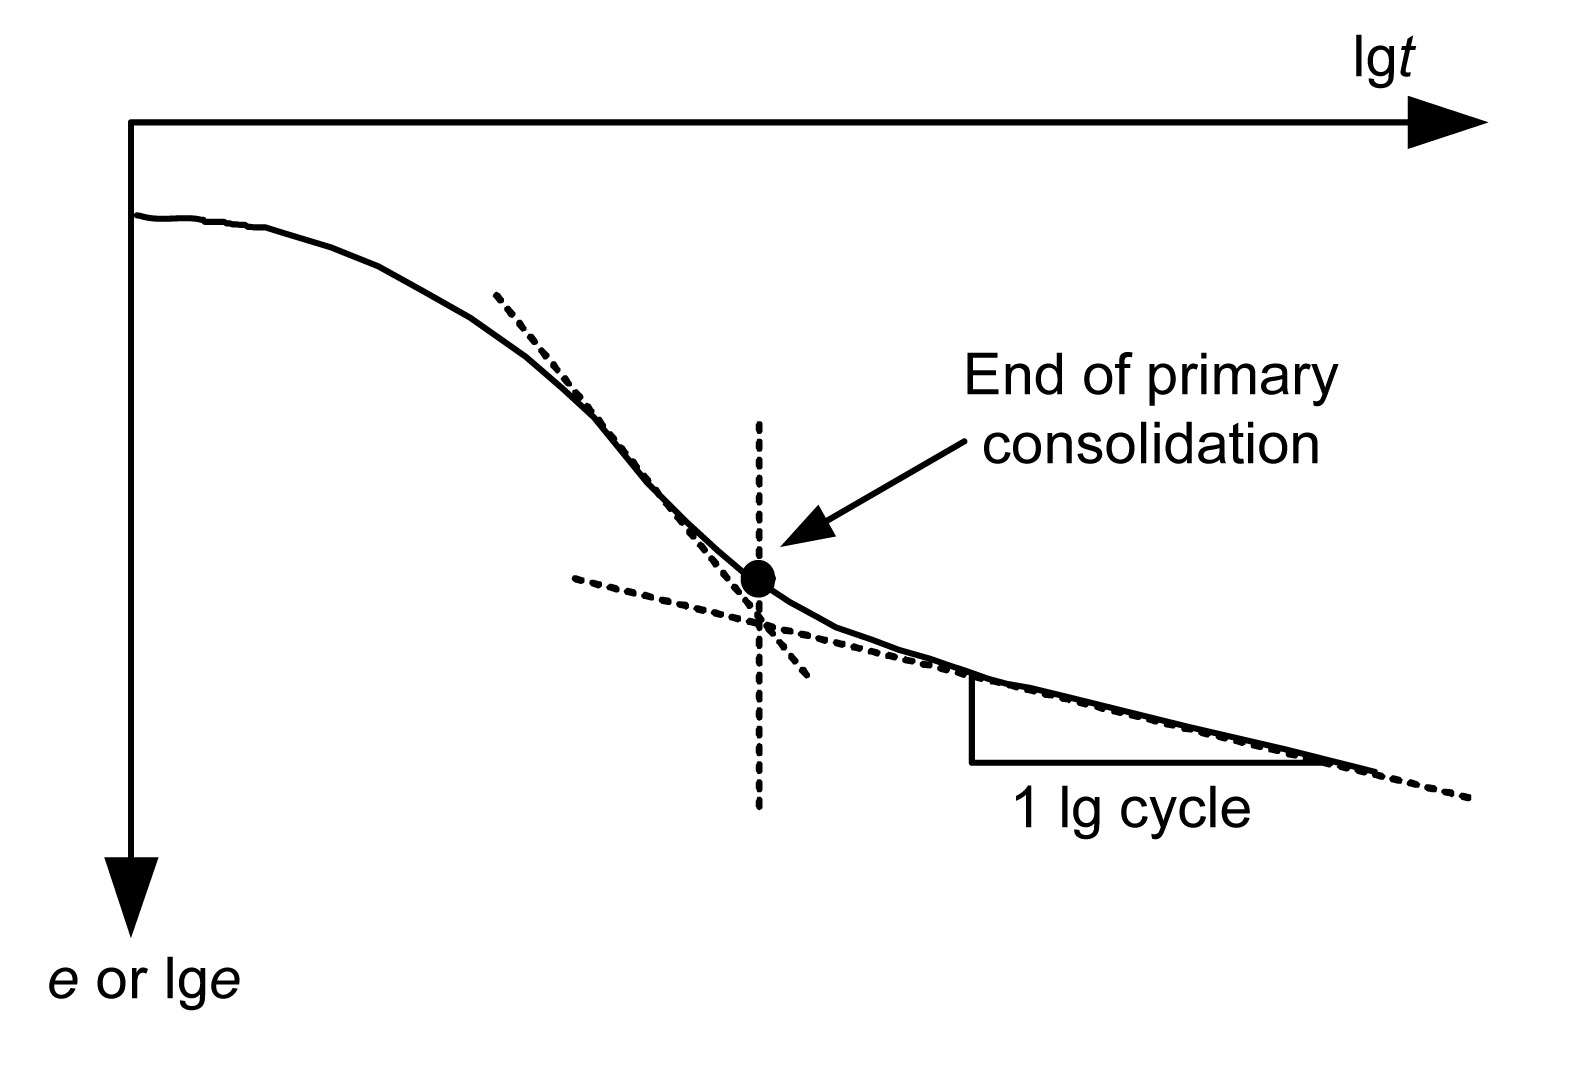
From real construction projects, it is well known that soft clays exhibit time-dependent behaviors due to their viscosity (Mesri and Godlewski, 1977; Leroueil et al., 1985; Yin et al., 2002; Augustesen et al., 2004; Yin and Hicher, 2008; Yin and Wang, 2012). The creep index Cαe, conventionally expressed by Cαe=Δe/Δlgt (where e is the void ratio and t is the time) based on conventional consolidation test (1D) (Fig. 1), is widely used to describe the time-dependent behavior and develop viscoplastic models (Kutter and Sathialingam 1992; Leoni et al. 2008; Yin et al., 2010; 2011a; 2011b; Zhu et al., 2013). In these models, Cαe is usually suggested as a constant value. However, this method has a flaw that when the time up to infinite, the void ratio will become negative. Therefore, a precise and reasonable description of Cαe is practically important for viscoplastic modelling of soft clays and geotechnical simulations.
Fig.1 Definition of creep index
In this study, the evidence of Cαe variation with void ratio (reflecting soil density) is first investigated. The limitation of current approaches in describing the Cαe variation is then discussed. A modified creep index is proposed based on this Cαe variation of soft clays. Applying this modified creep index to an elastic viscoplastic model, an enhanced model accounting for the influence of soil density in soils is developed. The model is implemented into a finite element code and used to simulate a 1D consolidation test and a test embankment for the validation.
2. Evidence of Cαe variation with void ratio
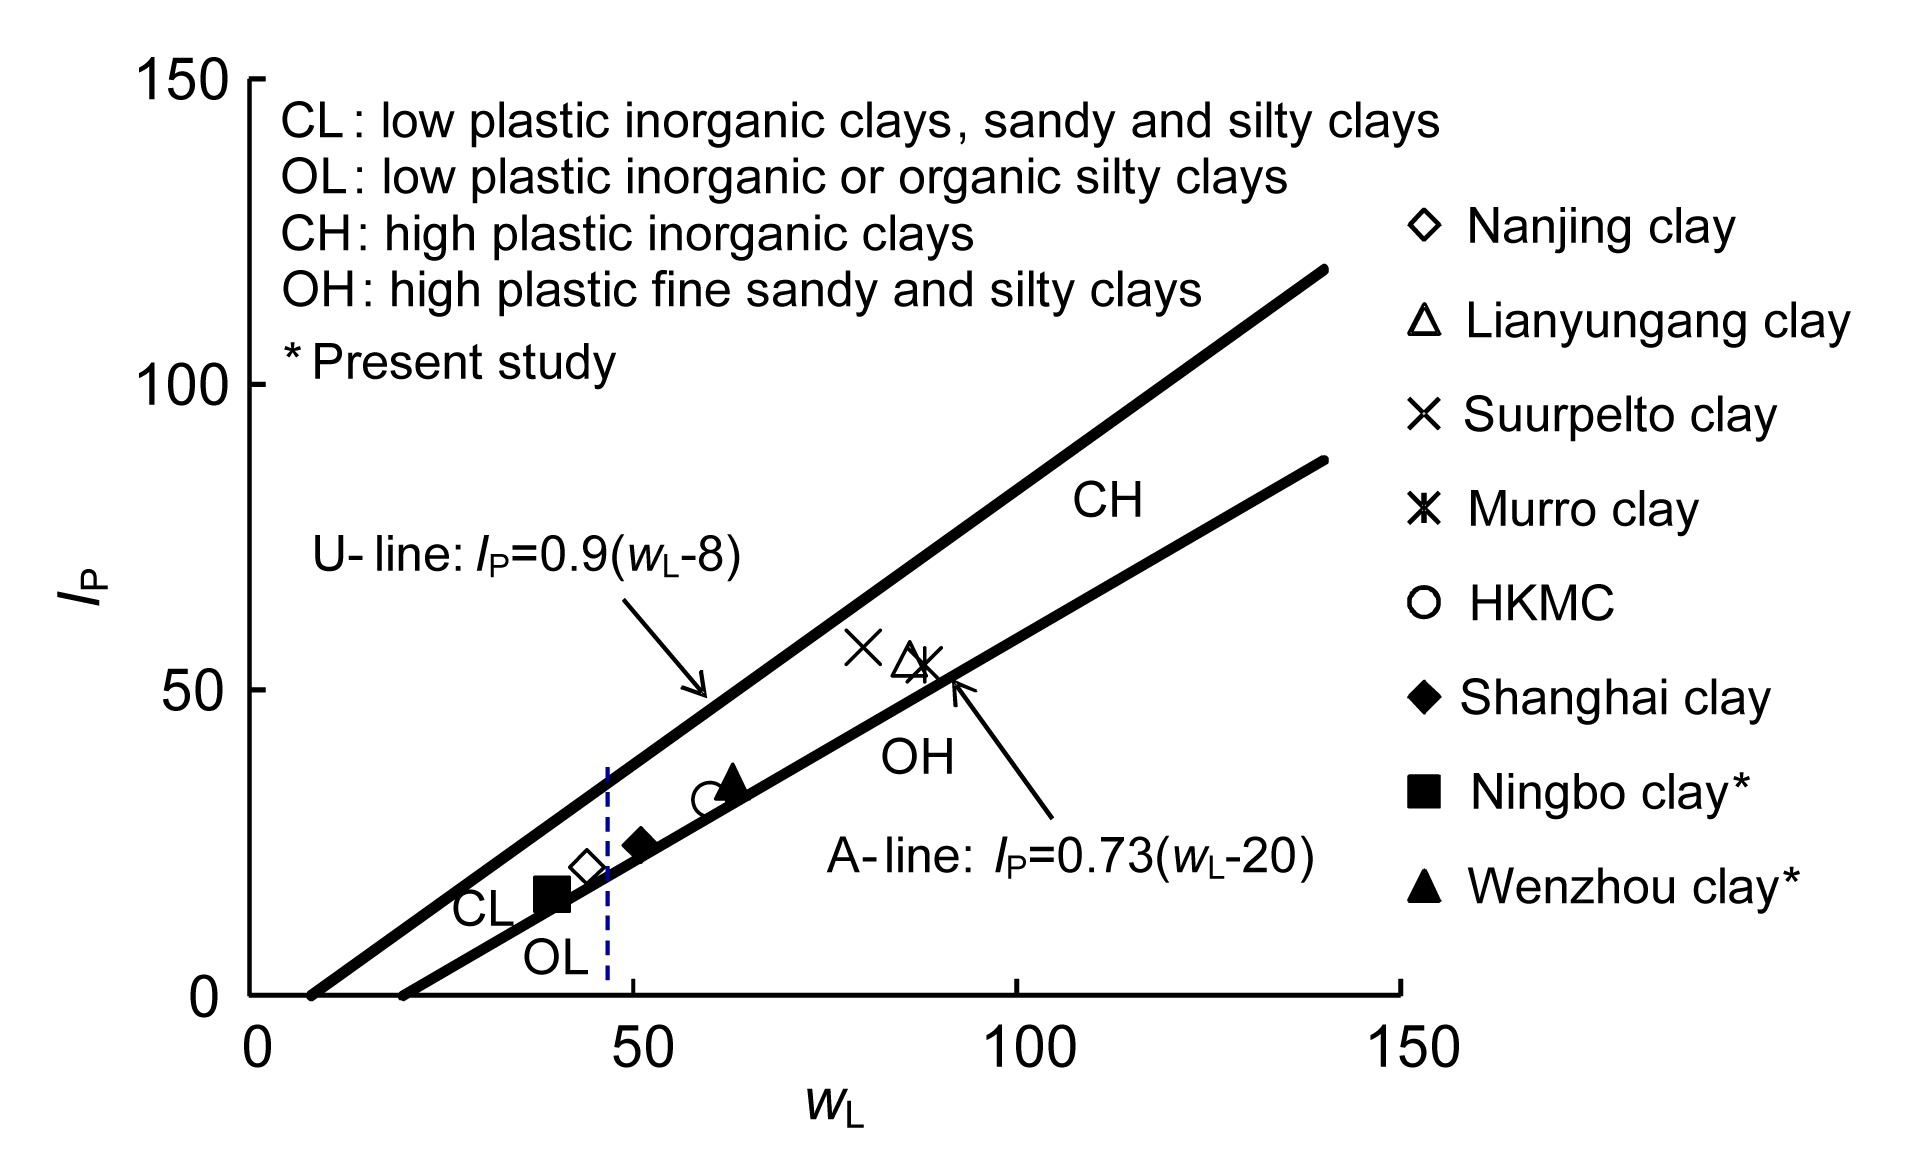
Conventional consolidation tests on six clays in various studies and two clays in the present study with their physical properties (Table 1) were selected. All of the selected experiments were conducted on reconstituted specimens to eliminate the effect of destructuration. The plasticity chart of these soils is shown in Fig. 2 plotted by liquid limit wL and plasticity index IP. According to this chart, all selected clays cover low plastic and high plastic inorganic clays.
Table 1
Summary of creep indexes and physical properties of typical reconstituted clays under normally consolidated state
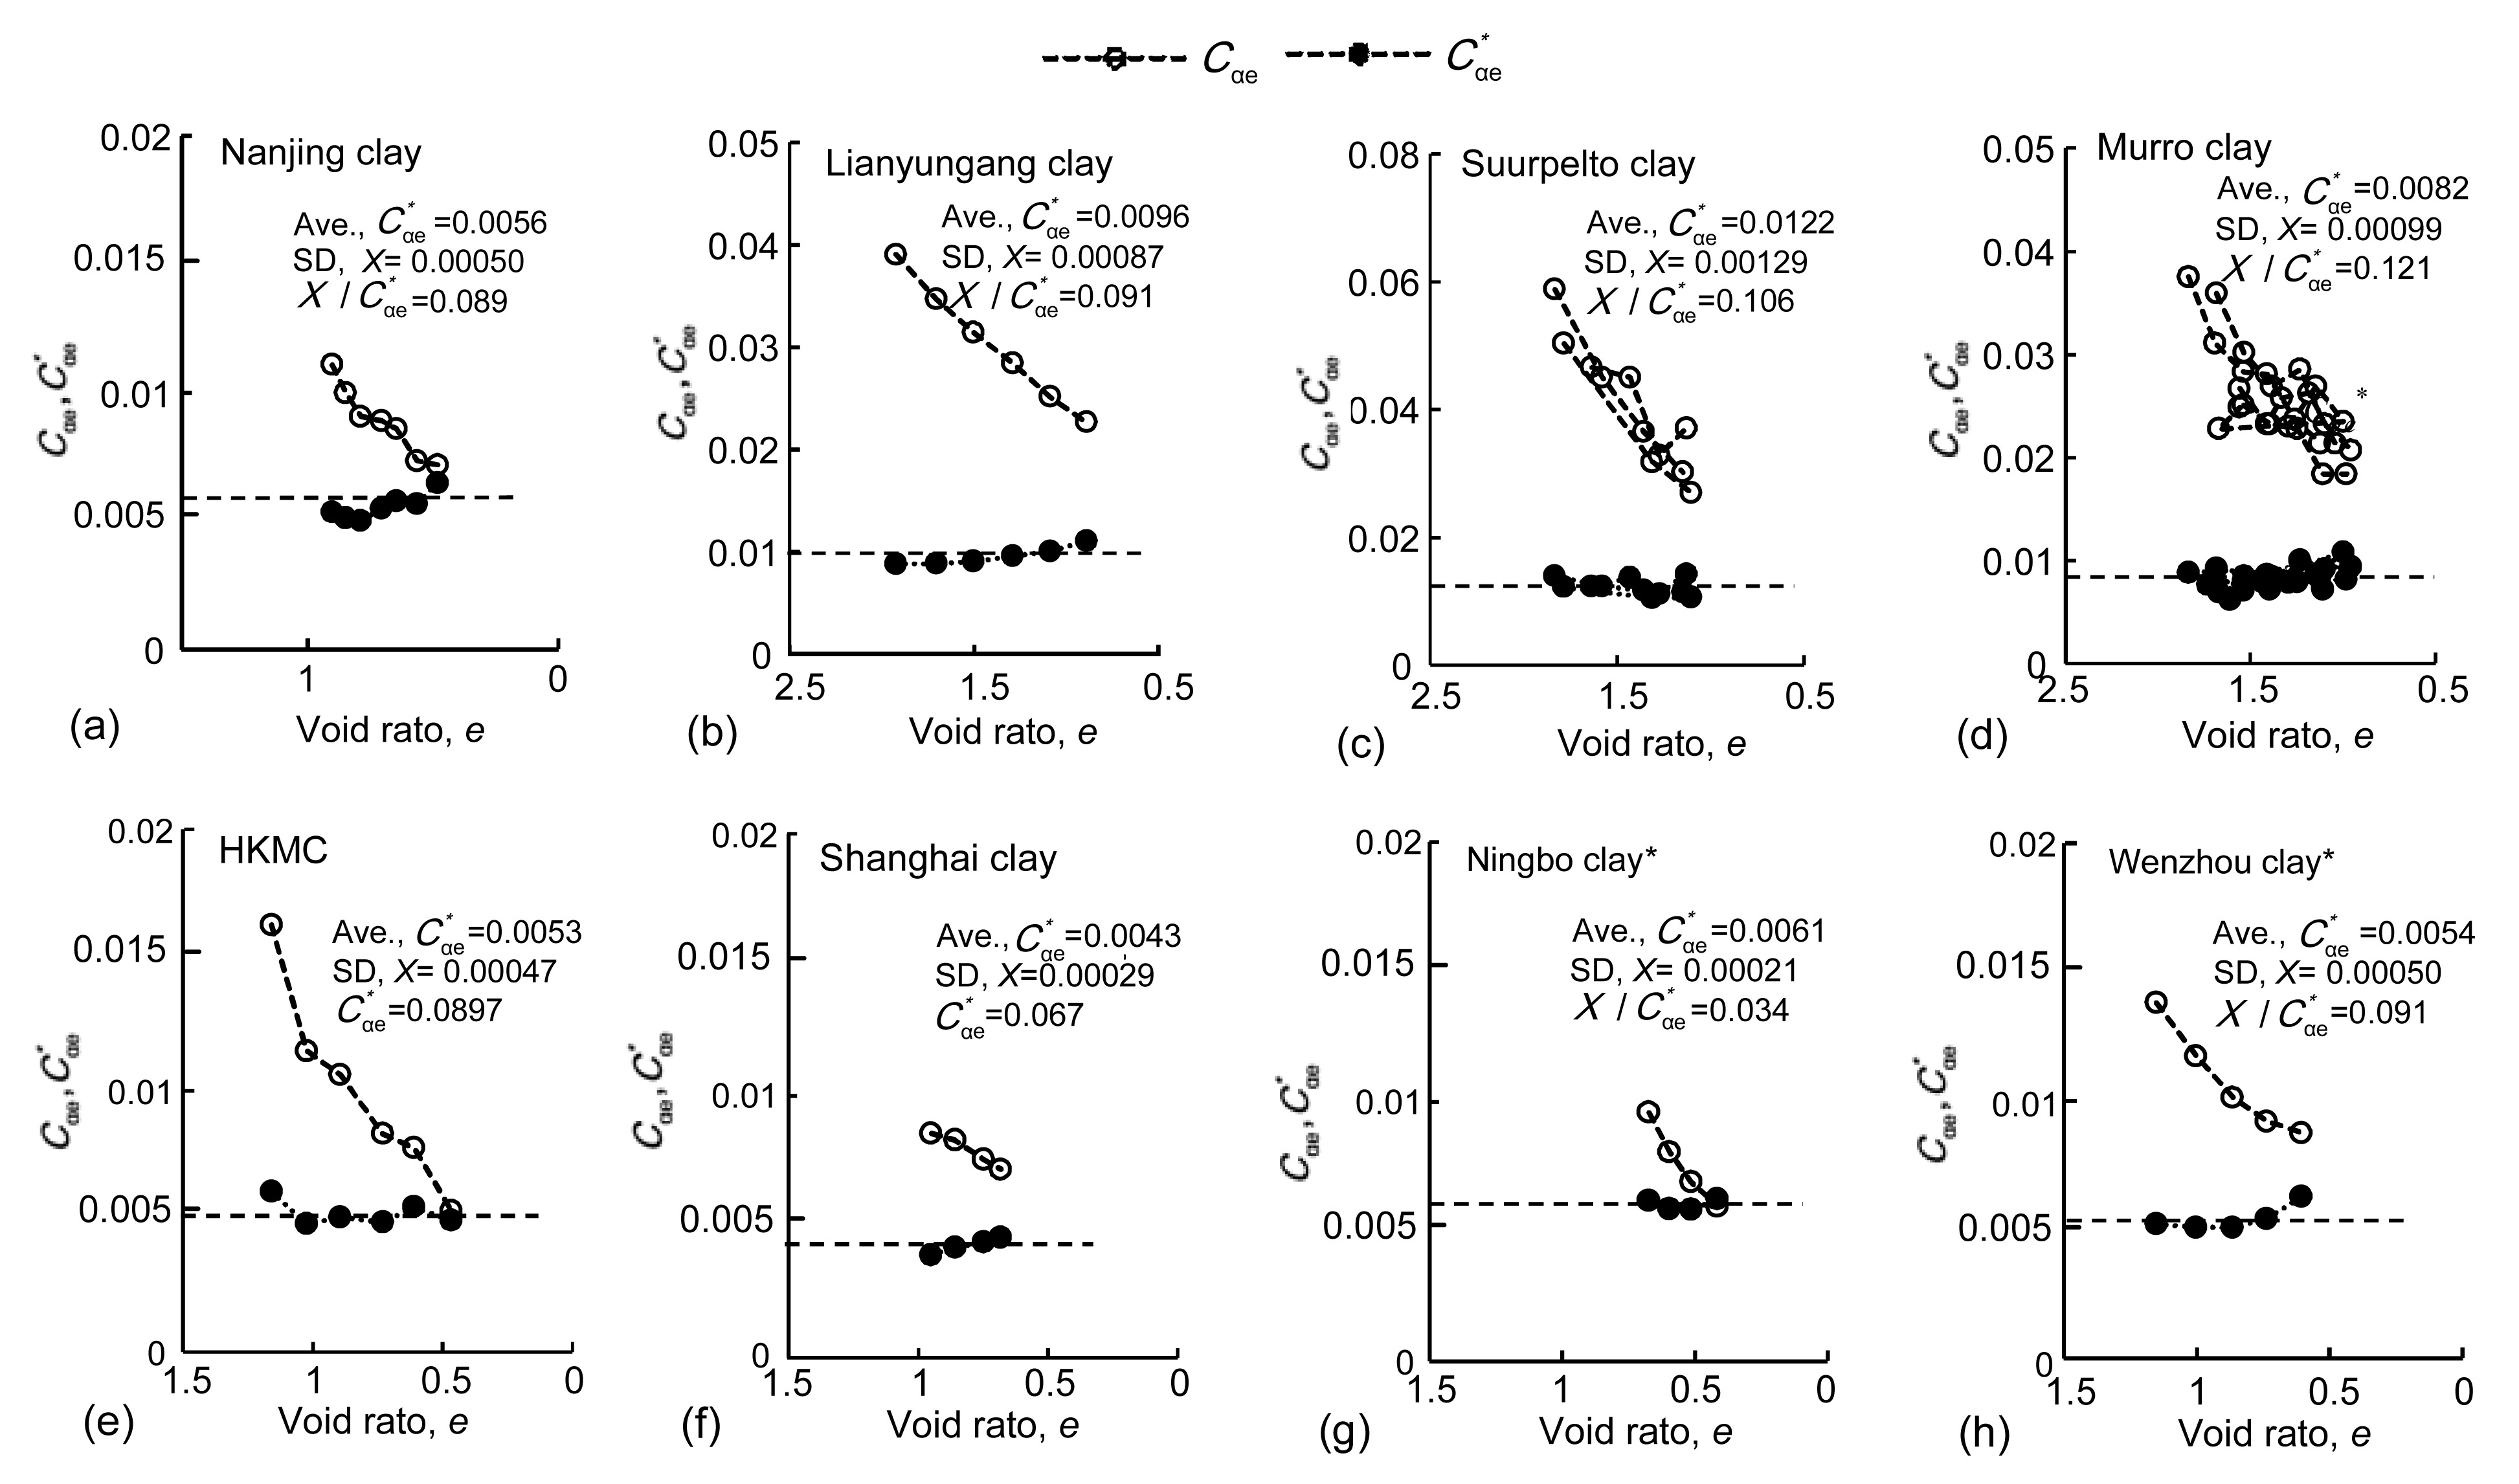
Since the void ratio can reflect the physical conditions and represent the deformation potential of soils, the evolution of Cαe for all selected clays was plotted against the void ratio (Fig. 3). Although the initial void ratio for all selected clays is varied, the creep behavior of each clay at a normally consolidated range is almost the same from Fig. 3a to Fig. 3h, i.e., Cαe is decreasing with a decreasing of the void ratio for all clays.
Fig.3 Conventional consolidation tests on reconstituted clays (a)–(h): creep index Cαe and modified creep index Cαe* versus void ratio *Present study
3. Limitation of current approaches
To describe the evolution of Cαe during creep, based on the experiments on Hong Kong deposited clay, Yin et al. (2002) proposed a formulation according to the nonlinear behavior of Cαe:
,
where is the rate of viscoplastic volumetric strain; V=1+e0 is the initial specific volume and e0 is the initial void ratio; Cαe0 is the initial value of Cαe for each load stage; τ is a time-dependent parameter, and τ=1 d corresponding to the 1D consolidation test; εvm is the volumetric strain relating to the current mean effective stress pm; is the reference volumetric strain corresponding to pm0; is equal to e0/V. Eq. (1) describe that Cαe decreases with time under constant stress levels without extra model parameters. However, when the applied stress is changed, the strain-rate is always accounted from the initial value Cαe0 and there will be a jump of Cαe between two different stress levels. As a result, this formulation cannot reproduce the consecutively decreasing Cαe with different stress levels or soil densities. Later on, Karim et al. (2010) proposed a function describing the nonlinear behavior of Cαe by the distance between the current and initial stress level. However, this method has the same deficiencies as Eq. (1).
Based on the linear relationship between (1+e) and t in the double logarithmic plane, Zeng et al. (2012) gave a definition of CαL as
.
Eq. (2) describes that Cαe will consecutively decrease with decreasing void ratio. However, due to its mathematical structure, Eq. (2) will deduce a negative void ratio when the creep is infinite.
In conclusion, it is desirable that the creep formulation at least should have the following attributes: (1) Cαe should consecutively decrease with the applied stress level or soil density; (2) the void ratio should always be positive during creep.
4. Proposed modified creep index
In this study, we proposed a modified creep index Cαe* defined as the slope of the lge-lgt curve of 1D consolidation test, which can be written as
.
Comparing Eq. (3) with Eq. (2), the only difference is that 1+e is substituted by e. The definition method for Cαe* is similar to the concept adopted by Hong and Onitsuka (1998) and Hong (2007) in the studies of compression curves in double logarithm planes for natural clays.
With Eq. (3), we calculated Cαe* of all the selected clays in Fig. 3 at different void ratios. Then, the evolution of Cαe* with void ratios was also plotted in Fig. 3. It can be found that for all clays Cαe* slightly changes with the void ratio, and can be assumed as a constant. Then the average Cαe* for clays was calculated and plotted in Fig. 3 with the horizontal dash line. Furthermore, the standard deviation (SD, ,
x represents random variable values and E(x) is their average value) and the ratio of the SD to the averaged Cαe* (X/Cαe*) were calculated and listed on each figure. As shown in Fig. 3, X/Cαe* varies from 0.034 to 0.121. Generally speaking, errors are within the acceptable range for geomaterials. Therefore, it is reasonable to consider Cαe* as a constant. Therefore, based on Eq. (3), the value of the creep index decreasing with a decreasing of void ratio is obtained by
.
Actually, Eq. (4) can capture all the essential features listed above for a creep formulation. First, Eq. (4) can be easily incorporated into elastic viscoplastic models without any additional parameters. Second, Cαe is related to the void ratio; therefore, Cαe will decrease consecutively with the void ratio during creep or loading. Third, benefiting from the mathematical structure of the logarithmic scale, the void ratio can always be positive when creeping.
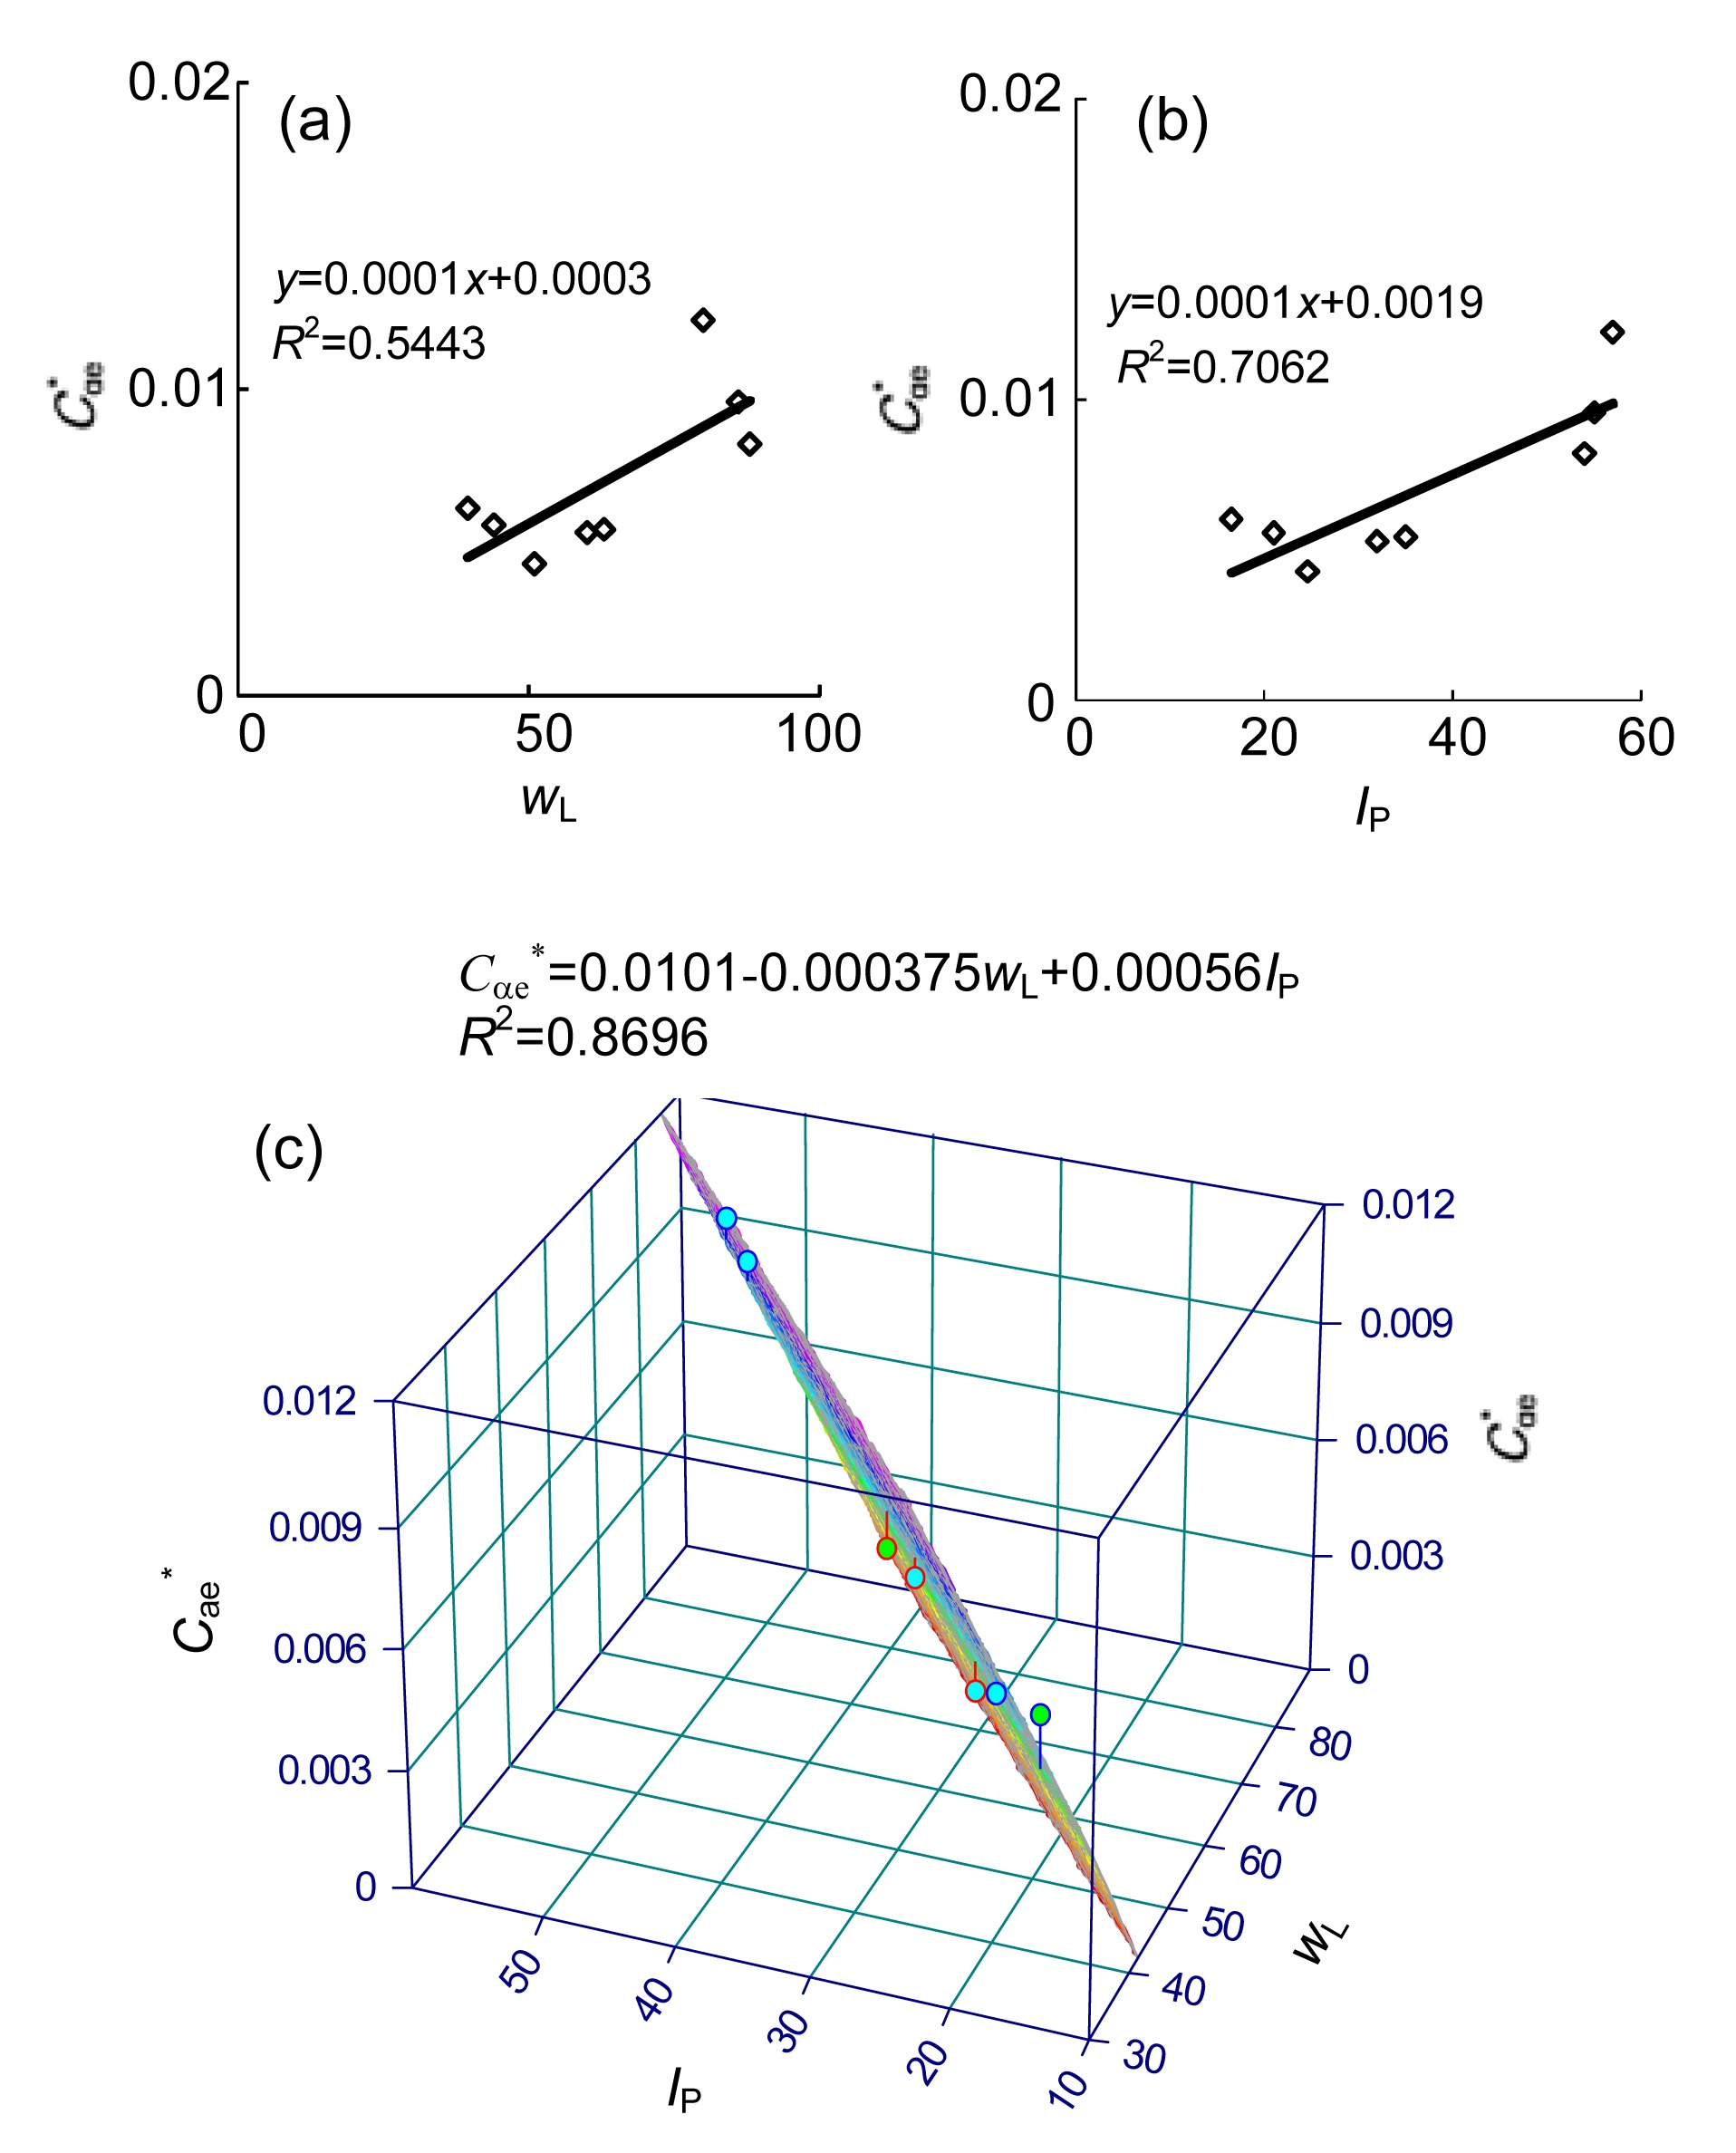
In addition, based on the available experimental tests, we investigated the correlations between Cαe* and the Atterberg limits. Figs. 4a and 4b show the variation of Cαe* with wL and IP, respectively. Fig. 4c shows that the accuracy of the correlation of Cαe* with wL and IP is increasing by using a simple linear formula based on the method of least squares with R2=0.8696. Therefore, the correlation of Cαe* with the Atterberg limits is proposed as follows:
.
Fig.4 Relationship between modified creep index Cαe* and Atterburg limits
5. Elastic viscoplastic (EVP) model using a modified creep index
In this section, the proposed modified creep index will be incorporated into a recently developed elastic viscoplastic (EVP) model to consider the density effect of soft clays.
5.1. Brief introduction of adopted EVP model
Recently, based on the strain rate-dependency of the preconsolidation pressure, Yin et al. (2010; 2011a; 2011b) developed an EVP model which can consider the characteristics of anisotropy, destructuration and viscosity of natural clays. The key constitutive relationships are:
,
,
,
.
where σd and αd are the deviatoric stress and fabric tensor, respectively; p′ is the mean effective stress; equals size of reference yield surface; represents the size of the dynamic loading surface relating to the current stress state; the soil constants ξ and ξd control the effect of viscoplastic volumetric () and deviatoric () strains in destroying the bonds; fd is the dynamic yield surface; G is the shear modulus; is the K0 consolidation critical stress ratio. Model parameters with their definitions are summarized in Table 2. Details of the model can be found in (Yin et al., 2010; 2011a; 2011b). As determined by Kutter and Sathialingam (1992), the constitutive relationship Eq. (6) follows the hypothesis of Bjerrum (1967) that there is no “instant compression” in elastic strains, which does not mean the creep does not occur before the end of the primary consolidation (EOP).
Table 2
Model parameters and definitions
Group
Parameter
Definition
Standard model parameter
Initial reference preconsolidation pressure
e0
Initial void ratio
ν
Poisson’s ratio
κ
Swelling index
λi
Intrinsic compression index
M
Slope of the critical state line
Anisotropy parameter
α0
Initial anisotropy
ω
Absolute rate of yield surface rotation
ωd
Relative rate of yield surface rotation
Destructuration parameter
χ0
Initial amount of bonding
ξ
Absolute rate of bond degradation
ξd
Relative rate of bond degradation
Viscosity parameter
Cαe*
Creep index
Hydraulic parameter
kv0, kh0
Initial permeability
ck
Permeability coefficient
5.2. Incorporation of modified creep index
Substituting Eq. (4) into Eq. (6), the constitutive equation in the form of total strain-rate can be written as
.
Then, the EVP model was enhanced by considering the density effect of soft clays. According to Eq. (10), no additional parameter is required in comparing with the older equation versions of Yin et al. (2011a; 2011b). The value of Cαe* can be easily measured based on the conventional consolidation test or by the Atterberg limit based on Eq. (5).
5.3. Finite element implementation
Based on a numerical solution proposed by Katona (1984), the original and enhanced elastic viscoplastic models were numerically implemented into the finite element code ABAQUS (version 6.10) as user-material soil models.
For a soil-water coupled analysis based on Biot’s consolidation theory, the load increment is given by applying the principle of virtual work to the equilibrium equation. The coupled analyses of the finite element method are well conducted by various studies (Oka et al., 1986; Hinchberger and Rowe, 1998; Karstunen and Yin, 2010). According to experimental data, the evolution of the permeability with the void ratio can be described as
,
where the initial permeability k0 is corresponding to the initial void ratio; permeability coefficient ck can be easily measured from the 1D consolidation experimental results by plotting e-lgk. The sensitive study of parameters in the model have been discussed in details by Yin et al. (2010; 2011a; 2011b). Consequently, the emphasis of the following section will only focus on the effectiveness of the proposed creep index.
6. Model verification
To evaluate the predictive ability of the enhanced model considering the soil density effect, a 1D consolidation test on a reconstituted specimen of Wenzhou clay and a test embankment were simulated.
6.1. 1D consolidation test
A full load stage 1D consolidation test was conducted on Wenzhou clay with its creep indexes shown in Fig. 3h. The destructuration process of reconstituted clays are neglected. Therefore, the parameters related to soil structure are set to zero in the simulation. The values of other parameters measured from laboratory tests are summarized in Table 3.
Table 3
Parameters of EVP model for the consolidation test on Wenzhou clay
ν
λ
κ
e0
Mc
0.3
0.185
0.035
1.38
1.23
Cαe*
(kPa)
τ
kv0 (m/h)
ck
0.0054
40
24
3.6×10⁻⁴
0.6
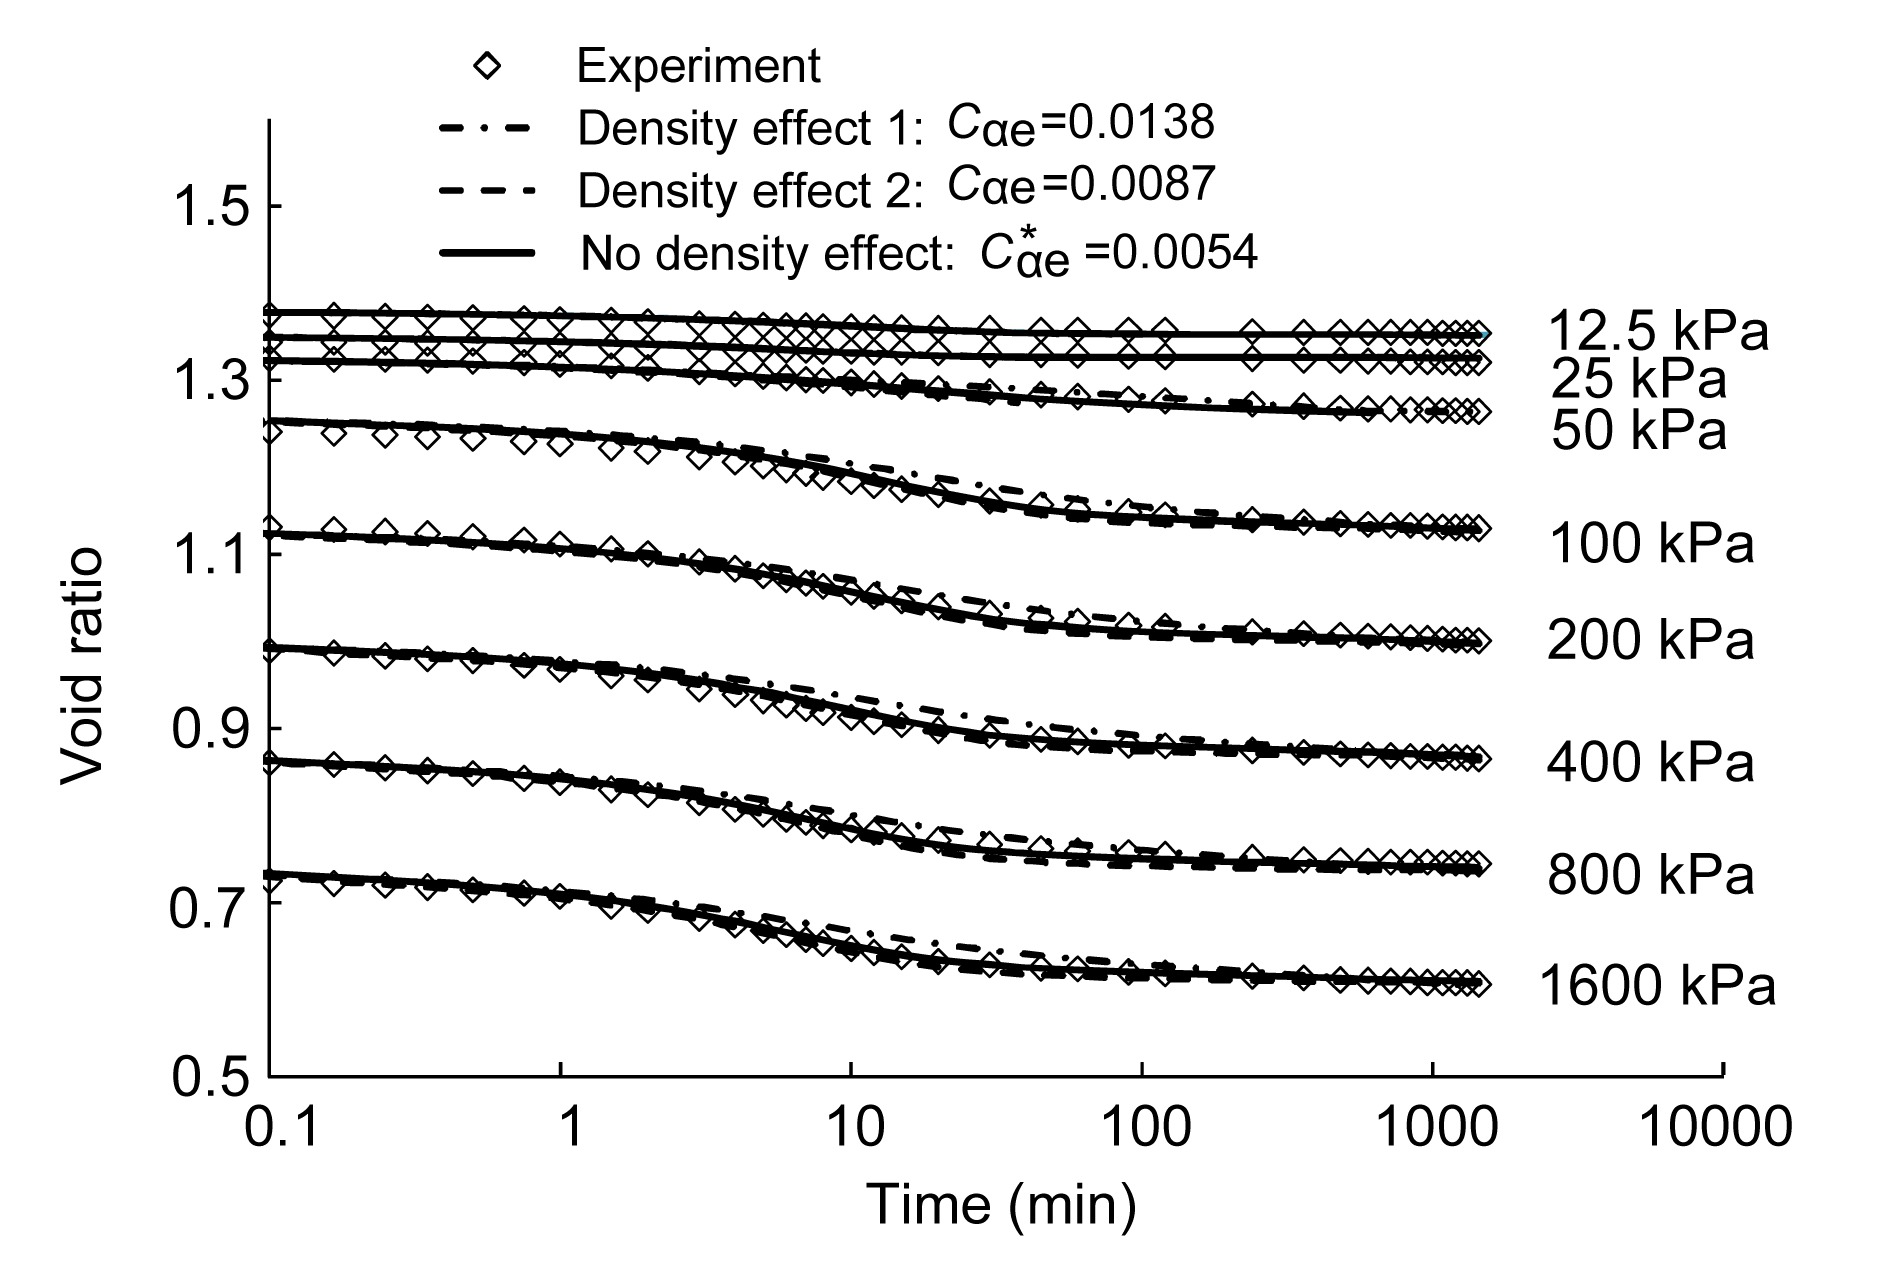
The modified creep index Cαe*=0.0054 was used in the simulation as plotted in Fig. 3h. To highlight the improvement by the consideration of the soil density effect, two additional simulations were carried out with constant Cαe=0.0138 (the maximum value shown in Fig. 3h) and 0.0087 (the minimum value shown in Fig. 3h).
All simulated results and experimental data were plotted in terms of the void ratio versus time. Fig. 5 shows that the simulated results of Cαe=0.0138 without density effect keep a high creep rate, and the simulated results of Cαe=0.0087 without density effect keep a low creep rate during the test. By comparison, it can be seen that the simulation of Cαe*=0.0054 with density effect can predict the consecutively decreasing creep rate with stresses and void ratios. Thus, the consideration of the soil density effect can greatly improve the predictive ability of the EVP model. Note that the identical predicated void ratio by models with and without accounting for the density effect at the end of each load stage with 1 d duration is assured following the principle of the model. Thus, the comparison of the creep rate between different models can be clearly observed.
Fig.5 Simulations of 1D consolidation test on reconstituted Wenzhou clay
6.2. Murro test embankment
6.2.1. Element properties and boundary conditions
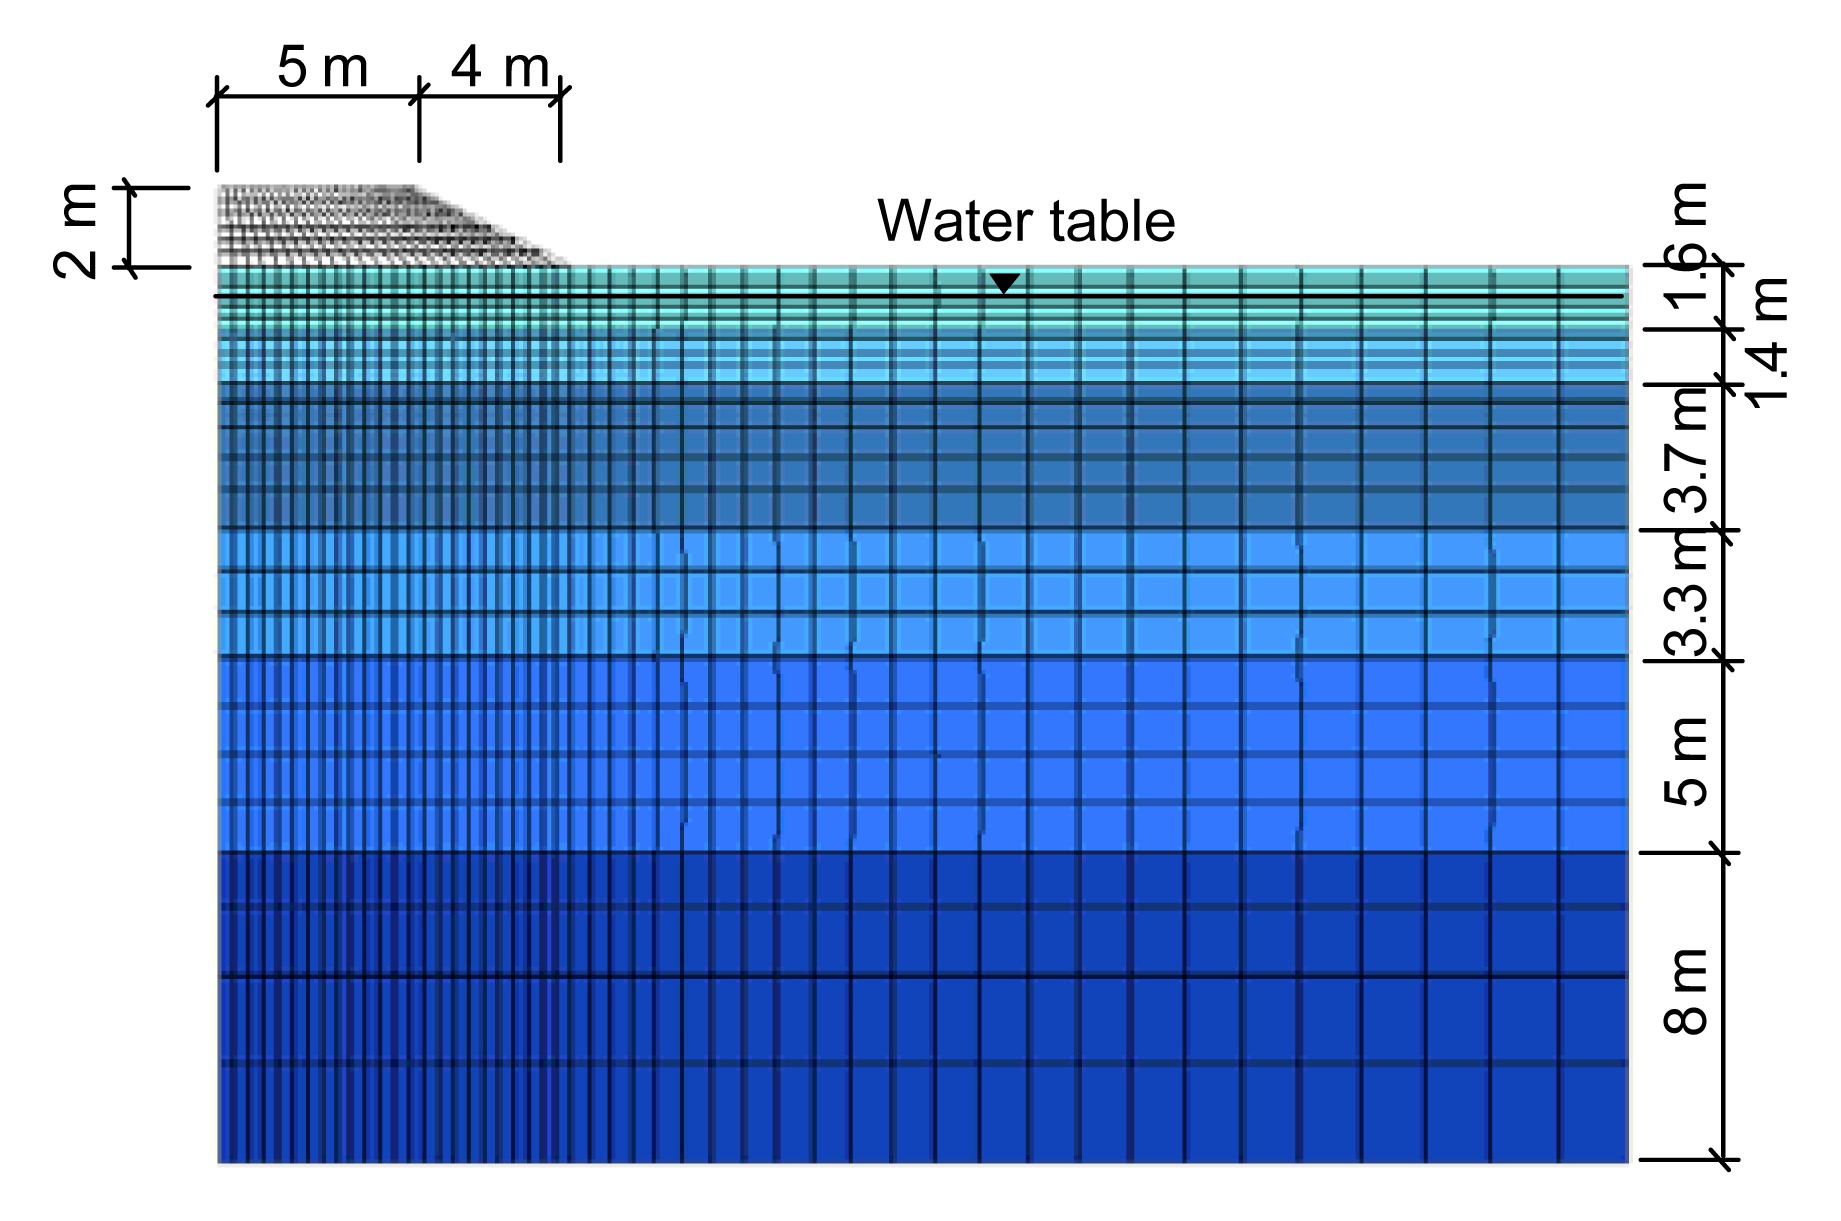
The Murro test embankment was constructed on a soft clay deposit in Finland in 1993, which has been studied by Karstunen et al. (2005), Karstunen and Yin (2010) and Yin et al. (2011a; 2011b). In the finite element method analysis, the plain strain condition was assumed and the finite element mesh is shown in Fig. 6. The groundwater table was located at a depth of 0.8 m. The horizontal boundary was 36 m away from the embankment center-line and the vertical boundary is at a depth of 23 m. The horizontal displacements were fixed in the lateral boundaries, and the vertical and horizontal displacements were fixed at the bottom. The finite element model consists of 1680 elements resulting in 4562 nodes. The stress-strain behavior of the embankment fill was modelled by Mohr-Coulomb model and typical values of model parameters were summarised as: Young’s modulus E=40 000 kPa, Poisson’s ratio v=0.35, friction angle ϕ=40°, and unit weight γ=19.6 kN/m3. The construction of the embankment took 2 d and the same was simulated in the modelling.
Fig.6 Finite element analysis mesh
6.2.2. Parameters of foundation clays
1D consolidation tests on high quality natural clays were conducted and selected to determine the parameters for the enhanced model. The modified creep index Cαe*=0.0082 determined from Murro clay at 7 m depth (Fig. 3d) was used for layer 4. Using the same method, we also measured Cαe* for all the other layers and used it for the simulation, as listed in Table 3. Other parameters used in the modelling by Karstunen and Yin (2010) and Yin et al. (2011a; 2011b) were adopted (Table 4) and the details of the process of determination will not be repeated here. To study the influence of soil density, one extra test was simulated with a constant Cαe as listed in Table 4. The constant Cαe for each soil layer was the averaged value of Cαe at the normally consolidated state.
Table 4
Enhanced EVP model parameters for subsoil of Murro embankment
Depth (m)
γ (kN/m3)
e0
Mc
K0
κ
λi
ν
Cαe*
0.0–1.6
16.1
1.57
1.7
1.25
0.01
0.18
0.3
0.0051
1.6–3.0
15.7
1.81
1.7
0.34
0.024
0.18
0.3
0.0061
3.0–6.7
14.4
2.45
1.65
0.35
0.041
0.25
0.3
0.0081
6.7–10.0
15.2
2.16
1.5
0.4
0.024
0.21
0.3
0.0082
10.0–15.0
15.7
1.76
1.45
0.42
0.024
0.21
0.3
0.0061
15.0–23.0
16.2
1.53
1.4
0.43
0.02
0.15
0.3
0.0053
Depth (m)
(kPa)
χ0
ξ
ξd
kv0 (m/h)
kh0 (m/h)
ck
Cαe
0.0–1.6
100
2.5
5
0.2
6.5×10⁻⁴
8.3×10⁻⁴
0.43
0.0201
1.6–3.0
22
6
12
0.2
2.0×10⁻⁵
2.6×10⁻⁵
0.65
0.0224
3.0–6.7
22
6
9
0.2
1.6×10⁻⁵
2.2×10⁻⁵
0.69
0.0278
6.7–10.0
22
6
10
0.2
1.0×10⁻⁵
1.4×10⁻⁵
0.49
0.0254
10.0–15.0
35
4
5
0.2
5.4×10⁻⁶
7.2×10⁻⁶
0.44
0.0219
15.0–23.0
40
6
8
0.2
2.2×10⁻⁶
2.9×10⁻⁶
0.45
0.0198
6.2.3. Settlements
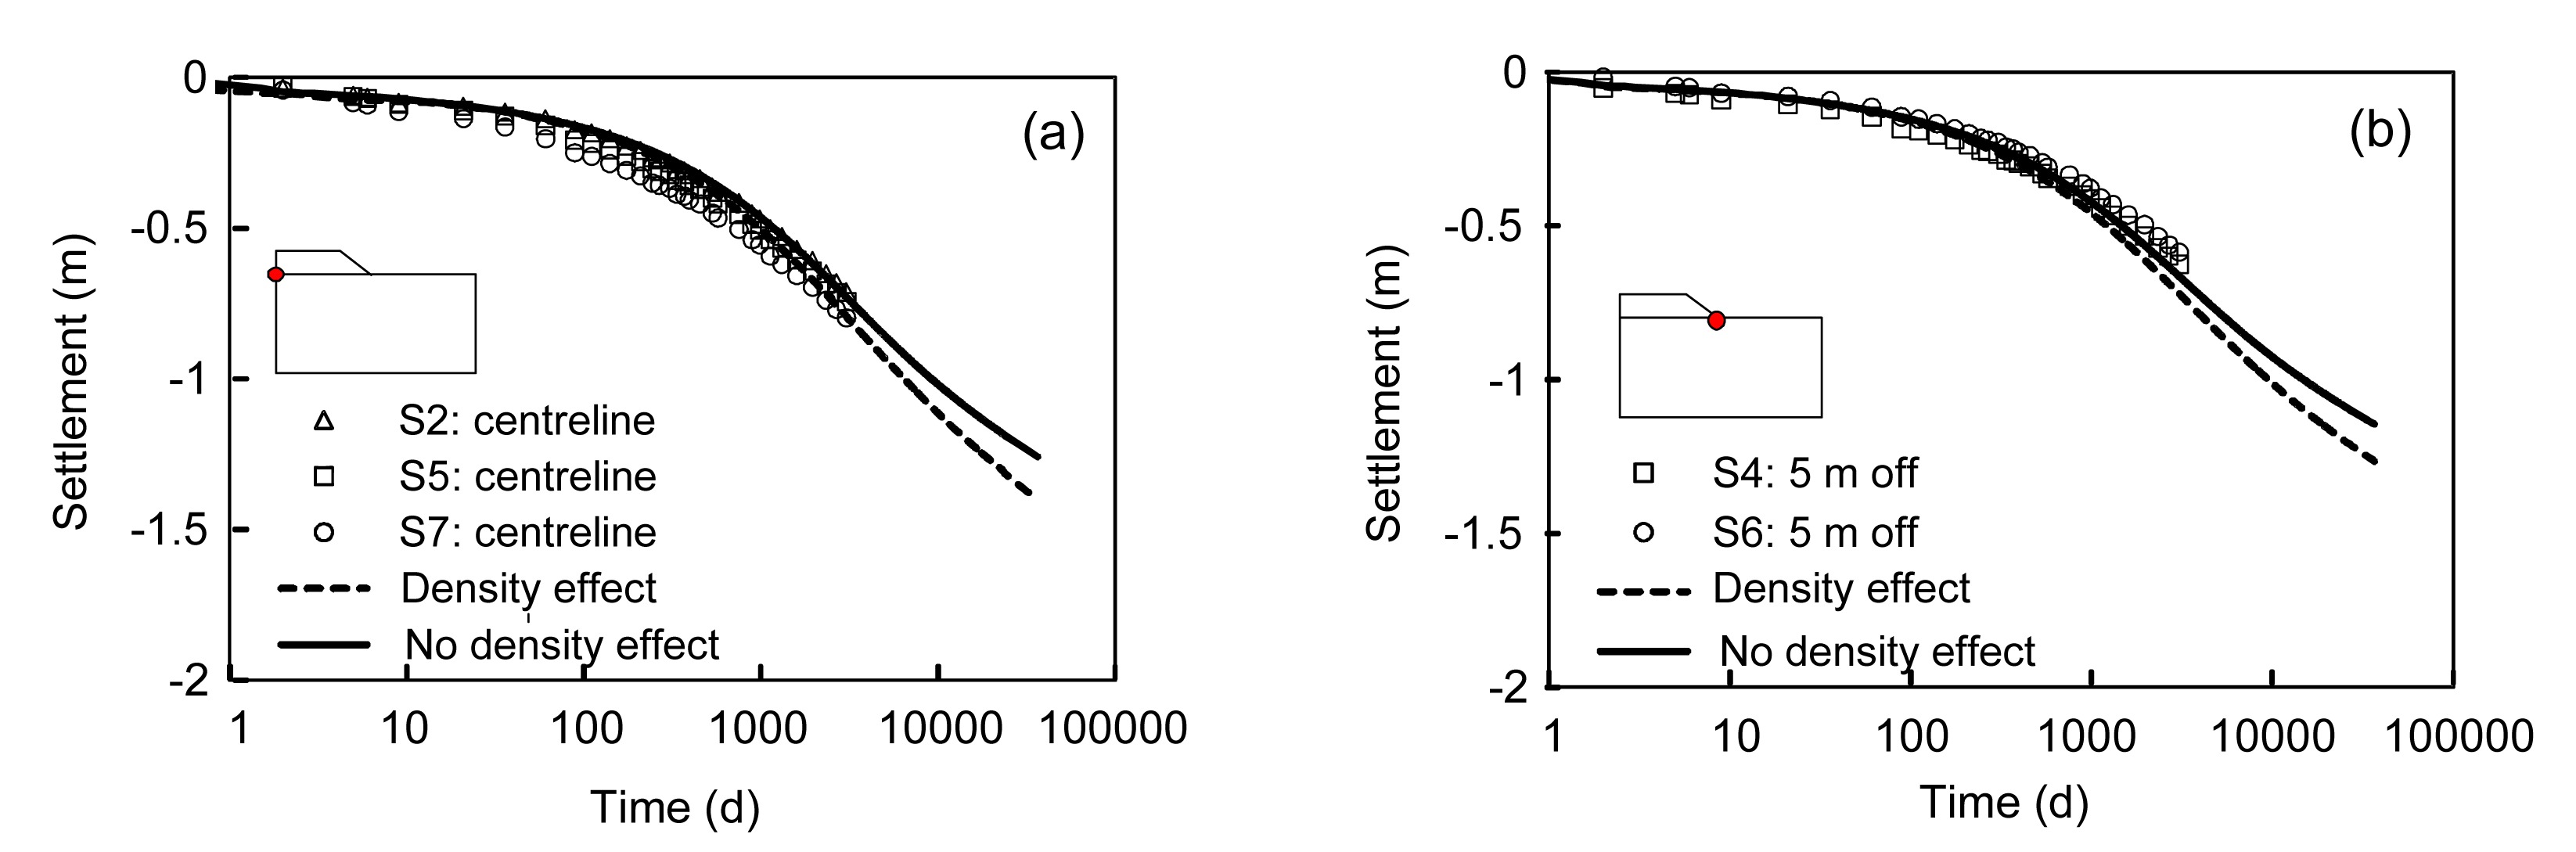
Figs. 7a and 7b present the simulated and observed surface settlements under and 5 m off the centreline of the embankment, respectively. Both creep and modified creep models can very well predict the surface settlements in the short term. The major difference can be found between the simulations with and without consideration of the soil density effect after 1000 d of construction. However, their differences become larger with time increasing. In short, the simulation according to density effect leads to a smaller settlement due to the fact that the creep rate is reduced with the decreasing void ratio. In conclusion, the comparison shows that the consideration of density effect only influences the long-term settlement behavior.
Fig.7 Surface settlements under (a) and 5 m off (b) the centerline
6.2.4. Horizontal displacements
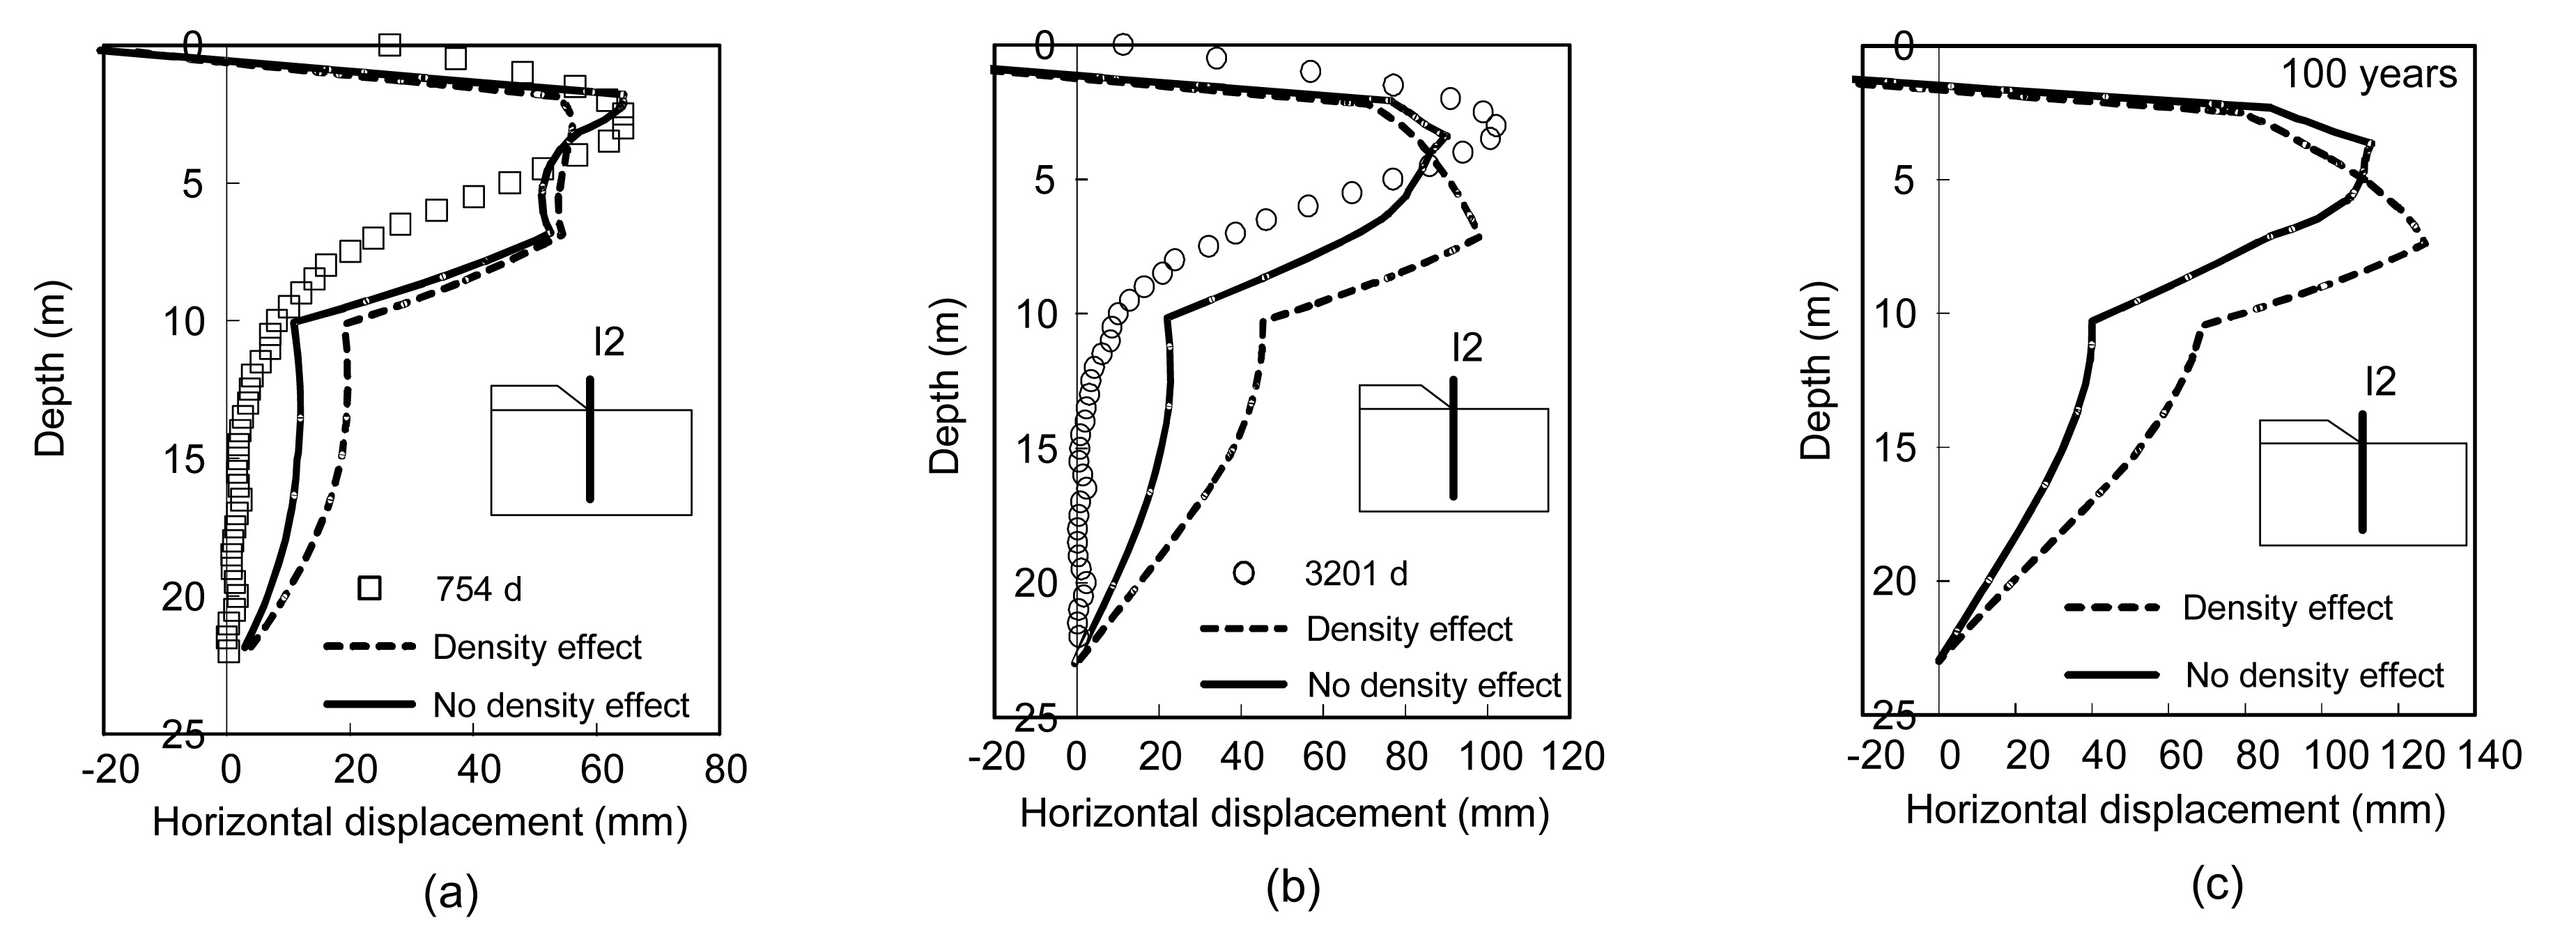
Fig. 8 shows the simulated horizontal displacements of inclinometer I2 by both creep and modified creep models. At 754 d after construction, both models gave the same trend for the horizontal displacement. However, the simulation considering the density effect predicted very well the maximum values with the depth. At 3201 d after construction, the simulation considering density effect predicted a slightly smaller displacement, but also gave an exact depth of the maximum horizontal displacement. At 100 years after construction, the same trend was predicted for horizontal displacement as with the 3201 d and their differences are becoming more and more obvious. Fig. 8 also compared the influence of the soil density on the horizontal displacement and the results show that the influence of soil density is less important than that on the settlements. Note that the differences between simulations and measurements for the horizontal displacement below 13 m were also observed, and this unsatisfying result is probably due to the constant Poisson’s ratio which needs further studies.
Fig.8 Horizontal displacement at I2: (a) 754 d; (b) 3201 d, and (c) 100 years after construction
6.2.5. Excess pore pressure
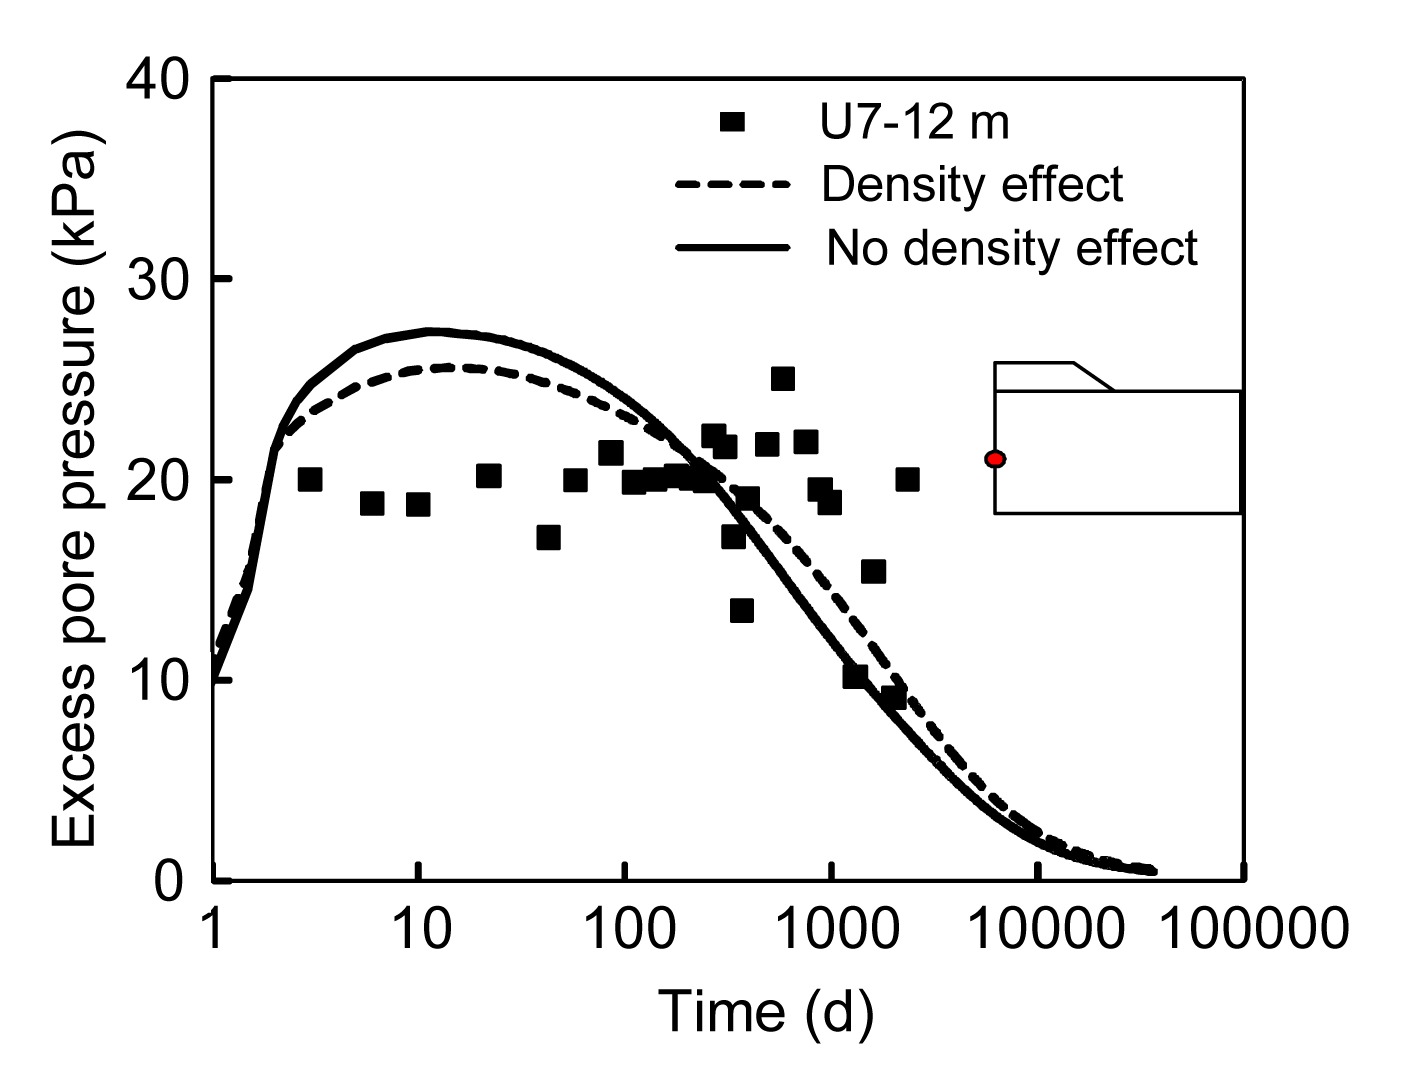
Fig. 9 presents the model simulations with and without the soil density effect for excess pore pressure in the subsoil at 12 m below the ground surface, which before 300 d after construction. The model considering density effect predicted a slightly higher excess pore pressure. However, both simulations show the excess pore pressure gradually dissipating with time and the influence of considering the density effect on its evolution is negligible. Since the dissipation rate of excess pore pressure in the subsoil depends mainly on its permeability, thus, the results are reasonable.
Fig.9 Excess pore pressure at point U7 (12 m depth below ground surface)
Although the predicted horizontal displacements and excess pore pressure by using parameters measured from laboratory tests are generally a little unsatisfactory with the measurements, it does not overly influence the emphasis of this study by comparing the results with and without consideration of the soil density effect. Actually, due to the sample disturbance, the values of the parameters are difficult to be obtained precisely for soft sensitive clay. If the sample disturbance is accounted for by measuring parameters, then the prediction will be improved, which needs to be further investigated. However, it does not mean that the consideration of the soil density effect is not necessary.
7. Conclusions
The evolution of creep index Cαe was investigated throughout the conventional consolidation test on reconstituted specimens of eight natural soft clays. The consecutively decreasing results of Cαe with the void ratio were studied. Then, a modified creep index Cαe* was proposed in the lge-lgt plane. Experimental results show that Cαe* can be assumed as a constant for soft clays.
The proposed modified creep index was substituted into a recently developed EVP model to consider the influence of soil density. No extra parameters and no extra experimental costs are needed for the enhanced model. The model was then introduced into the finite element code ABAQUS for analyzing boundary value problems.
The enhanced model was firstly verified by simulating a 1D consolidation test on a reconstituted sample of Wenzhou clay. Two simulations according to test for the presence of a density effect or not were made and compared to the observed results. The comparisons show that the enhanced model determines very well the consecutively decreasing property of Cαe during the test.
Furthermore, the enhanced model was used to simulate an embankment. The simulation was also compared to that without considering the density effect. Comparisons demonstrate that: (a) accordingly, the density effect for creep influences significantly the long-time settlement; (b) for horizontal displacement, the influence of the density effect consideration is less significant than that for the settlement; and (c) the density effect on the dissipation of excess pore pressure can be neglected.
[1] Augustesen, A., Liingaard, M., Lade, P.V., 2004. Evaluation of time-dependent behavior of soils. International Journal of Geomechanics, 4(3):137-156.
[2] Bjerrum, L., 1967. Engineering geology of Norwegian normally-consolidated marine clays as related to settlements of building. Gotechnique, 17(2):81-118.
[3] Hinchberger, S.D., Rowe, R., 1998. Modelling the rate-sensitive characteristics of the Gloucester foundation soil. Canadian Geotechnical Journal, 35(5):769-789.
[5] Hong, Z.X., Onitsuka, K., 1998. A method of correcting yield stress and compression index of Ariake clays for sample disturbance. Soils and Foundations, 38(2):211-222.
[6] Karim, M.R., Gnanendran, C.T., Lo, S.C.R., 2010. Predicting the long-term performance of a wide embankment on soft soil using an elastic-viscoplastic model. Canadian Geotechnical Journal, 47(2):244-257.
[7] Karstunen, M., Yin, Z.Y., 2010. Modelling time-dependent behaviour of Murro test embankment. Gotechnique, 60(10):735-749.
[8] Karstunen, M., Krenn, H., Wheeler, S.J., 2005. Effect of anisotropy and destructuration on the behavior of Murro test embankment. International Journal of Geomechanics, 5(2):87-97.
[9] Katona, M., 1984. Evaluation of a viscoplastic cap model. Journal of Geotechnical Engineering, 110(8):1106-1125.
[10] Kutter, B.L., Sathialingam, N., 1992. Elastic-viscoplastic modelling of the rate-dependent behaviour of clays. Gotechnique, 42(3):427-441.
[11] Leoni, M., Karstunen, M., Vermeer, P.A., 2008. Anisotropic creep model for soft soils. Gotechnique, 58(3):215-226.
[12] Leroueil, S., Kabbaj, M., Tavenas, F., 1985. Stress-strain-strain rate relation for the compressibility of sensitive natural clays. Gotechnique, 35(2):159-180.
[13] Li, Q., Ng, C.W.W., Liu, G., 2012. Low secondary compressibility and shear strength of Shanghai Clay. Journal of Central South University, 19(8):2323-2332.
[14] Mesri, G., Godlewski, P., 1977. Time and stress compressibility interrelationship. Journal of the Geotechnical Engineering Division, 103(5):417-430.
[15] Oka, F., Adachi, T., Okano, Y., 1986. Two-dimensional consolidation analysis using an elasto-viscoplastic constitutive equation. International Journal for Numerical and Analytical Methods in Geomechanics, 10(1):1-16.
[16] Stapelfeldt, T., Lojander, M., Vepslinen, P., 2007. Determination of horizontal permeability of soft clay. Proceedings of 17th International Conference on Soil Mechanics and Foundation Engineering, Madrid, 3:1385-1389.
[17] Yin, J.H., Zhu, J.G., Graham, J., 2002. A new elastic viscoplastic model for time-dependent behaviour of normally and overconsolidated clays: theory and verification. Canadian Geotechnical Journal, 39(1):157-173.
[18] Yin, Z.Y., Hicher, P.Y., 2008. Identifying parameters controlling soil delayed behaviour from laboratory and in situ pressuremeter testing. International Journal for Numerical and Analytical Methods in Geomechanics, 32(12):1515-1535.
[19] Yin, Z.Y., Wang, J.H., 2012. A one-dimensional strain-rate based model for soft structured clays. Science in China Series E, 55(1):90-100.
[20] Yin, Z.Y., Chang, C.S., Karstunen, M., 2010. An anisotropic elastic viscoplastic model for soft soils. International Journal of Solids and Structures, 47(5):665-677.
[21] Yin, Z.Y., Karstunen, M., Chang, C.S., 2011. Modeling time-dependent behavior of soft sensitive clay. Journal of Geotechnical and Geoenvironmental Engineering, 137(11):1103-1113.
[22] Yin, Z.Y., Karstunen, M., Wang, J.H., 2011. Influence of features of natural soft clay on the behavior of embankment. Journal of Central South University of Technology, 18(5):1667-1676.
[23] Zeng, L.L., Hong, Z.S., Liu, S.Y., 2012. Variation law and quantitative evaluation of secondary consolidation behavior for remolded clays. Chinese Journal of Geotechnical Engineering, (in Chinese),34(8):1496-1500.
[24] Zhu, Q.Y., Jin, Y.F., Yin, Z.Y., Hicher, P.Y., 2013. Influence of natural deposition plane orientation on oedometric consolidation behavior of three typical clays from southeast coast of China. Journal of Zhejiang University-SCIENCE A (Applied Physics & Engineering), 14(11):767-777.
Open peer comments: Debate/Discuss/Question/Opinion


Open peer comments: Debate/Discuss/Question/Opinion
<1>