1. Introduction
Lactobacillus delbrueckii subsp.
bulgaricus is an important lactobacillus commonly used for fermented milk products (Garbayo et al.,
2004; Schiraldi et al.,
2006; Li et al.,
2009). The metabolic capacities of
L. bulgaricus were responsible for the development of milk acidification and formations of texture and aroma (Russell and Diez-Gonzalez,
1998; Siegumfeldt et al.,
2000). However, a traditional biochemistry method was difficult to effectively identify and quantify the intracellular metabolites of the bacteria (Nielsen,
1997; Schaefer et al.,
1999; Lange et al.,
2001). Recently, rapidly growing reports demonstrated that microbial metabolomics could provide more data and describe higher complex metabolite profiles (Oldiges et al.,
2007; Wu et al.,
2008; Tang et al.,
2009). Typical detection methods in metabolome analysis include gas chromatography-mass spectrometry (GC-MS), liquid chromatography (LC)-MS, and nuclear magnetic resonance spectroscopy (NMR), which offer higher sensitivity and the ability to detect a larger number of low-molecular weight metabolites (van Dam et al.,
2002; Coulier et al.,
2006; Koek et al.,
2006). Accordingly, further studies on metabolomics could contribute to a better understanding on the necessary role of
L. bulgaricus in fermentation.
L. bulgaricus metabolomics requires efficient and reliable quenching and extracting methods. Cold methanol-water quenching was considered as a general procedure to rapidly inactivate bacteria metabolism, which has been widely applied to
Escherichia coli,
Staphylococcus aureus, and yeast (Castrillo et al.,
2003; Jana et al.,
2009; Meyer et al.,
2010). The effect of methanol quenching on the leakage of intracellular metabolites has been widely studied. Wittmann et al. (
2004) showed that a lower concentration of methanol quenching significantly reduced the leakage of metabolites in
Corynebacterium glutamicum. However, Canelas et al. (
2008) proposed that the intracellular components of
Saccharomyces cerevisiae could be effectively protected by quenching in 80% methanol. Link et al. (
2008) observed that methanol-glycerol quenching fluid showed lower leakage compared to methanol-water quenching fluid. In addition, many studies focused on the effect of quenching on the cell membrane integrity. Schädel et al. (
2011) used an optical density (OD)-based method and flow cytometry to investigate the cell damage in
E. coli during quenching. However, few studies reported on the quenching method for lactobacillus metabolomics analysis.
This study aimed to examine different quenching solutions for the investigation of the
L. bulgaricus metabolomics. The optimized quenching processing for
L. bulgaricus would be applicable for other lactobacillus.
2. Materials and methods
2.1. Bacterial strain and growth conditions
L. bulgaricus ATCC 11842 was obtained from the American Type Culture Collection. The bacteria were cultivated in a 3.7-L laboratory fermenter (Bio-Rad, Switzerland) at 37 °C, 200 r/min, and pH 6.2±0.2 until the cells reached the stationary phase. The chemically defined medium was prepared in accordance with Otto et al. (
1983).
2.2. Quenching process
Three quenching fluids were prepared: 60% methanol/water (Meth), 80% methanol/glycerol (Meth/gly), and 80% Meth.
The bacteria cells of
L. bulgaricus were collected by centrifugation at 7000
g for 5 min at 4 °C. Subsequently, re-suspended cells were washed twice with 0.9% saline solution at 4 °C. The samples were then quenched with 5 ml of three different methanol liquids respectively, followed by being vortex-mixed and centrifuged at 10 000
g for 5 min at −20 °C.
The supernatants were removed quickly and used as extracellular samples for analyzing the leakage of intracellular metabolites. Simultaneously, the quenched bacteria cells were extracted by 2 ml boiling ethanol/water (3:1, v/v) solution (95 °C) according to Faijes et al. (
2007). After that, the preparations were centrifugated (10 000
g, 5 min, −20 °C), and the supernatant was frozen at −80 °C and used as an intracellular sample for analyzing the metabolite levels in
L. bulgaricus.
2.3. Cell leakage test
OD recovery ratio was used to quantify the whole cell damage (Schädel et al.,
2011), which was calculated as the OD value at 660 nm (OD
660) of untreated sample/OD
660 of treated sample). Briefly, the OD
660 values of untreated samples were first monitored using a spectrophotometer (Beckman Coulter, Germany). Subsequently, the quenched cell pellets were re-suspended in 4 ml phosphate buffered saline (PBS), which allowed for detecting the decrease of OD
660 of the cell suspensions.
Flow cytometry was used for quantitative analysis of single cell damage (Schädel et al.,
2011). The quenched cell suspensions, added with 10 μl/ml prodium iodide (PI) staining solution, were mixed gently and incubated for 4 min in the dark. The PI fluorescence was detected (using the FL-2 or FL-3 channel) by a flow cytometer (BD Bioscience, USA). The data of unstained cells (intact cell membrane) and single-color positive cells (damaged cell membrane) were obtained for quantifying the undamaged and damaged cells.
2.4. Evaluation of quenching protocols by gas chromatography-mass spectrometry (GC-MS)
Metabolites extracted from the
L. bulgaricus were tested by GC-MS analysis. Firstly, 10 μl of
13C
6-leucine (20 μg/ml) was added into each of the 200 μl re-dissolved samples. Then, the solution was mixed for 5 s and dried under nitrogen gas at 50 °C for 30 min. Subsequently, the sample was transferred to a GC vial and 30 μl of 20 mg/ml methoxy amine pyridine hydrochloride was added, mixed for 30 s and oxidated at 37 °C for 90 min.
N,
O-bis(trimethylsily) trifluoractamide (BSTFA) of a volume of 30 μl containing 1% (v/v) trimethylchlorosilane (TMCS) was added to each vial and the mixture was incubated for 30 min at 70 °C. Ultimately, a devitalized sample was kept at room temperature for 30 min.
Agilent 7890A/5975C GC/MS, including an HP-5MS fused silica capillary column (30 m×0.25 mm×0.25 μm) was used for metabolite analysis. The injector temperature was set at 280 °C. The electronic ignition (EI) ion source temperature was set at 230 °C. Helium (99.999%) was used as a carrier gas at a flow rate of 1.0 ml/min, and 1-μl sample was injected in a spoutless mode. The column temperature was first kept at 80 °C for 2 min, increased to 320 °C at a rate of 10 °C/min and maintained for 6 min. The mass spectrometer was operated in the scan mode at the mass range of 50–550
m/
z.
2.5. Statistical analysis
After GC-MS analysis, statistical preprocessing was performed using XCMS software (
https://xcmsonline.scripps.edu/?) under an
R platform and later edited in Microsoft Excel 2010. Impurity peaks produced from sample preparation and column bleeding were wiped out, and all results containing variables, peak-area, and observables are organized into a 2D matrix. The preprocessed GC-MS data were then imported into Simca-P software (Version 11.0) and principal component analysis (PCA) and orthogonal partial least squares-discriminant analysis (OPLS-DA) were executed. PCA was used to differentiate the samples. OPLS-DA analysis was used to filter the quadrature signal. The efficiencies of the models were determined by values of
R
2 and
Q
2. In addition, permutation tests were performed to test the validity of the OPLS-DA models. Statistical significance was evaluated using the
t-test and
P<0.1 was considered significant.
3. Results
3.1. Impact of quenching protocols on single cell damage
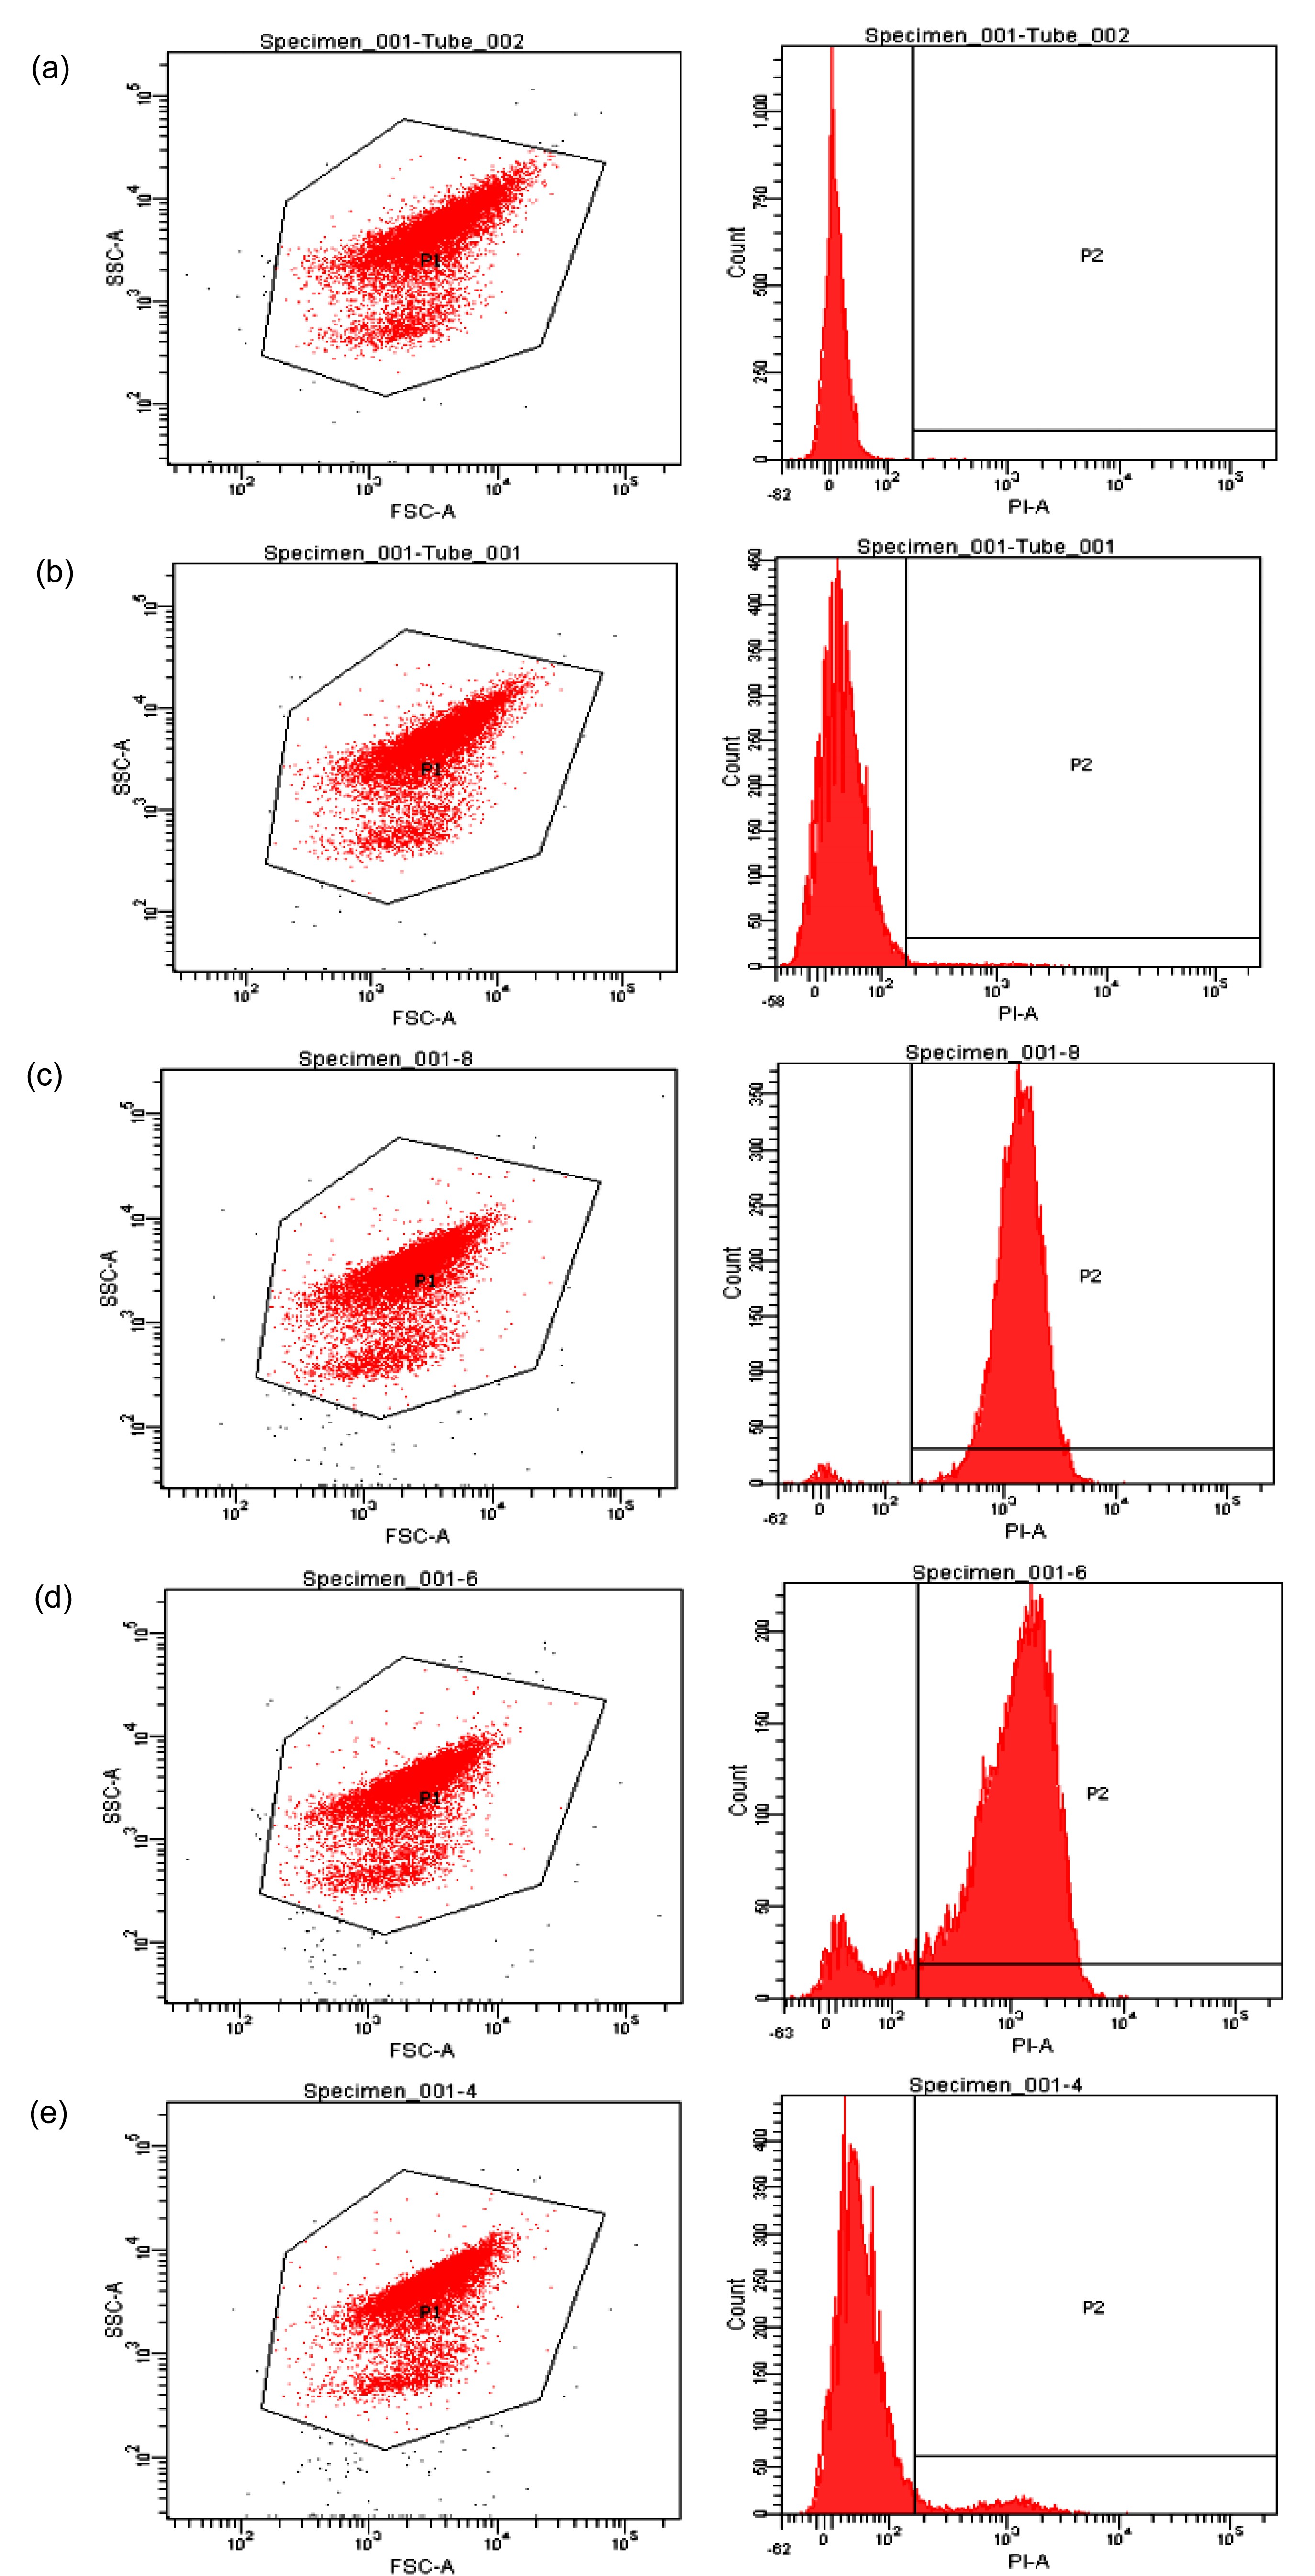
The PI dye can bind to nucleic acids inside the cells and then form a red fluorescent signal, which can be detected by flow cytometry (Díaz et al.,
2010). Thus, the PI-staining method was applied to examine the degree of damage to the cells after the aqueous methanol quenching.
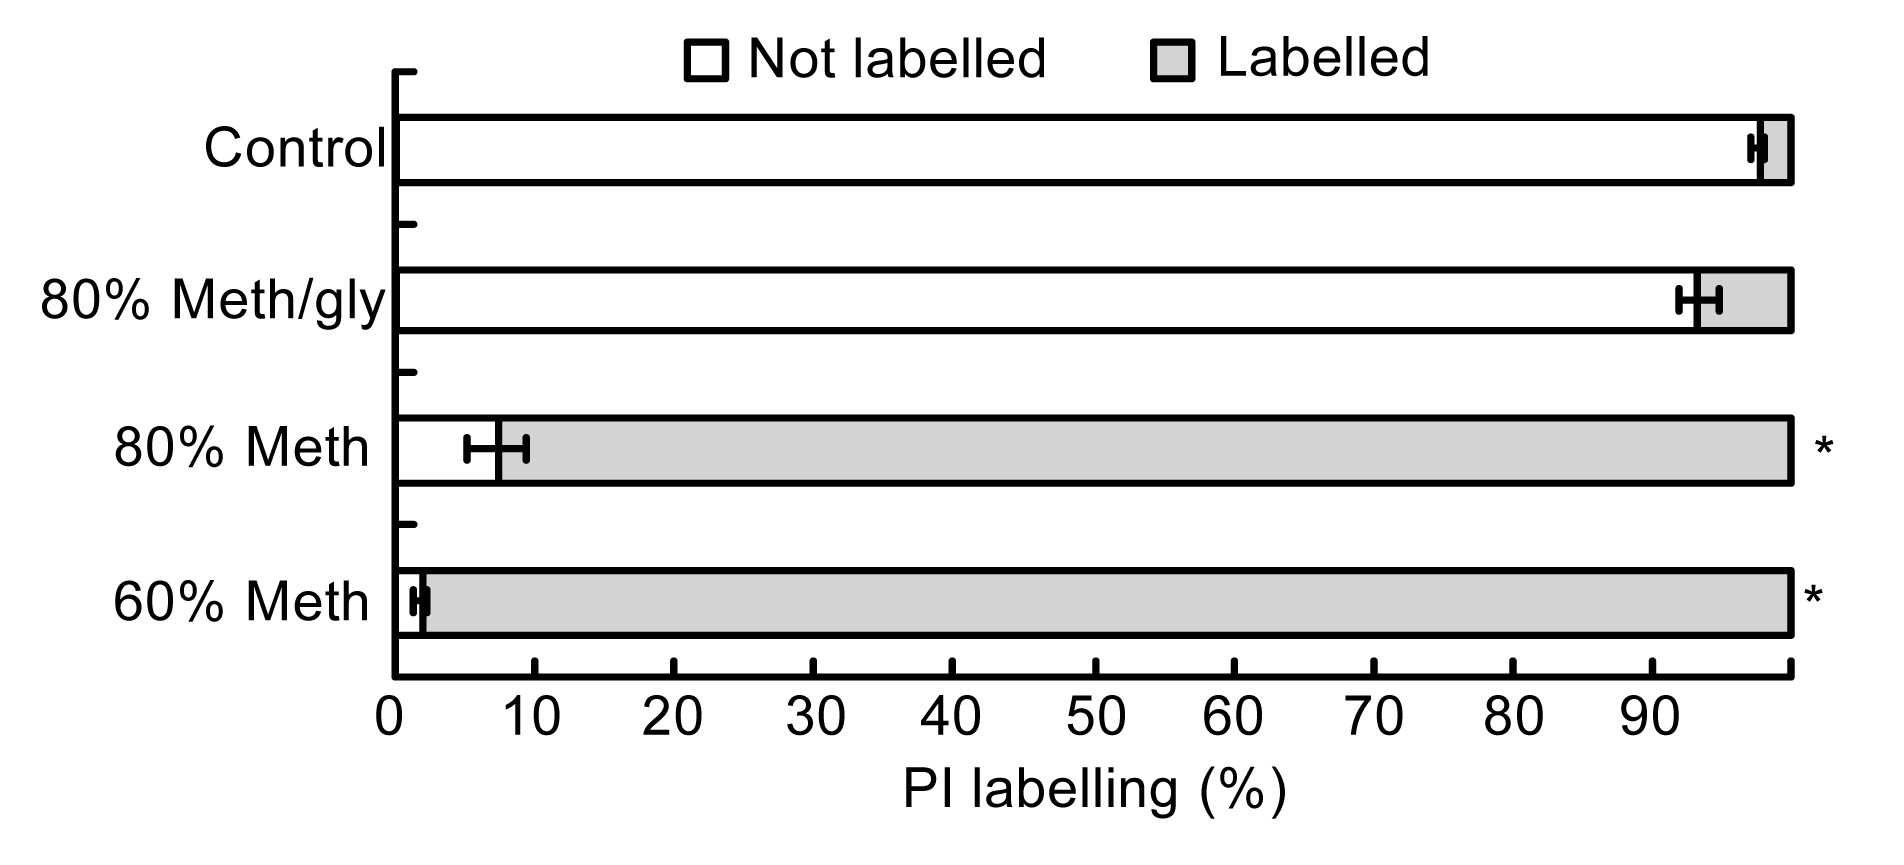
Because PI is a membrane impermeant dye, the cell without treating and quenching had relatively intact membranes and exhibited a 3% PI labeling (Figs.
1 and
2). The variation of the composition of methanol solutions changed the ratio of PI-labeled cells. Compared with the 60% Meth quenching, the 80% Meth quenching caused less damage to the
L. bulgaricus cells. In addition, the 80% Meth/gly effectively protected the cell membranes and reduced the ratio of PI labeling to 6.6%, which was significantly less than that in the Meth quenching (
P<0.05).
Fig.1
Flow cytometry diagrams for evaluation of the cell membrane integrity
Unquenched samples without (a) and with (b) PI staining. Quenched samples by 60% Meth (c), 80% Meth (d), and 80% Meth/gly (e)
Fig.2
Percentages of PI labelling of different quenching treatments
Data are expressed as mean±SD (n=5). *
P<0.05 vs. control cells
3.2. Impact of quenching protocols on whole cell damage
We further analyzed the total cell rupture by monitoring the reduction of OD
660 in the quenching samples (Fig.
3). It was found that the OD
660 recovery ratio of the cold 80% Meth/gly was higher than those of other quenching methods, which indicated that Meth/gly had a positive effect on preventing the
L. bulgaricus cell lyses.
Fig.3
OD recovery ratios of different quenching treatments
Data are expressed as mean±SD (n=5)
The OD
660 recovery ratio of 80% Meth quenching was higher than that of 60% Meth quenching (
P>0.05). The result also indicated that adoption of 80% Meth as a quenching fluid could decrease the cell rupture.
3.3. Evaluation of intracellular metabolite profiles of L. bulgaricus
The results of GC-MS showed that there was a strong signal with good sensitivity and reproducibility in the GC-MS total ion chromatograms (TICs) of all samples. However, other peak areas of the 80% Meth/gly chromatogram were covered due to a saturated peak glycerol present at 8.55 min of retention time (Fig.
4b). It respectively found 807, 603, and 841 substances in the GC/MS TICs of 60% Meth, 80% Meth/gly, and 80% Meth samples, including ATP and its derivatives, amino acids, organic acids, sugars, and fatty acids (Fig.
4).
Fig.4
GC-MS total ion chromatograms (TICs) of intracellular metabolite profiles of L. bulgaricus from three methanol quenching groups: (a) 60% Meth; (b) 80% Meth/gly; (c) 80% Meth
The PCA score plot showed that the samples prepared by different methanols were clearly separated, although 80% Meth/gly and 80% Meth were grouped closely (Fig.
5a). Detailed insight into the differences can be identified by examining the PCA loading plot (Fig.
5b). The major compounds that contributed to the discrimination of 60% Meth samples were palmitic acid and stearic acid. Moreover, focal glutamic acid, aspartic acid, alanine, and AMP were the metabolites which contributed to the separation of the 80% Meth samples from others. It is suggested that the 80% Meth quenching method was superior to quenching with 60% Meth and 80% Meth/gly, because larger amounts of metabolites were detected.
Fig.5
Comparison of three quenching methods by multivariate statistical analysis
PCA score plot (a) and loading plot (b) from the GC-MS spectra originated from intracellular metabolite profiles of L. bulgaricus quenched by different methanol fluids. PCA score plot (c) and loading plot (d) from the GC-MS spectra originated from extracellular metabolite profiles of L. bulgaricus quenched by different methanol fluids. In the score plot, t(1) and t(2) are the X scores for the two predictive components, and the loading plot shows the loadings for both X and Y in the form of p(1) and p(2)
3.4. Evaluation of extracellular metabolite profiles of L. bulgaricus
Since
L. bulgaricus cells were sensitive to methanol quenching procedures so as to lose their intracellular metabolites, the concentrations of extracellular (supernatant) metabolite were also measured by GC-MS.
The PCA score plot in Fig.
5c showed that the supernatant metabolites of 60% and 80% Meth groups were clearly separated, which was in accordance with the high
R
2
X value of 0.834 and
Q
2 value of 0.56. It indicated that the prediction performance of PCA models was good. A few kinds of metabolites in the two quenched supernatants were significantly different (Fig.
5d). Asparagine, serine, AMP, and phosphoenolpyruvate (PEP) were presented in the supernatant of the 60% Meth group. The metabolites in the supernatant of the 80% Meth group were mainly glutamic acid, valine, threonine, and aspartate.
3.5. Impact of quenching protocols on the metabolitic profiles
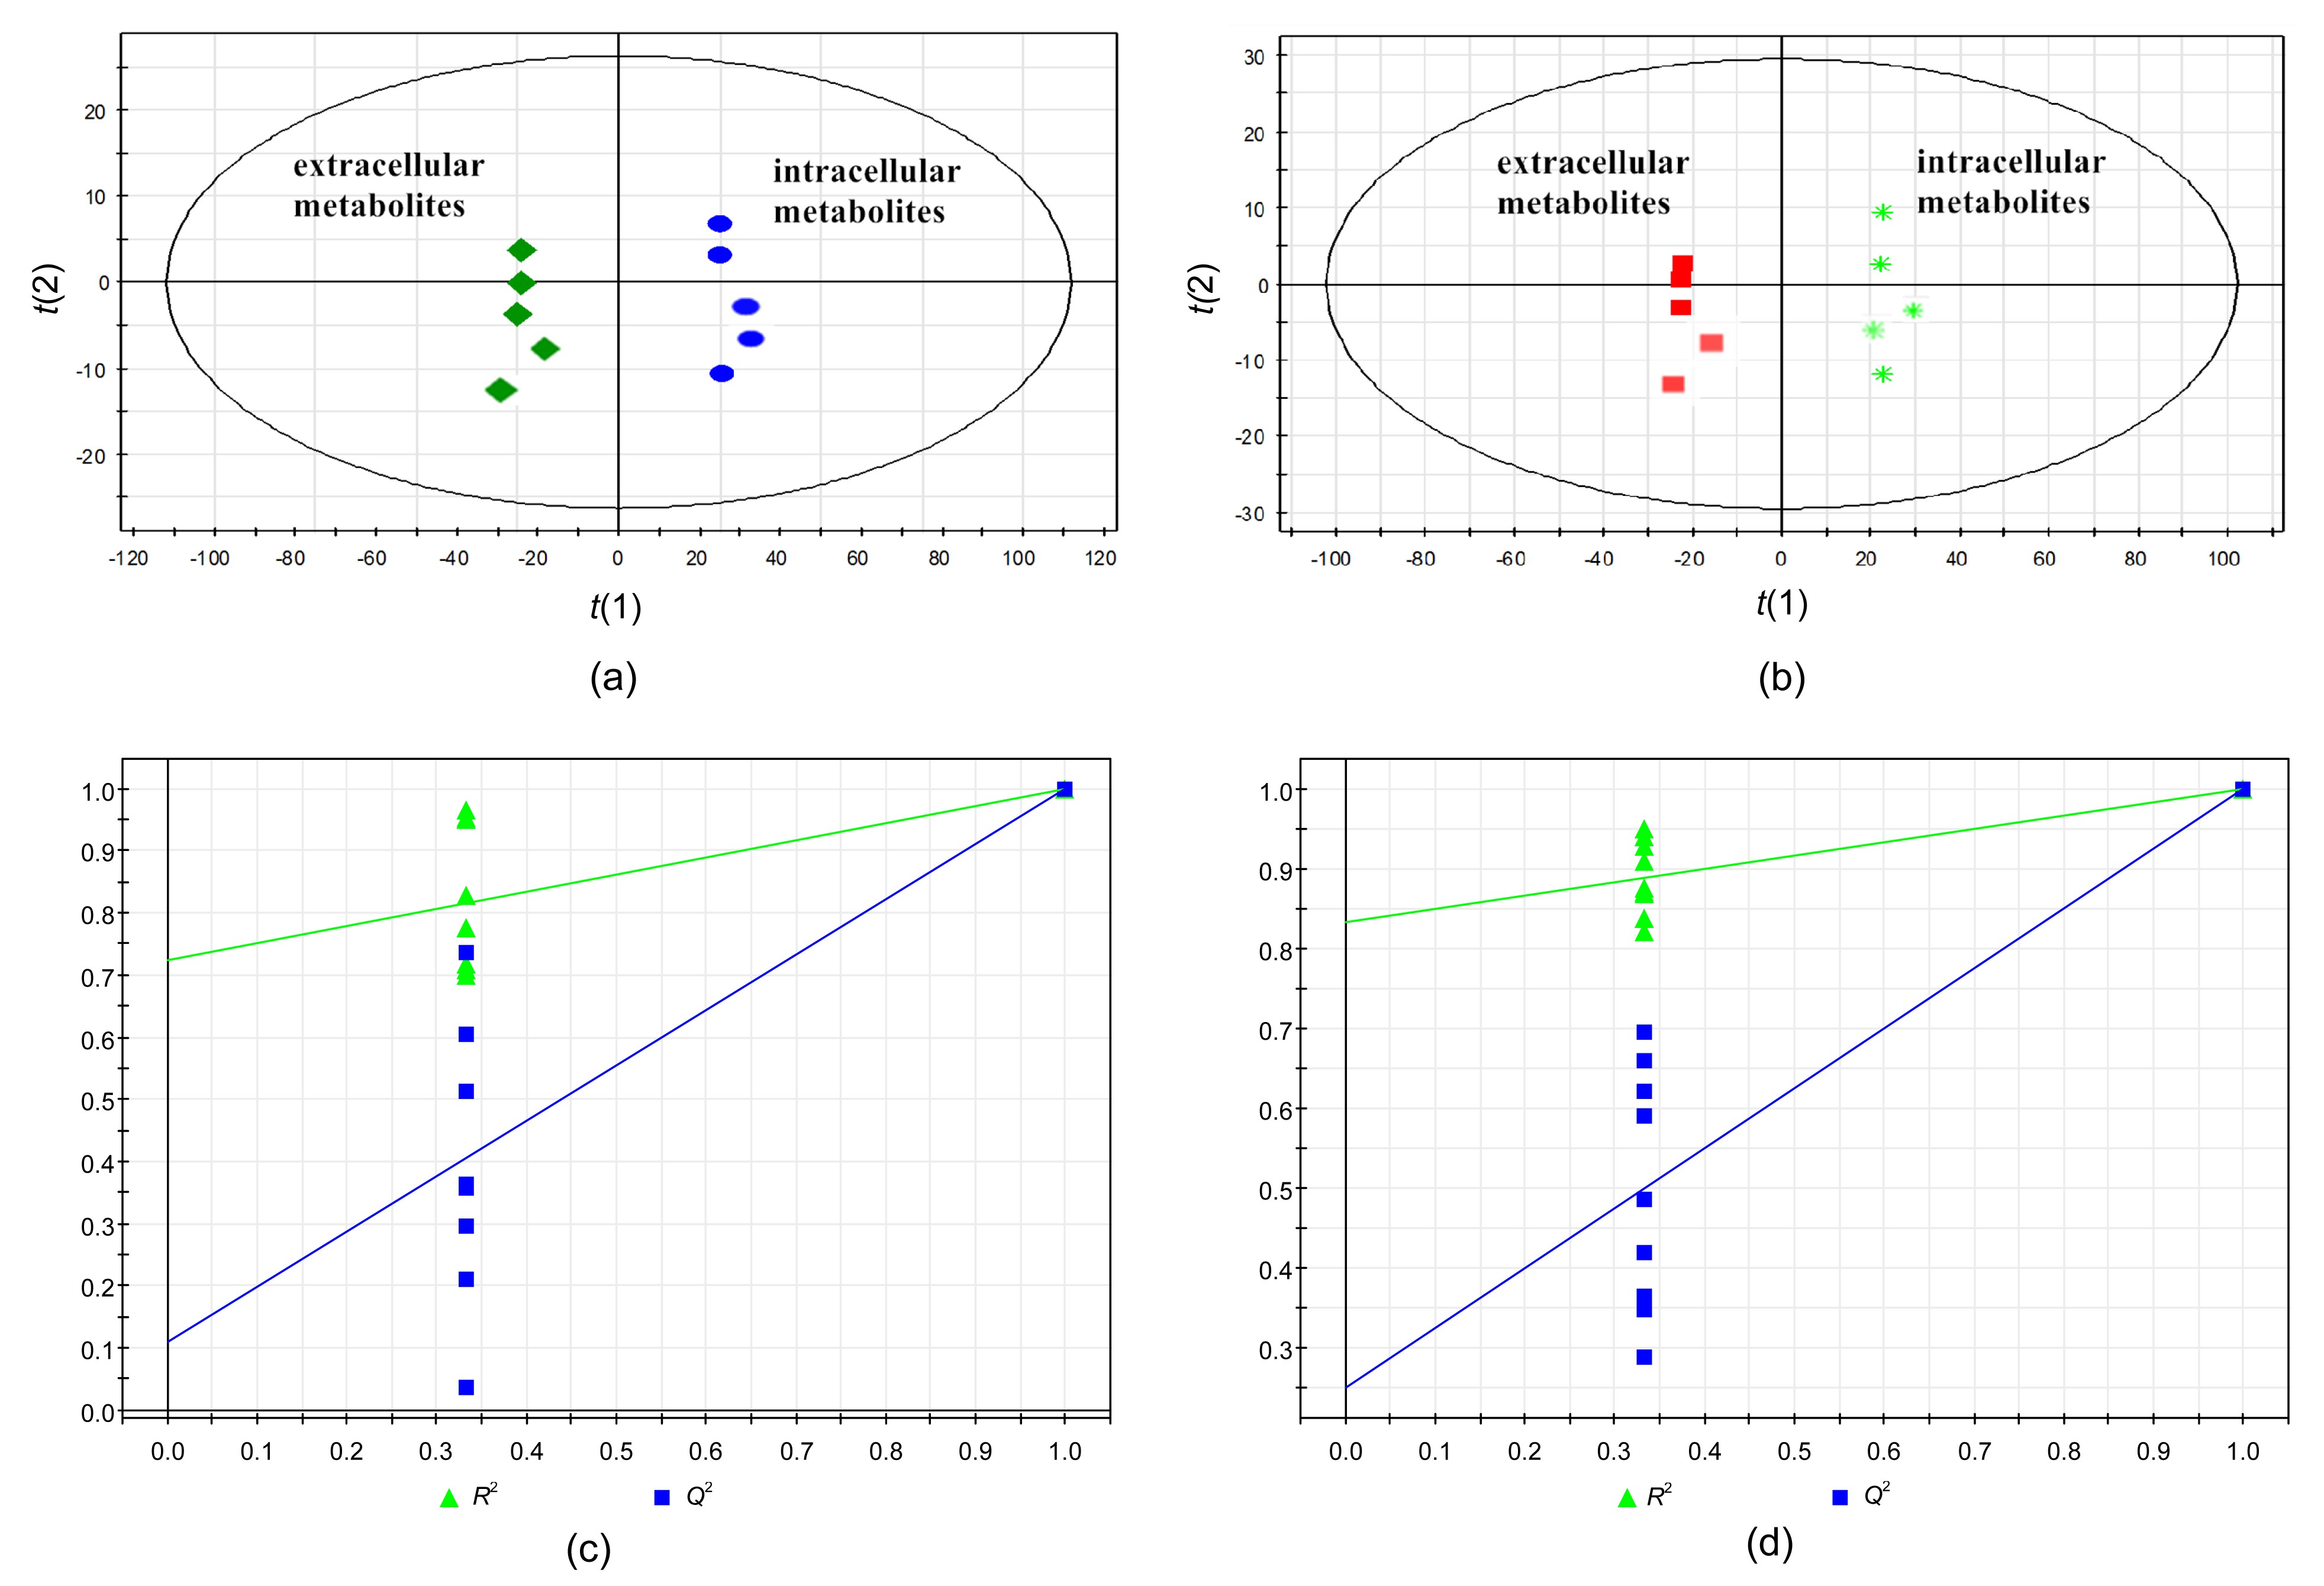
The differences between the extracellular and intracellular metabolite samples were examined by OPLS-DA. The OPLS-DA score plot for the extracellular and intracellular substances of the 60% Meth quenching group (one orthogonal and two predictive components,
R
2
X=0.941,
R
2
Y=1,
Q
2=0.999) and the extracellular and intracellular metabolites of the 80% Meth quenching group (
R
2
X=0.901,
R
2
Y=1,
Q
2=0.998) indicated that the two models were reliable and the metabolic samples had significant differences (Figs.
6a and 6b). Furthermore, the OPLS-DA models were validated with a permutation test (200 times). The results of the tests further verified the performance of the model showing that
Q
2 was relatively high than
R
2 (Figs.
6c and 6d).
Fig.6
OPLS-DA score plots demonstrating the differentiation in intracellular and extracellular metabolites samples
OPLS-DA score plots of 60% Meth (a) and 80% Meth (b) quenching groups. Permutation tests for OPLS models of the 60% Meth (c) and 80% Meth (d) quenching groups. t(1) and t(2) are the X scores for the two predictive components using supervision methods, and SIMCA-P displays the plot of the correlation coefficient between the original Y and the permuted Y versus the cumulative R
2 and Q
2, and draws the regression line, in which the intercept (R
2 and Q
2 when correlation coefficient is zero) is a measure of the overfit
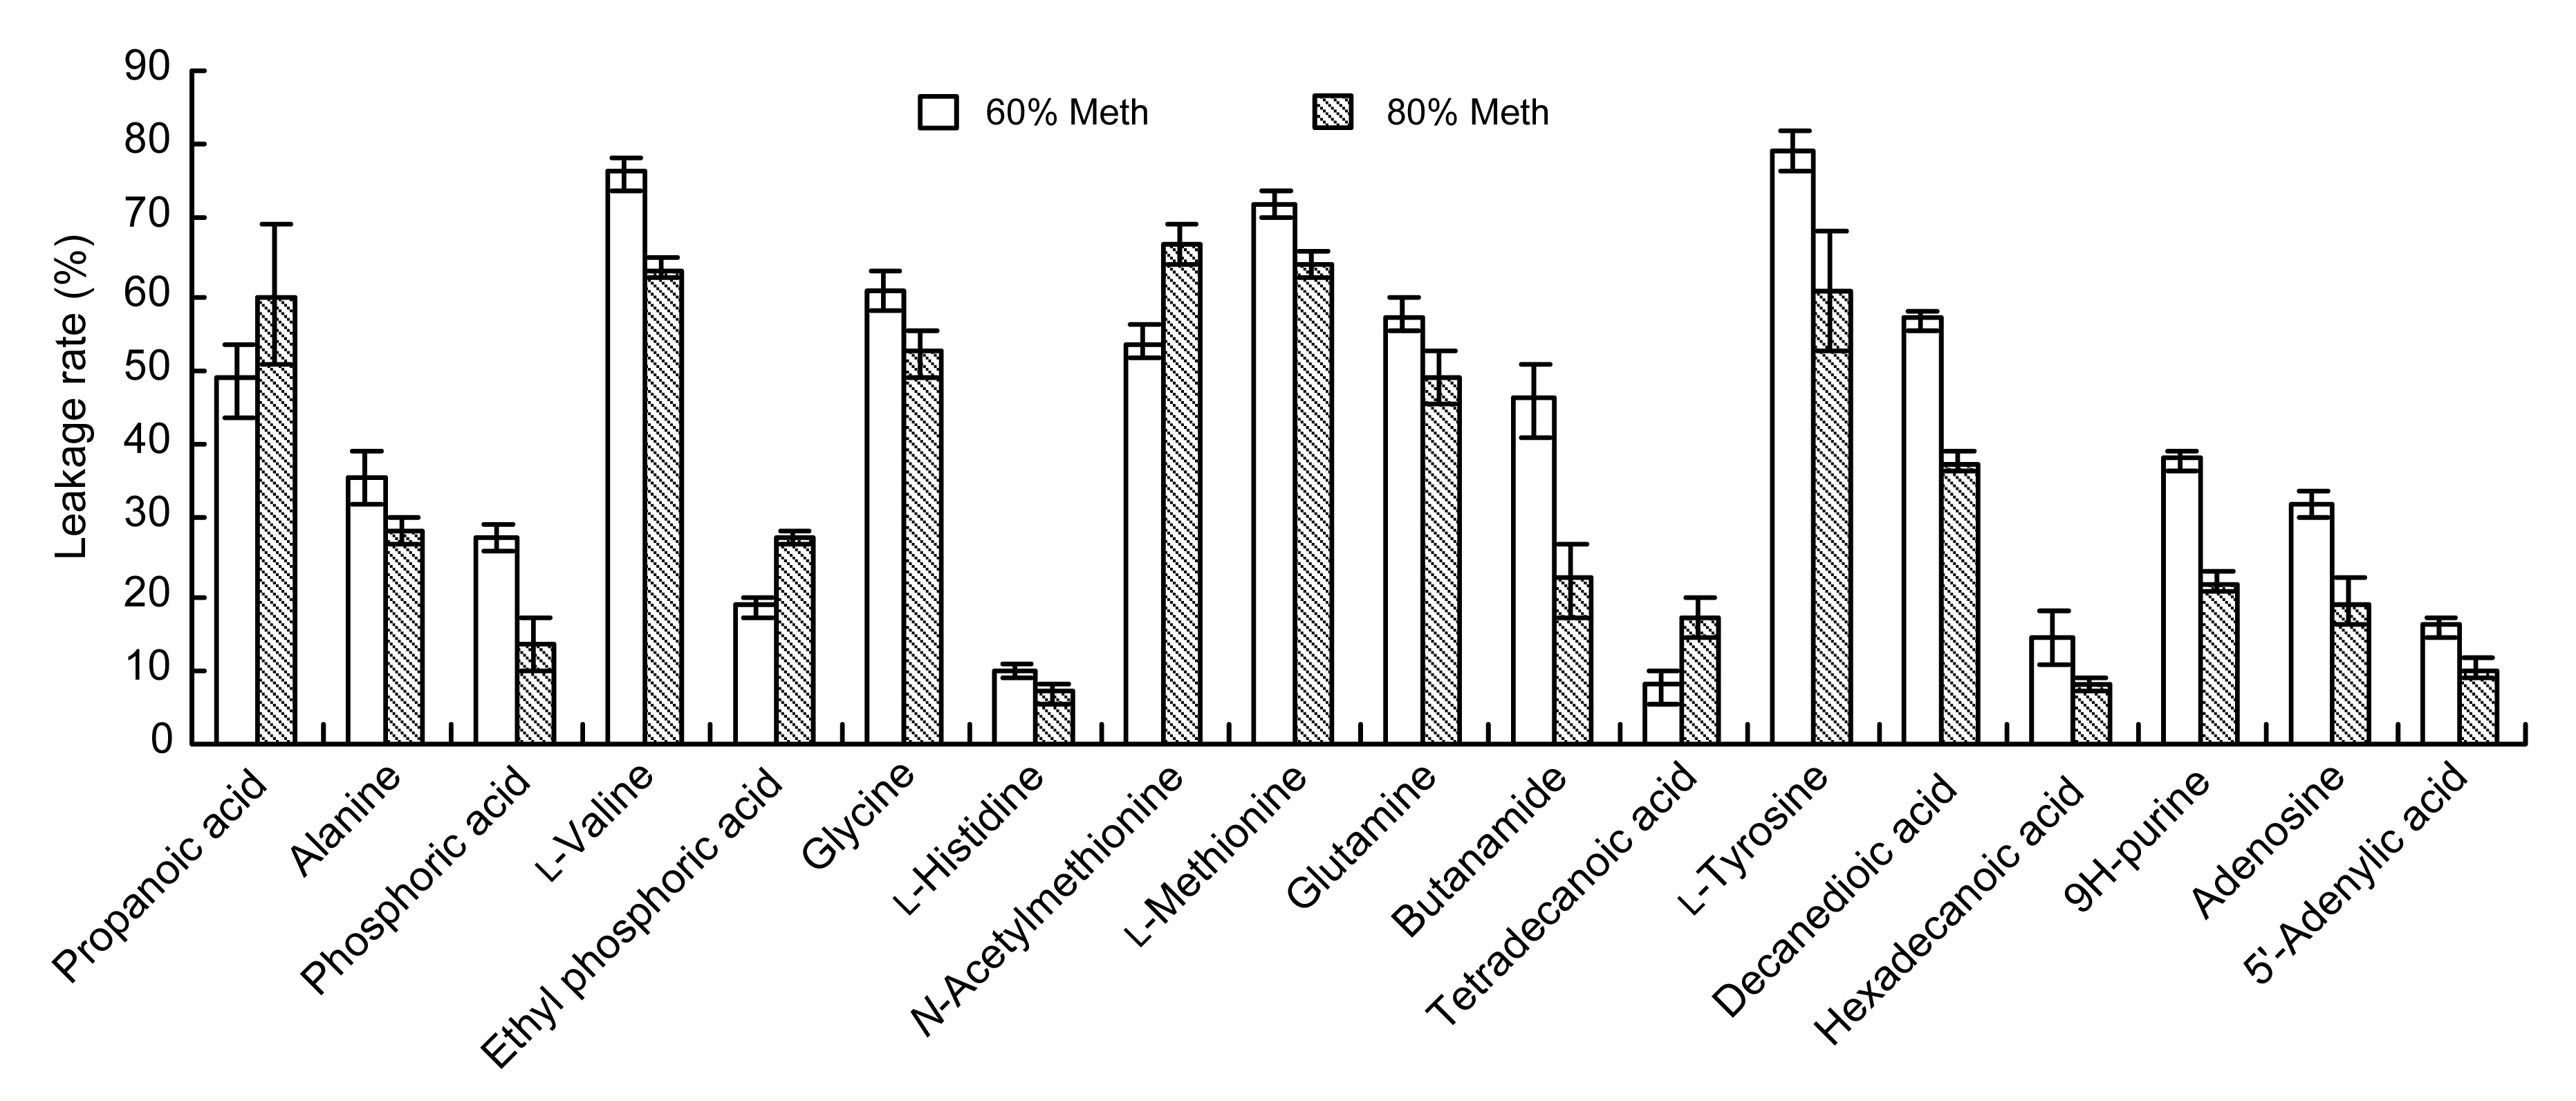
The experimental results showed that 45 kinds of metabolites had significant differences between supernatant and intracellular substances from the 60% and 80% Meth quenching groups. Among them, 18 kinds of different metabolites were identified. According to the relative content of these metabolites, we were able to calculate the effect of the 60% and 80% Meth quenching on the leakage rate of intracellular metabolites in
L. bulgaricus. As shown in Fig.
7, the leakage rates of cell metabolites affected by 80% Meth quenching were less than those affected by 60% Meth quenching. If 80% Meth was used for quenching, the leakage rates of the 14 kinds of metabolites were lower than those using the 60% Meth, such as alanine, glycine, and glutamine. However, the leakage rates of four kinds of metabolites, including propanoic acid, ethylphoric acid,
N-acetylmethionine, and tetradecanoic acid, by 80% Meth quenching were higher than those by the cold 60% Meth quenching.
Fig.7
Comparison of the leakage rates of metabolites caused by 60% and 80% cold methanol
Data are expressed as mean±SD (n=5)
4. Discussion
Bacterial cells are sensitive to quenching solutions, which results in damage to the cell wall and membrane and the loss of intracellular metabolites (Duetz and Witholt,
2004; Kumar et al.,
2004). Therefore, this study focused on comparing different methanol solutions, including 60% Meth, 80% Meth/gly, and 80% Meth, for proposing an appropriate quenching protocol for
L. bulgaricus.
Firstly, we evaluated the effects of quenching protocols on the membrane integrity and cell lysis by flow cytometry using PI dye and OD recovery ratio. It was found that increasing the methanol concentration or using the glycerol as a buffer was very effective for reducing cell membrane damage. Previous studies confirmed that both methanol and glycerol were effective cryoprotectants for
L. bulgaricus and had the ability to enhance the cell viability against freezing damage (Carvalho et al.,
2004; Fonseca et al.,
2006). Especially, glycerol as a permeable compound could protect freeze-dried lactic acid bacteria through inhibiting excess dehydration, reducing salt toxicity, and preventing ice crystals formation (Huang et al.,
2006). Recently, isosmotic glycerol solution was widely applied as a quenching agent to maintain osmotic pressure for bacterial cells (Villas-Bôas and Bruheim,
2007). This work found that 80% Meth/gly quenching could reduce the cell damage to
L. bulgaricus. Hence, it is suggested that
L. bulgaricus cells quenched in the presence of glycerol could effectively protect the stability of cell membrane.
Subsequently, the extracellular and intracellular metabolite profiles of
L. bulgaricus affected by different quenching fluids were assessed based on GC-MS and PCA analytical methods. On the one hand, we found that it was difficult to remove the glycerol from the supernatant of quenched samples, which severely affected the results of the GC-MS analysis. Therefore, the data for the extracellular metabolite samples of 80% Meth/gly quenching were discarded. On the other hand, the GC-MS analysis of intracellular metabolite profiles revealed that 600–800 metabolite compounds were detected, in which 196 kinds of compounds were identified and 113 kinds of metabolites were represented. The effect of the methanol concentration on the levels of metabolite extracts was further evaluated. In accordance with the findings of Canelas et al. (
2008), we showed consistently higher concentrations of intracellular metabolites from the samples treated with 80% Meth compared with 60% Meth. These results suggest that the 80% Meth, acting as a protective agent, could prevent the losses of metabolites from the cells.
Further, OPLS-DA was employed to investigate the differences between extracellular and intracellular metabolite profiles derived from different quenching methods. The reliabilities of the OPLS-DA models had been validated by permutation tests. The OPLS-DA score plots showed a trend toward differentiating between supernatant and intracellular samples quenched with 60% or 80% Meth. In accordance with the previous studies, cold methanol quenching led to some metabolite losses from bacterial cells (Bolten et al.,
2007; Spura et al.,
2009). In our study, the supernatant sample of 80% Meth treatment contained lower concentrations of metabolites compared with the remaining intracellular concentrations. Furthermore, the leakage rate of the sample prepared using 80% Meth was lower than that of the 60% Meth group, suggesting that the 80% Meth quenching method is a preferable method for the analysis of the intracellular metabolites from
L. bulgaricus.
5. Conclusions
In summary, quenching is a critical step in the evaluation of
L. bulgaricus metabolomics. Compared to the general quenching in 60% cold methanol fluid, it is proposed that a 80% cold methanol or 80% cold methanol/glycerol solution was better for reducing the extent of leakage and examining higher concentrations of intracellular metabolites. The application of an optimized quenching process would contribute to identifying the specific biomarkers and also help to analyze the metabolic characteristics of
L. bulgaricus.
* Project supported by the Open Research Fund for the MOE Key Laboratory of Dairy Science (No. 2012KLDSOF-07), the National Natural Science Foundation of China (No. 31000808), the Synergetic Innovation Center of Food Safety and Nutrition, and the Open Research Fund of Northeast Agricultural University, ChinaCompliance with ethics guidelines Ming-ming CHEN, Ai-li LI, Mao-cheng SUN, Zhen FENG, Xiang-chen MENG, and Ying WANG declare that they have no conflict of interest.References
[1] Bolten, C.J., Kiefer, P., Letisse, F., 2007. Sampling for metabolome analysis of microorganisms.
Anal Chem, 79(10):3843-3849.


[2] Canelas, A.B., Ras, C., ten Pierick, A., 2008. Leakage-free rapid quenching technique for yeast metabolomics.
Metabolomics, 4(3):226-239.
[3] Carvalho, A.S., Silva, J., Ho, P., 2004. Relevant factors for the preparation of freeze-dried lactic acid bacteria.
Int Dairy J, 14(10):835-847.
[4] Castrillo, J.I., Hayes, A., Mohmmed, S., 2003. An optimized protocol for metabolome analysis in yeast using direct infusion electrospray mass spectrometry.
Phytochemistry, 62(6):929-937.
[5] Coulier, L., Bas, R., Jespersen, S., 2006. Simultaneous quantitative analysis of metabolites using ion-pair liquid chromatography-electrospray ionization mass spectrometry.
Anal Biochem, 78(18):6573-6582.
[6] Daz, M., Herrero, M., Garca, L.A., 2010. Application of flow cytometry to industrial microbial bioprocesses.
Biochem Eng J, 48(3):385-407.
[7] Duetz, W.A., Witholt, B., 2004. Oxygen transfer by orbital shaking of square vessels and deep well microtiter plates of various dimensions.
Biochem Eng J, 17(3):181-185.
[8] Faijes, M., Mars, A.E., Smid, E.J., 2007. Comparison of quenching and extraction methodologies for metabolome analysis of
Lactobacillus plantarum
.
Microb Cell Fact, 6:27
[9] Fonseca, F., Marin, M., Morris, G.J., 2006. Stabilization of frozen
Lactobacillus delbrueckii subsp.
bulgaricus in glycerol suspensions: freezing kinetics and storage temperature effects.
Appl Environ Microbiol, 72(10):6474-6482.
[10] Garbayo, I., Vlchez, C., Vega, J.M., 2004. Influence of immobilization parameters on growth and lactic acid production by
Streptococcus thermophilus and
Lactobacillus bulgaricus co-immobilized in calcium alginate gel beads.
Biotechnol Lett, 26(23):1825-1827.
[11] Huang, L., Lu, Z., Yuan, Y., 2006. Optimization of a protective medium for enhancing the viability of freeze-dried
Lactobacillus delbrueckii subsp.
bulgaricus based on response surface methodology.
J Ind Microbiol Biotechnol, 33(1):55-61.
[12] Jana, S., Lorenz, C.R., Patricia, W., 2009. A method for enzyme quenching in microbial metabolome analysis successfully applied to Gram-positive and Gram-negative bacteria and yeast.
Anal Biochem, 394(2):192-201.
[13] Koek, M.M., Muilwijk, B., van der Werf, M.J., 2006. Microbial metabolomics with gas chromatography/mass spectrometry.
Anal Chem, 78(4):1272-1281.
[14] Kumar, S., Wittmann, C., Heinzle, E., 2004. Minibioreactors.
Biotechnol Lett, 26(1):1-10.
[15] Lange, H.C., Eman, M., van Zuijlen, G., 2001. Improved rapid sampling for
in vivo kinetics of intracellular metabolites in
Saccharomyces cerevisiae
.
Biotechnol Bioeng, 75(4):406-415.
[16] Li, C., Zhao, J.L., Wang, Y.T., 2009. Synthesis of cyclopropane fatty acid and its effect on freeze-drying survival of
Lactobacillus bulgaricus L2 at different growth conditions.
World J Microbiol Biotechnol, 25(9):1659-1665.
[17] Link, H., Anselment, B., Weuster-Botz, D., 2008. Leakage of adenylates during cold methanol/glycerol quenching of
Escherichia coli
.
Metabolomics, 4(3):240-247.
[18] Meyer, H., Liebeke, M., Lalk, M., 2010. A protocol for the investigation of the intracellular
Staphylococcus aureus metabolome.
Anal Biochem, 401(2):250-259.
[19] Nielsen, J., 1997. Metabolic control analysis of biochemical pathways based on a thermokinetic description of reaction rates.
Biochem J, 321:133-138.
[20] Oldiges, M., Ltz, S., Pflug, S., 2007. Metabolomics: current state and evolving methodologies and tools.
Appl Microbiol Biotechnol, 76(3):495-511.
[21] Otto, R., Brink, B., Veldkamp, H., 1983. The relation between growth rate and electrochemical proton gradient of
Streptococcus cremoris
.
FEMS Microbiol Lett, 16(1):69-74.
[22] Russell, J.B., Diez-Gonzalez, F., 1998. The effects of fermentation acids on bacterial growth.
Adv Microb Physiol, 39:205-234.
[23] Schdel, F., David, F., Franco-Lara, E., 2011. Evaluation of cell damage caused by cold sampling and quenching for metabolome analysis.
Appl Microbiol Biotechnol, 92(6):1261-1274.
[24] Schaefer, U., Boos, W., Takors, R., 1999. Automated sampling device for monitoring intracellular metabolites dynamics.
Anal Biochem, 270(1):88-96.
[25] Schiraldi, C., Valli, C., Molinaro, A., 2006. Exopolysaccharides production in
Lactobacillus bulgaricus and
Lactobacillus casei exploiting microfiltration.
J Ind Microbiol Biotechnol, 33(5):384-390.
[26] Siegumfeldt, H., Rechinger, K.B., Jakobsen, M., 2000. Dynamic changes of intracellular pH in individual lactic acid bacteria cells in response to a rapid drop in extracellular pH.
Appl Environ Microbiol, 66(6):2330-2335.
[27] Spura, J., Reimer, L.C., Wieloch, P., 2009. A method for enzyme quenching in microbial metabolome analysis successfully applied to Gram-positive and Gram-negative bacteria and yeast.
Anal Biochem, 394(2):192-201.
[28] Tang, Y.J., Martin, H.G., Myers, S., 2009. Advances in analysis of microbial metabolic fluxes via
13C isotopic labeling.
Mass Spectrom Rev, 28(2):362-375.
[29] van Dam, J.C., Eman, M.R., Frank, J., 2002. Analysis of glycolytic intermediates in
Saccharomyces cerevisiae using anion exchange chromatography and electrospray ionisation with tandem mass spectrometric detection.
Anal Chim Acta, 460(2):209-218.
[30] Villas-Bôas, S.G., Bruheim, P., 2007. Cold glycerol-saline: the promising quenching solution for accurate intracellular metabolite analysis of microbial cells.
Anal Biochem, 370(1):87-97.
[31] Wittmann, C., Krmer, J.O., Kiefer, P., 2004. Impact of the cold shock phenomenon on quantification of intracellular metabolites in bacteria.
Anal Biochem, 327(1):135-139.
[32] Wu, H., Southam, A.D., Hines, A., 2008. High-throughput tissue extraction protocol for NMR- and MS-based metabolomics.
Anal Biochem, 372(2):204-212.


Open peer comments: Debate/Discuss/Question/Opinion
<1>