Jin-seong Lim, Tae-soo Kim, Seung-hun Kim. Ultimate strength of single shear bolted connections with cold-formed ferritic stainless steel[J]. Journal of Zhejiang University Science A, 2013, 14(2): 120-136.
@article{title="Ultimate strength of single shear bolted connections with cold-formed ferritic stainless steel", author="Jin-seong Lim, Tae-soo Kim, Seung-hun Kim", journal="Journal of Zhejiang University Science A", volume="14", number="2", pages="120-136", year="2013", publisher="Zhejiang University Press & Springer", doi="10.1631/jzus.A1100316" }
%0 Journal Article %T Ultimate strength of single shear bolted connections with cold-formed ferritic stainless steel %A Jin-seong Lim %A Tae-soo Kim %A Seung-hun Kim %J Journal of Zhejiang University SCIENCE A %V 14 %N 2 %P 120-136 %@ 1673-565X %D 2013 %I Zhejiang University Press & Springer %DOI 10.1631/jzus.A1100316
TY - JOUR T1 - Ultimate strength of single shear bolted connections with cold-formed ferritic stainless steel A1 - Jin-seong Lim A1 - Tae-soo Kim A1 - Seung-hun Kim J0 - Journal of Zhejiang University Science A VL - 14 IS - 2 SP - 120 EP - 136 %@ 1673-565X Y1 - 2013 PB - Zhejiang University Press & Springer ER - DOI - 10.1631/jzus.A1100316
Abstract: This paper is focused on the structural behavior of the single shear bolted connections with thin-walled ferritic stainless steel. The purpose of this study is to investigate the ultimate behaviors, such as ultimate strength and fracture mode of the single shear bolted connections of thin-walled ferritic stainless steel (low cost steel) rather than austenitic stainless steel (high cost steel). bolt arrangement and end distance parallel to the direction of applied load are considered as main variables of the test specimens for bolted connections. Specimens have a constant dimension of edge distance perpendicular to the loading direction, bolt diameter, pitch, and gauge. A monotonic tensile test for specimens has been carried out and some bolted connections with long end distance showed curling (out of plane deformation) occurrence which led to strength reduction. The ultimate behaviors such as fracture mode, ultimate strength are compared with those predicted by current design codes. Further, conditions of curling occurrence and the strength reduction due to curling are investigated and modified strength equations are suggested considering the curling effect.
Darkslateblue:Affiliate; Royal Blue:Author; Turquoise:Article
Article Content
1. Introduction
Due to the significant material properties and exterior appearance, such as superior corrosion resistance, long-term durability, and aesthetic appeal, the usage of cold-formed stainless steel as structural members of buildings has been increasing. Research for utilizing stainless steel as structural members was initiated by Johnson and Winter (1966) by the American Iron and Steel Institute (AISI) to establish the design specifications of stainless steels. As a result, AISI published the first edition of ‘Specification for the Design of Light Gage Cold-Formed Stainless Steel Structural Members’ (AISI, 1968) and ‘Stainless Steel Cold-Formed Structural Design Manual’ (AISI, 1974). Recently, design standards for cold-formed stainless steel members have been specified by the Structural Engineering Institute (SEI)/American Society of Civil Engineers (ASCE), e.g., SEI/ASCE (2002), AS/NZS 4673 (2001), EN 1993-1-4 (2006), and SSBA (2006). Kuwamura (2001) and Kuwamura and Isozaki (2002) conducted the experimental research concerning the ultimate behaviors of cold-formed 304 stainless steel (austenitic stainless steel SUS 304 in JIS) shear bolted connections. In their model, bolt arrangement end distance and plate thickness were used as variables. Design equations to predict the ultimate strength were proposed by Kuwamura and Isozaki (2002) with the consideration of fracture mode and ultimate strength. However, the modified formulae by Kuwamura et al. (2002) tended to overestimate ultimate strength of bolted connections for some bolted connections with severe curling. Subsequently, Kim (2007) and Kuwamura and Kim et al. (2008; 2009) verified the applicability of finite element analysis for predicting the ultimate behaviors of austenitic stainless steel bolted connections and suggested the revised strength equation considering the strength reduction caused by curling.
The austenitic stainless steels contain 18% chromium and 8% nickel as principle alloy contents. Nickel is a high-priced element and austenitic stainless steel is considerably more expensive compared to ferritic stainless steel and martensitic stainless steel. For these reasons, ferritic stainless steels which do not contain nickel and are low-priced have been applied to buildings as structural members. Most of the ferritic stainless steels have chromium in the range of 11.5% to 18% as a major alloy and no nickel except AISI type 409 (SEI/ASCE-8-02, 2002). Even if corrosion resistance, ductility, formability, and weldability are not as good as in the austenitic stainless steels, ferritic stainless steels have good corrosion resistance in mildly corrosive environments and superior resistance to stress corrosion cracking.
Salih et al. (2010; 2011) proposed the improved design equations of net-section capacity for single- and double-row bolted connections and bearing failure capacity for single shear stainless steel bolted connections through the validation of numerical approach and parametric study. In their studies, the numerical investigation of net-section failure focused on single- and double-row bolted connections. The studies of bearing failure were for single- and double-shear bolted connections with one bolt (main variables: end distance, edge distance and plate thickness).
The previous studies for ferritic stainless bolted connections are limited to the strength estimation of net-section and bearing failures. The ultimate strength of other failure modes such as shear out and block shear in single-shear bolted connections with thin-walled ferritic stainless steel has never been considered. Therefore, this paper focuses on the experimental research for single-shear bolted connection with ferritic stainless steel designated by STS430 (Korean standards, equivalent to AISI grade 430). Specimens of single-shear bolted connections fastened with ferritic 430 stainless steel plates are planned and tested in order to investigate the ultimate behaviors such as fracture mode, ultimate strength, and curling occurrence. The bolted connections contain four types of bolt arrangements and have end distance parallel to the direction of applied force as main variables. Moreover, test results are compared with the current design standards and new approach considering the curling effect is suggested to predict the ultimate strength of ferritic stainless steel bolted connections.
2. Experimental
2.1. Plan of specimen and configuration
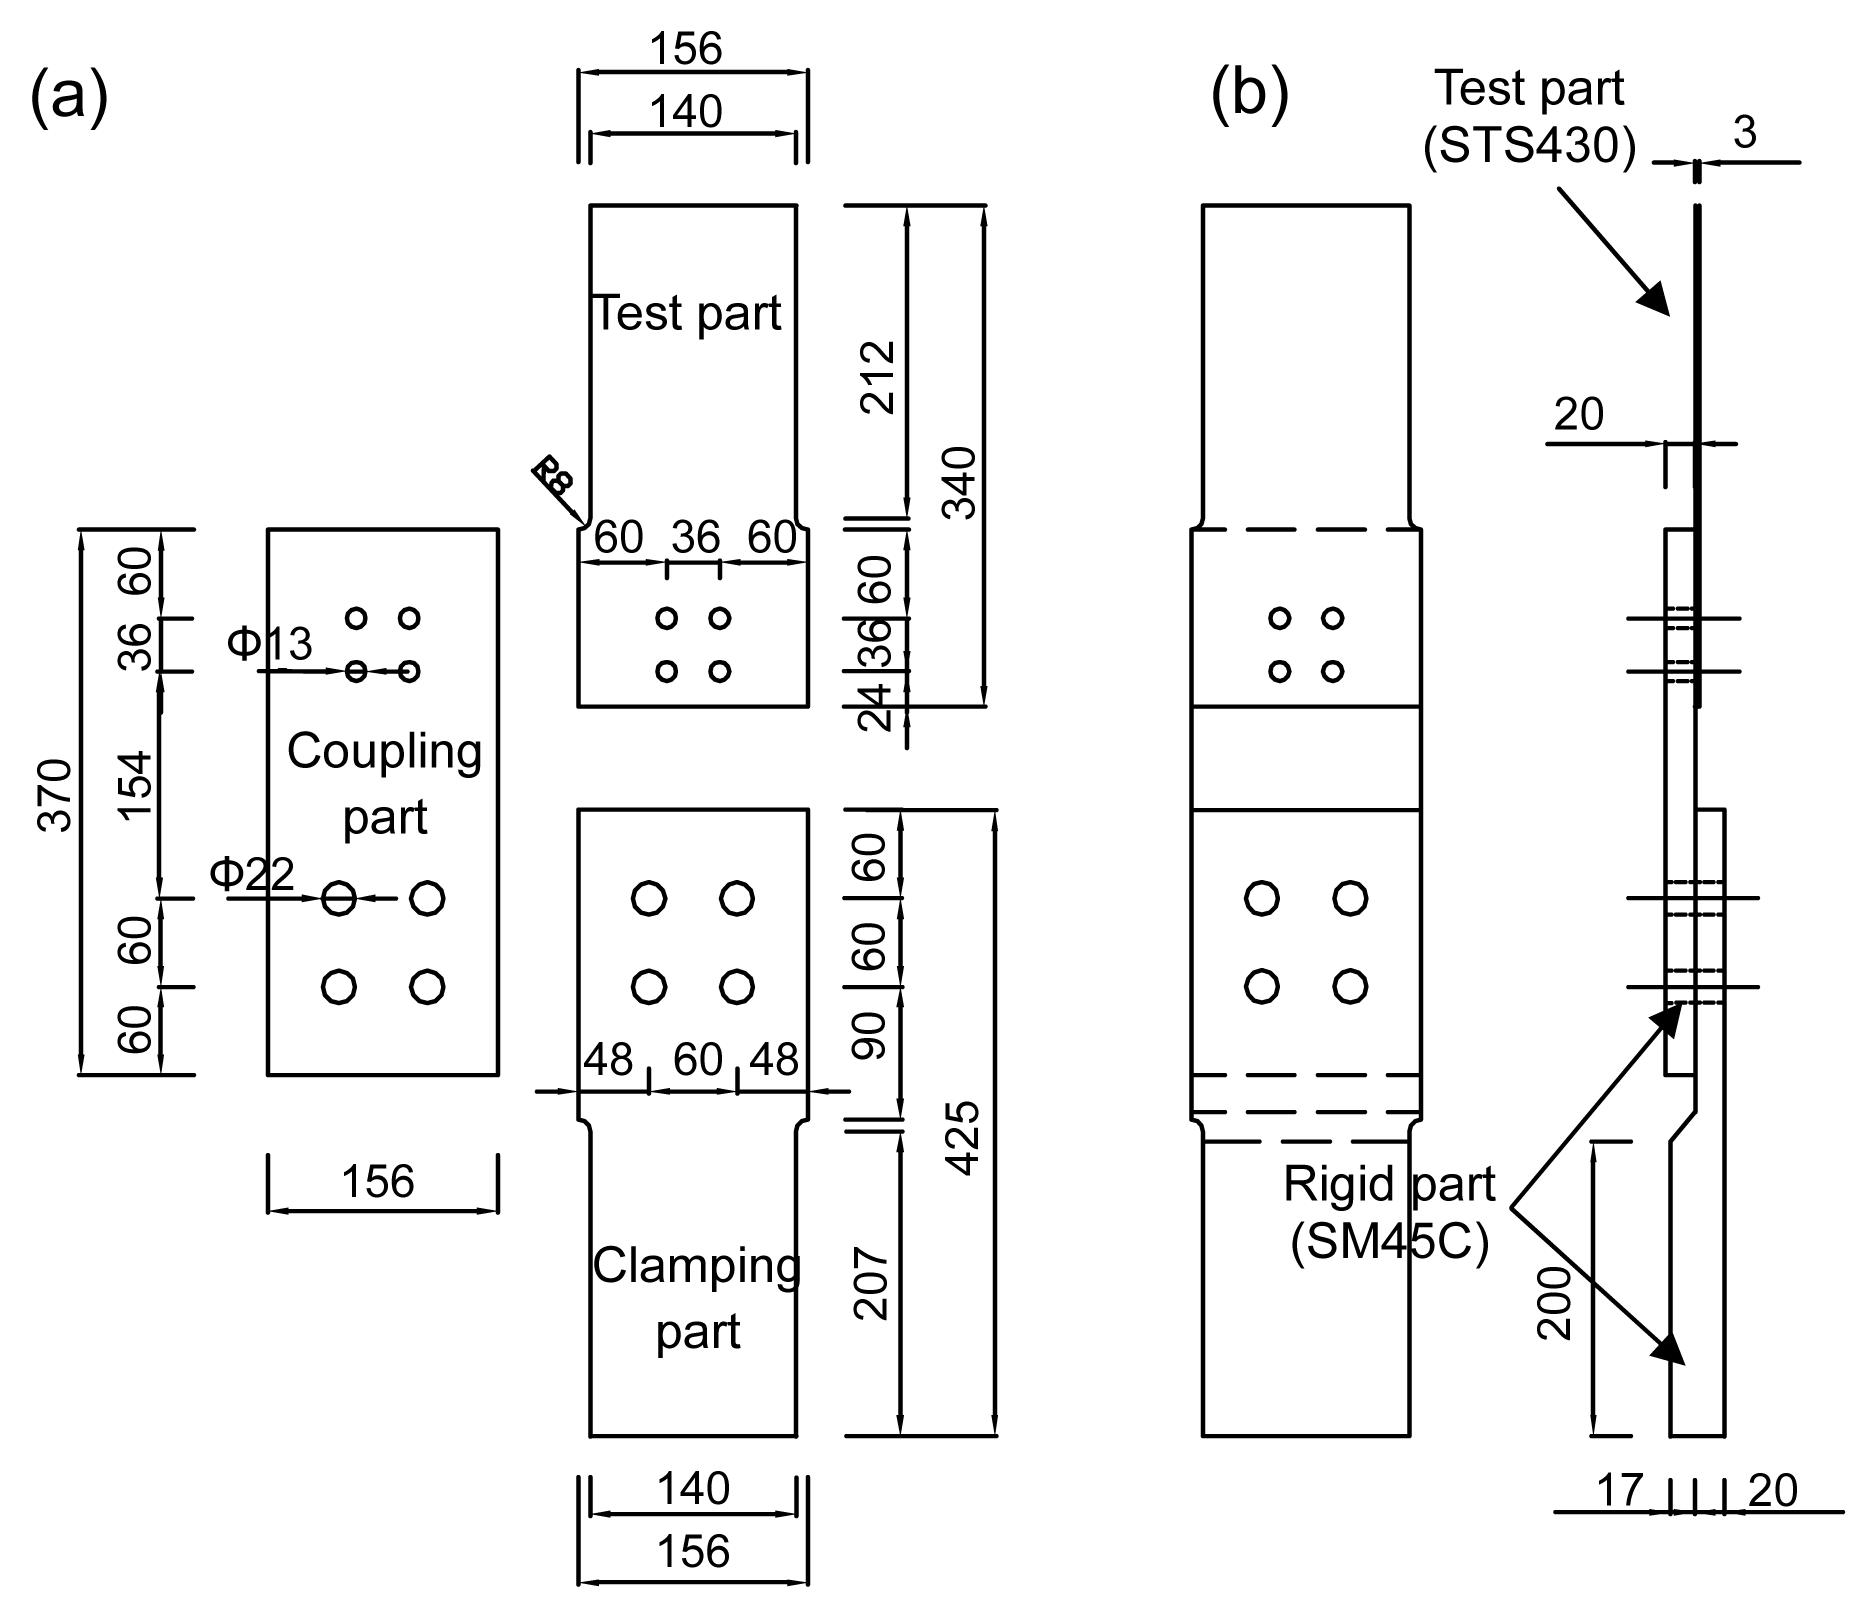
Specimens for single-shear bolted connections are composed of four types of bolt arrangement, i.e., 1×1 (SF1 series), 1×2 (SF2 series), 2×1 (SF3 series), 2×2 (SF4 series) array (Fig. 1), and have a fixed long edge distance (b=60 mm) perpendicular to the direction of loading in order to have them failed by shear-out fracture or block shear fracture instead of mere net-section fracture of plate. Test parts of these specimens are fastened with rigid plates for coupling by high strength bolts (F10T, equivalent to AISI A490) of 12 mm diameter (d) as depicted in Figs. 2 and 3. The plates of test part have bolt hole diameter of 13 mm (φ), pitch (p), and gauge distance (g) of 36 mm (=3.0d), nominal thickness (t=3.0 mm) as a constant dimension and end distances (e=2.0d, 2.5d, 3.0d, 4.0d, 5.0d) as main variables. The list of specimens is summarized in Table 1 (p.123). Steel material for specimens is ferritic stainless steel STS430. Rigid parts (clamping part and coupling part) are made from SM45C (equivalent to AISI 1045). The loading center in test part (3.0 mm plate) is planned to coincide with the thickness center of the clamping part (20 mm plate+37 mm plate). High strength bolts (M12, d=12 mm) for fastening test part plate to coupling rigid part are designed to contact directly with bolt hole of connection plate. The designations of specimens are as follows. For example, specimen SF1T30E60 in Table 1 means that first, ‘SF’ is ferritic stainless steel; second, ‘1’ is a kind of bolt arrangement (1×1 array), ‘T30’ is the plate thickness (t=3.0 mm), and E60 is the end distance (e=60 mm).
Fig.1 Geometry and bolt array of specimen (unit: mm) (a) SF1 series (1×1 bolt array); (b) SF2 series (1×2 bolt array); (c) SF3 series (2×1 bolt array); (d) SF4 series (2×2 bolt array)
Fig.2 Assembly of specimens (unit: mm) (a) Plane figure of test part and rigid part; (b) Assembly and side elevation of test part and rigid part
Fig.3 Set-up of specimen, transducers (L1, L2, and L3) and strain gages (G1, G2 and G3) (unit: mm) (a) Two transducers (SF4 series); (b) Strain gages and three transducer*; * The name of SF4T30E60 was miswritten with SFT30E60 when performed the test
Table 1
List of specimens
Specimen
Bolt array, row×column
End distance (mm)
SF1T30E24
1×1
24
SF1T30E30
30
SF1T30E36
36
SF1T30E48
48
SF1T30E60
60
SF2T30E24
1×2
24
SF2T30E30
30
SF2T30E36
36
SF2T30E48
48
SF2T30E60
60
SF3T30E24
2×1
24
SF3T30E30
30
SF3T30E36
36
SF3T30E48
48
SF3T30E60
60
SF4T30E24
2×2
24
SF4T30E30
30
SF4T30E36
36
SF4T30E48
48
SF4T30E60
60
2.2. Tensile coupon test and material properties
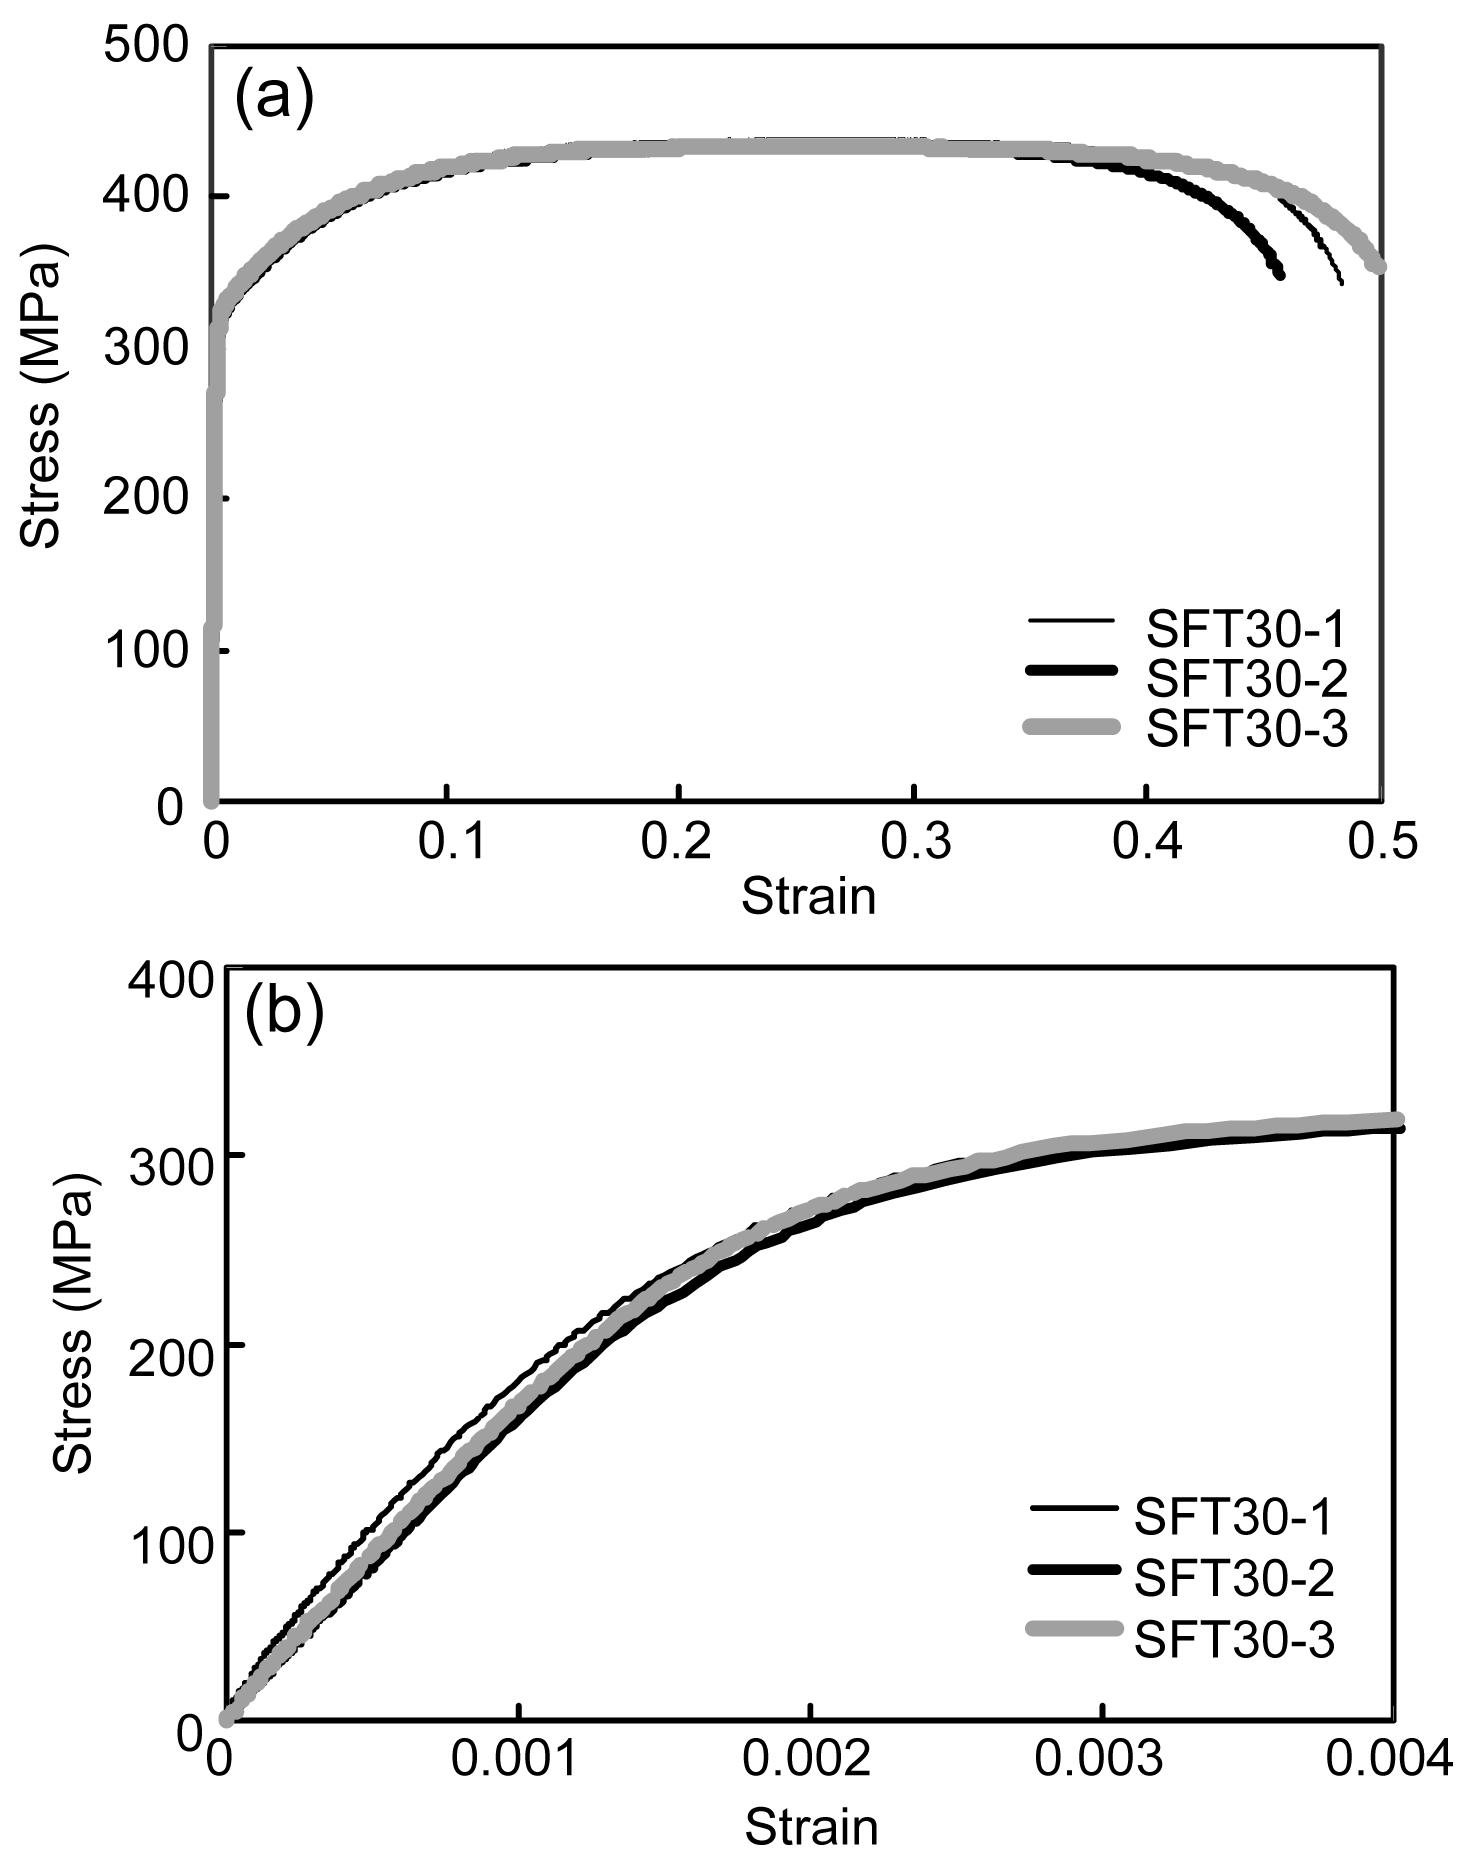
Tensile test results for three coupons (SFT30-1, SFT30-2, SFT30-3) are summarized in Table 2 and Fig. 4 (p.123). One plastic strain gauge and two displacement transducers (LVDT: linear variable differential transformer) were used to obtain strain data and enforced displacement, respectively. Nominal stress-strain curves obtained from coupon tests are displayed in Fig. 4. Stainless steels show no clearly defined yield point (plateau), unlike common carbon steel (Fig. 4). Therefore, the American Society for Testing and Materials specifies that the yield strength is determined by the 0.2% offset method (ASTM A370, 2010). JIS Z 2241 (2010) and JIS G 4321 (2010) specify that the yield strength is defined by the 0.1% offset (proof) method for stainless steel. JIS Z 2241 (2010) definition may be reasonable to provide a sound deflection control at the serviceability limit state and a more conservative value in estimating the width to thickness ratio for plate local bucking strength. In this study, the 0.1% offset (proof) method is applied for yield strength of ferritic stainless steel (JIS Z 2241, 2010).
Tensile force was applied to the specimen with a displacement control mode in order to obtain load (strength)-displacement (stroke) curve. Measuring data were stored into data logger at every 1.0 s interval. Specimens were tested at a displacement rate of 0.5 mm/min.
The displacement of the loading direction was measured with two transducers (L1 and L2) attached in the top and bottom grips of the test machine as shown in Fig. 3a, and the plotted value in load-displacement curve is an average of two measured displacements. The third transducer (L3) was also used to measure curling displacement (out of plane deformation), which was placed at the location of 30 mm apart from the center of bolt hole toward plate end of specimen as given in Fig. 3a. Uniaxial strain gauges were attached to the plate surface of each specimen. The locations of the attached strain gauges (G1, G2 and G3) on plate surface are shown in Fig. 3b. The gauge G1 in all specimens was located at the point 30 mm apart from the center of bolt hole (No. 1 bolt), in order to observe the strain change of loading direction during test. The gauge G2 was attached at the center between two bolts (Nos.1 and 2 in SF2 series and Nos. 3 and 4 in SF4 series with two column-bolt array) and G3 gauge was also glued at the path of shear critical section between No. 1 bolt and No. 3 bolt.
3. Test results
3.1. Fracture mode and ultimate strength
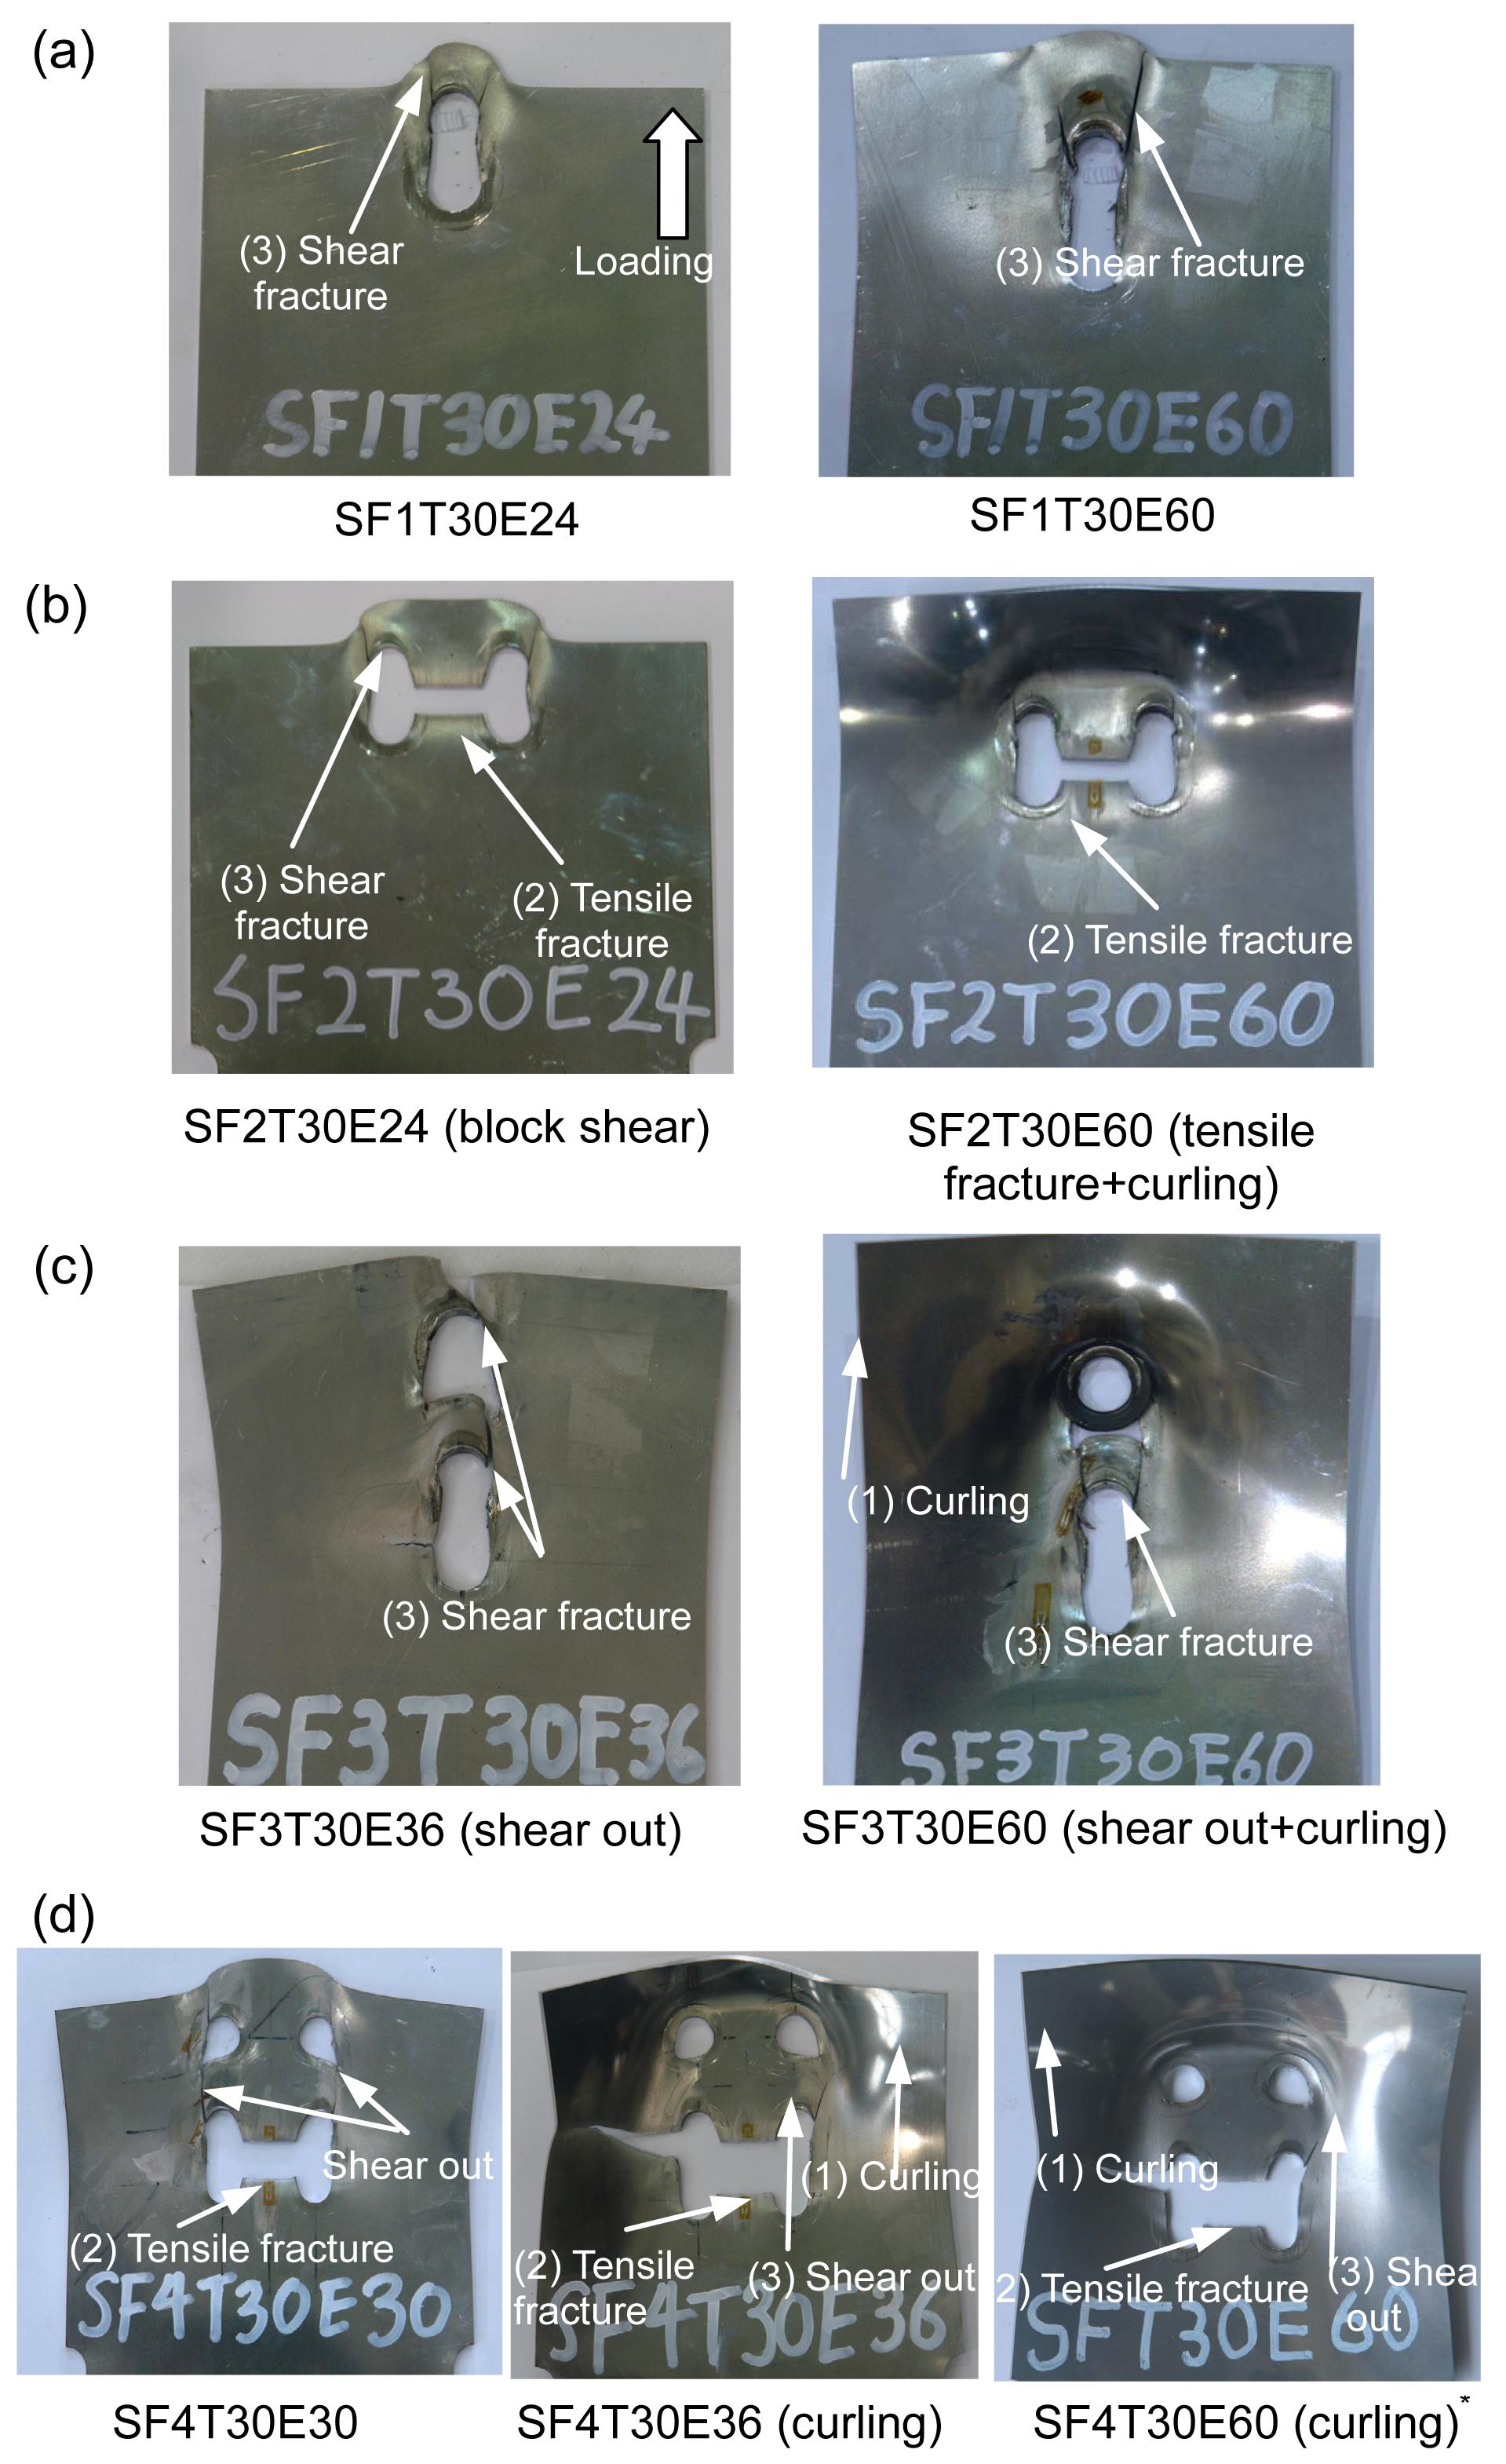
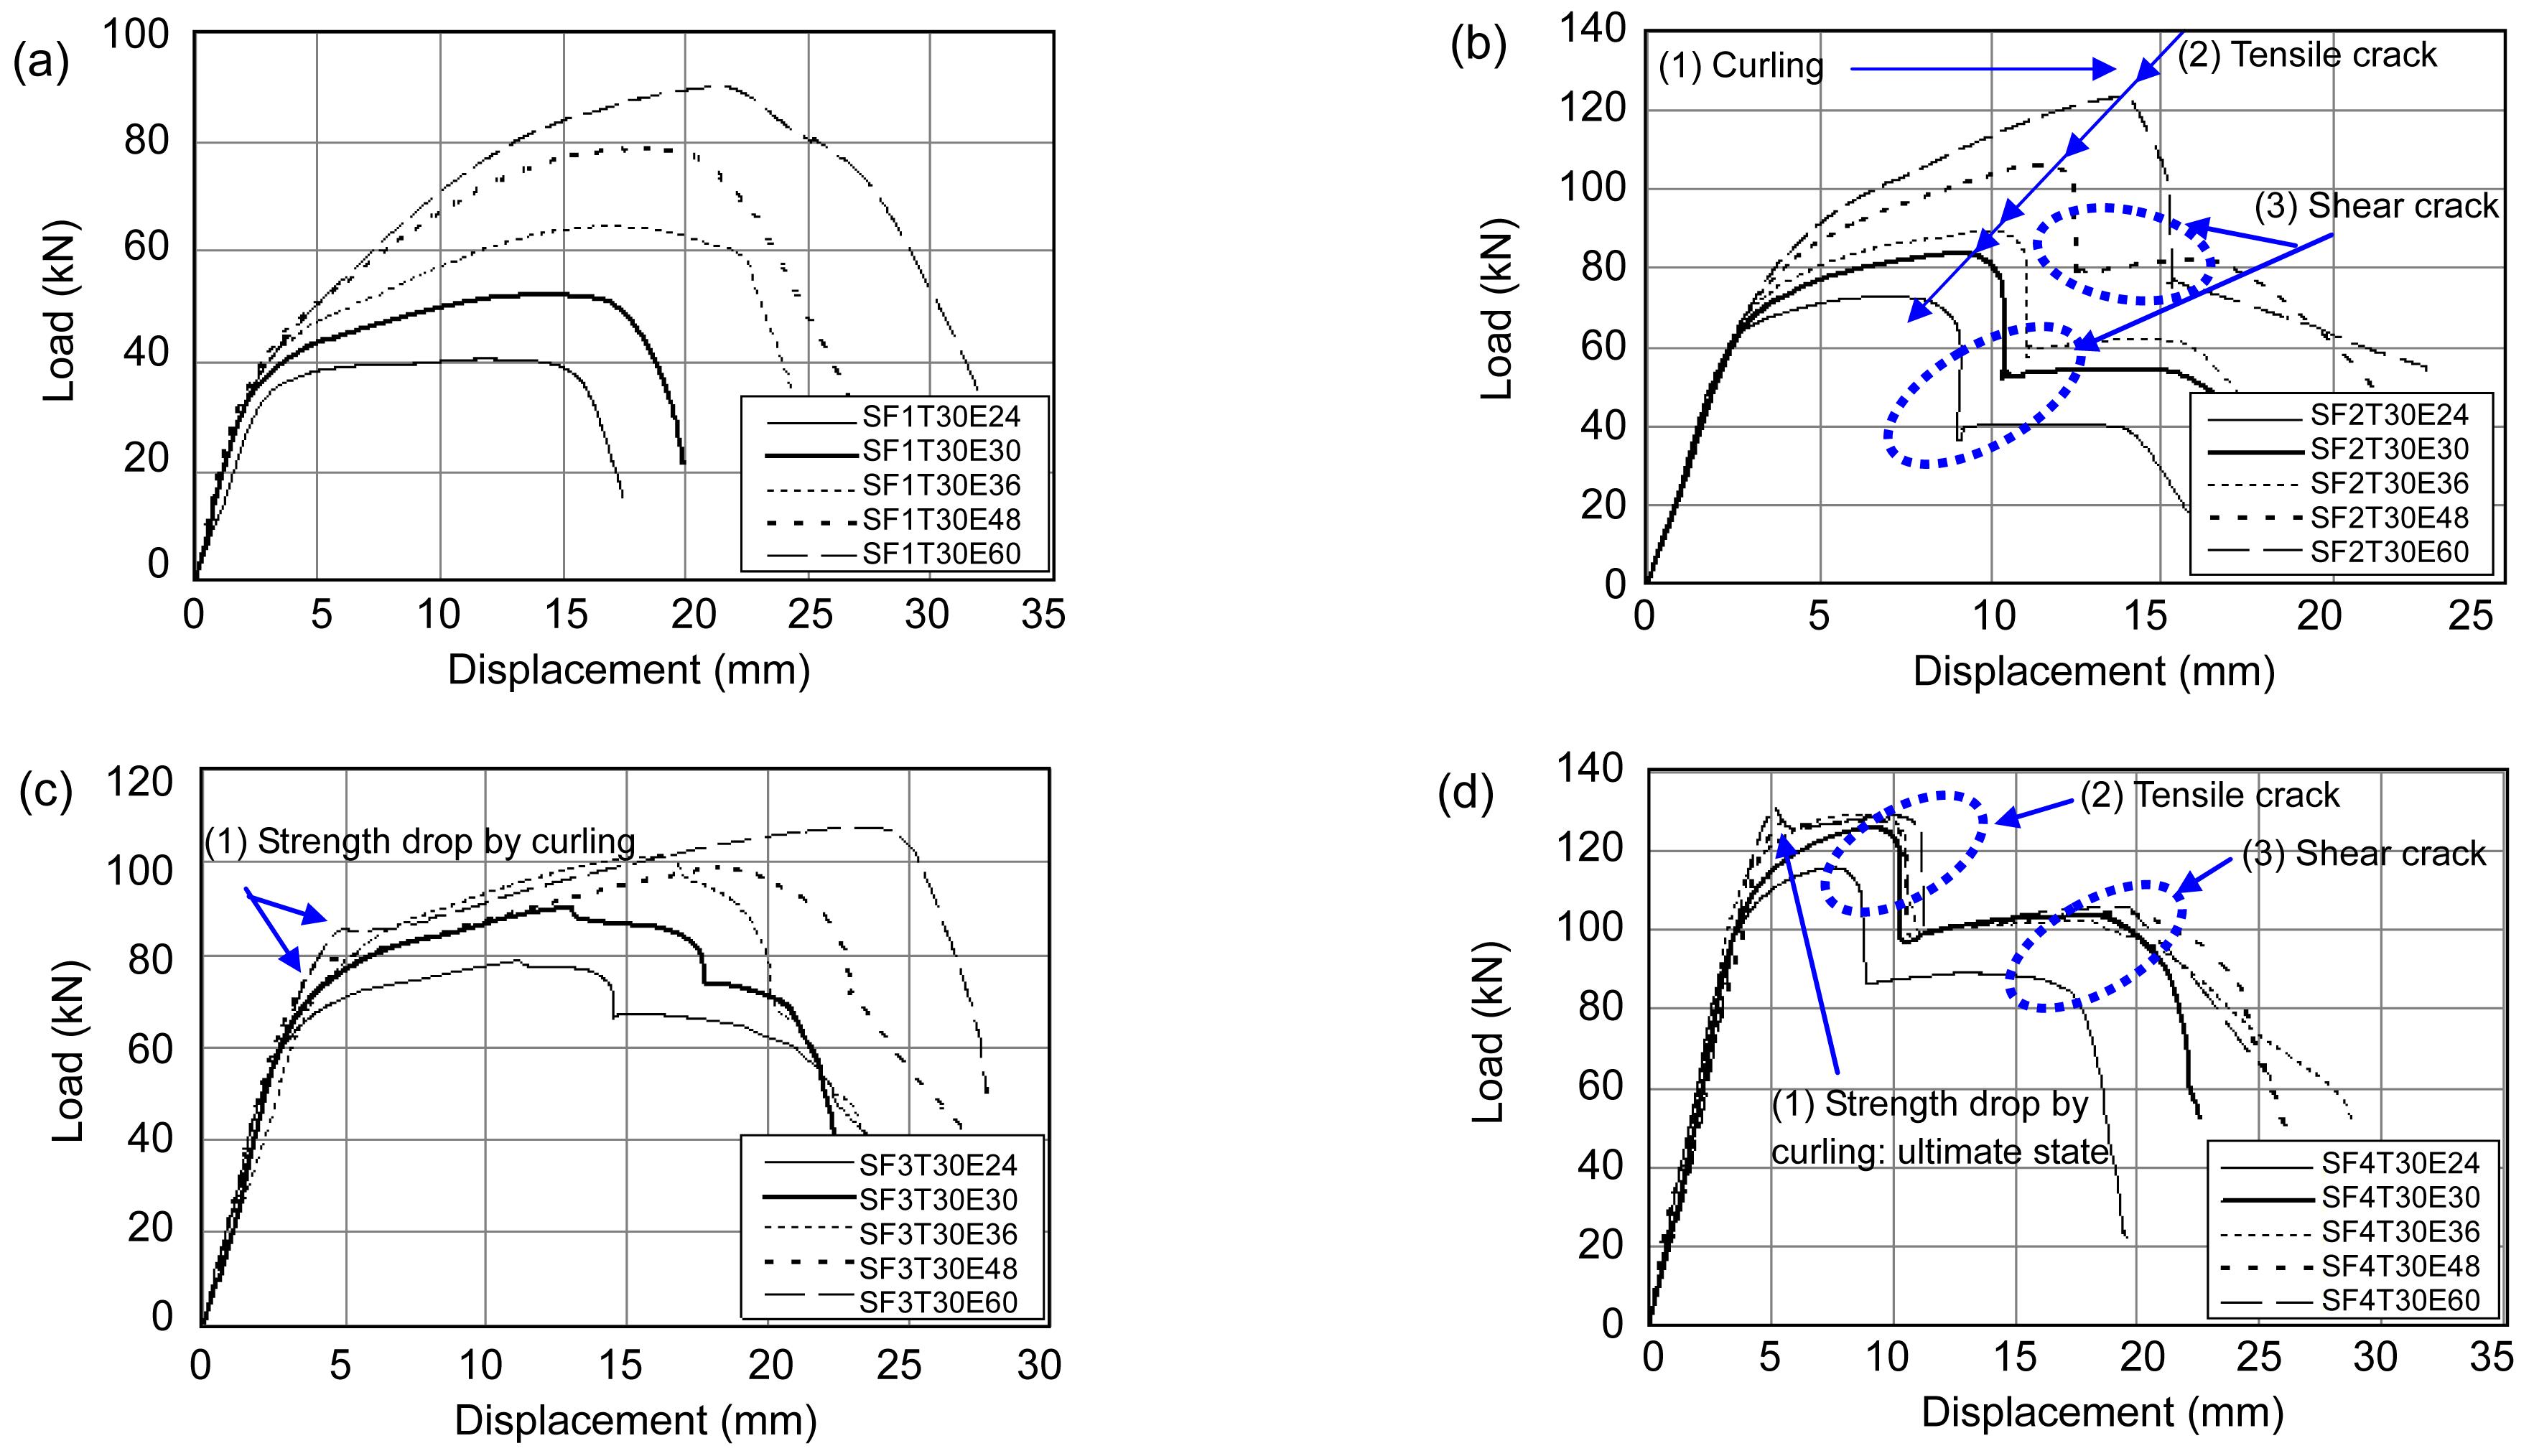
Figs. 5 and 6 exhibit fracture shapes of specimens in each series and load-displacement curves, respectively. Connections of SF1 series with single bolt failed by shear fracture (end tear-out fracture) regardless of the increase of end distance as illustrated in Fig. 5a. The shear fracture occurred along two shear section lines, which extended from bolt hole in the direction of the applied force. For SF2 series (1×2 bolt array), all specimens except SF2T30E60 with the longest end distance of 60 mm led to typical block shear fracture as given in the left side of Fig. 5b. Specimen SF2T30E60 failed by tensile fracture between two bolts accompanied by severe curling, i.e., the curling occurred prior to fracture through the shear section as shown in the right side of Fig. 5b and Fig. 6b. Bolted connections of SF3 series depicted in Fig. 1c exhibit the two near-longitudinal shear out fracture (the left of Fig. 5c) extending from the plate part between the two bolts to the end of plate for specimens with short end distances (e=24, 30, 36 mm). However, for SF3T30E48 and SF3T30E60 with long end distances (e=48, 60 mm), the ultimate state was determined by shear fracture and curling as shown in the right of Fig. 5c and Fig. 6c, where the curling contributed to the transient strength reduction on the curves. Lastly, fracture modes of SF4 series (2×2 bolt array) in ultimate state can be classified into two types as summarized in Table 3. Specimens SF4T30E24 and SF4T30E30 resulted in typical block shear fracture as shown in the leftmost of Fig. 5d and tensile fracture between two bolts far away from the plate end led to the ultimate strength (the maximum strength on load-displacement curve). For specimens SF4T30E36, SF4T30E48 and SF4T30E60 with end distances of 36, 48 and 60 mm, respectively curling was observed around plate end and had an influence on ultimate strength reduction of bolted connections. Especially, for SF4T30E36 and SF4T30E60, the ultimate strength was decided by curling occurrence and development prior to tensile fracture occurrence. From the above results, it is known that the single-shear bolted connections with ferritic stainless steel and long end distance except specimens of single bolt can be accompanied by curling.
Fig.5 Fracture shapes of specimens in each series (a) SF1 series (shear out); (b) SF2 series; (c) SF3 series; (d) SF4 series (block shear); * The name of SF4T30E60 was miswritten with SFT30E60 when performed the test
Fig.6 Load-displacement curves of test results (a) SF1 series; (b) SF2 series; (c) SF3 series; (d) SF4 series
Table 3
Test results for specimens
Specimen
Pue (kN)
Curling occurrence
Fracture mode at ultimate strength
Fracture mode at the end of test
Pue/Pue(eMin))
SF1T30E24
40.47
No
Shear-out fracture
Shear-out fracture
1.00
SF1T30E30
52.53
No
1.30
SF1T30E36
64.58
No
1.60
SF1T30E48
78.69
No
1.94
SF1T30E60
90.16
No
2.23
SF2T30E24
72.91
No
Tensile fracture between two bolts perpendicular to the direction of load
Block shear fracture
1.00
SF2T30E30
83.59
No
Tensile fracture between two bolts perpendicular to the direction of load
1.15
SF2T30E36
89.38
No
Tensile fracture between two bolts perpendicular to the direction of load
1.23
SF2T30E48
106.13
No
Tensile fracture between two bolts perpendicular to the direction of load
1.46
SF2T30E60
123.38
Yes
Tensile fracture+curling
1.69
SF3T30E24
78.89
No
Shear fracture of plate end
Shear-out fracture
1.00
SF3T30E30
90.36
No
Shear fracture of plate end
1.15
SF3T30E36
101.33
No
Shear fracture of plate end
1.28
SF3T30E48
98.78
Yes
Shear fracture between two bolts parallel to the direction of load
1.25
SF3T30E60
107.51
Yes
Shear fracture between two bolts parallel to the direction of load
1.36
SF4T30E24
115.84
No
Tensile fracture between two bolts perpendicular to the direction of load
Block shear fracture
1.00
SF4T30E30
125.83
No
Tensile fracture between two bolts perpendicular to the direction of load
1.09
SF4T30E36
129.36
Yes
Curling+tensile fracture
1.12
SF4T30E48
127.79
Yes
Curling+tensile fracture
1.10
SF4T30E60
130.73
Yes
Curling+tensile fracture
1.13
Table 3 contains test results such as ultimate strength (Pue), curling occurrence, fracture modes at ultimate state point and the end of test, and strength ratio (Pue/Pue(eMin)). Pue/Pue(eMin) is the ratio of ultimate strength of specimen (Pue) to ultimate strength of specimen with the minimum end distance (Pue(eMin)), and dueC and PueC denote displacement and strength, respectively in strength drop point caused by curling. Note that fracture mode at the end point of test did not necessarily coincide with fracture mode at the ultimate state of bolted connection, where the ultimate strength of specimen is obtained.
Specimens with single bolt (SF1 series) did not show curling. Strength ratio (Pue(eMin))=1.00–2.23) in Table 3 increases as the end distance increases. Initial stiffness in elastic region of load-displacement curve was nearly identical to all specimens. After the yielding of bolted connections, the rigidity also increased. For uncurled specimens with other bolt arrays, ultimate strengths tended to increase with the increase of end distance as those with single bolt (Table 3). However, specimens with remarkable curling, in particular, SF3T30E48, SF3T30E60, SF4T30E48 and SF4T30E60 showed a sudden strength drop caused by curling as shown in Figs. 6c and 6d. The above-mentioned four specimens with end distance of more than 36 mm did not give higher strength than expected because of the strength reduction by curling compared to that of the bolted connections (SF3T30E36 or SF4T30E36) with an end distance of 36 mm (Table 3). Besides, ultimate strengths (98.78 kN, 127.79 kN, respectively) of SF3T30E48 and SF4T30E48 were lower than those (101.33 kN, 129.36 kN, respectively) of SF3T30E36 and SF4T30E36 with 36 mm end distance in spite of connections with larger end distance.
3.2. Curling effect on strength and strain
3.2.1. Curling effect on ultimate strength
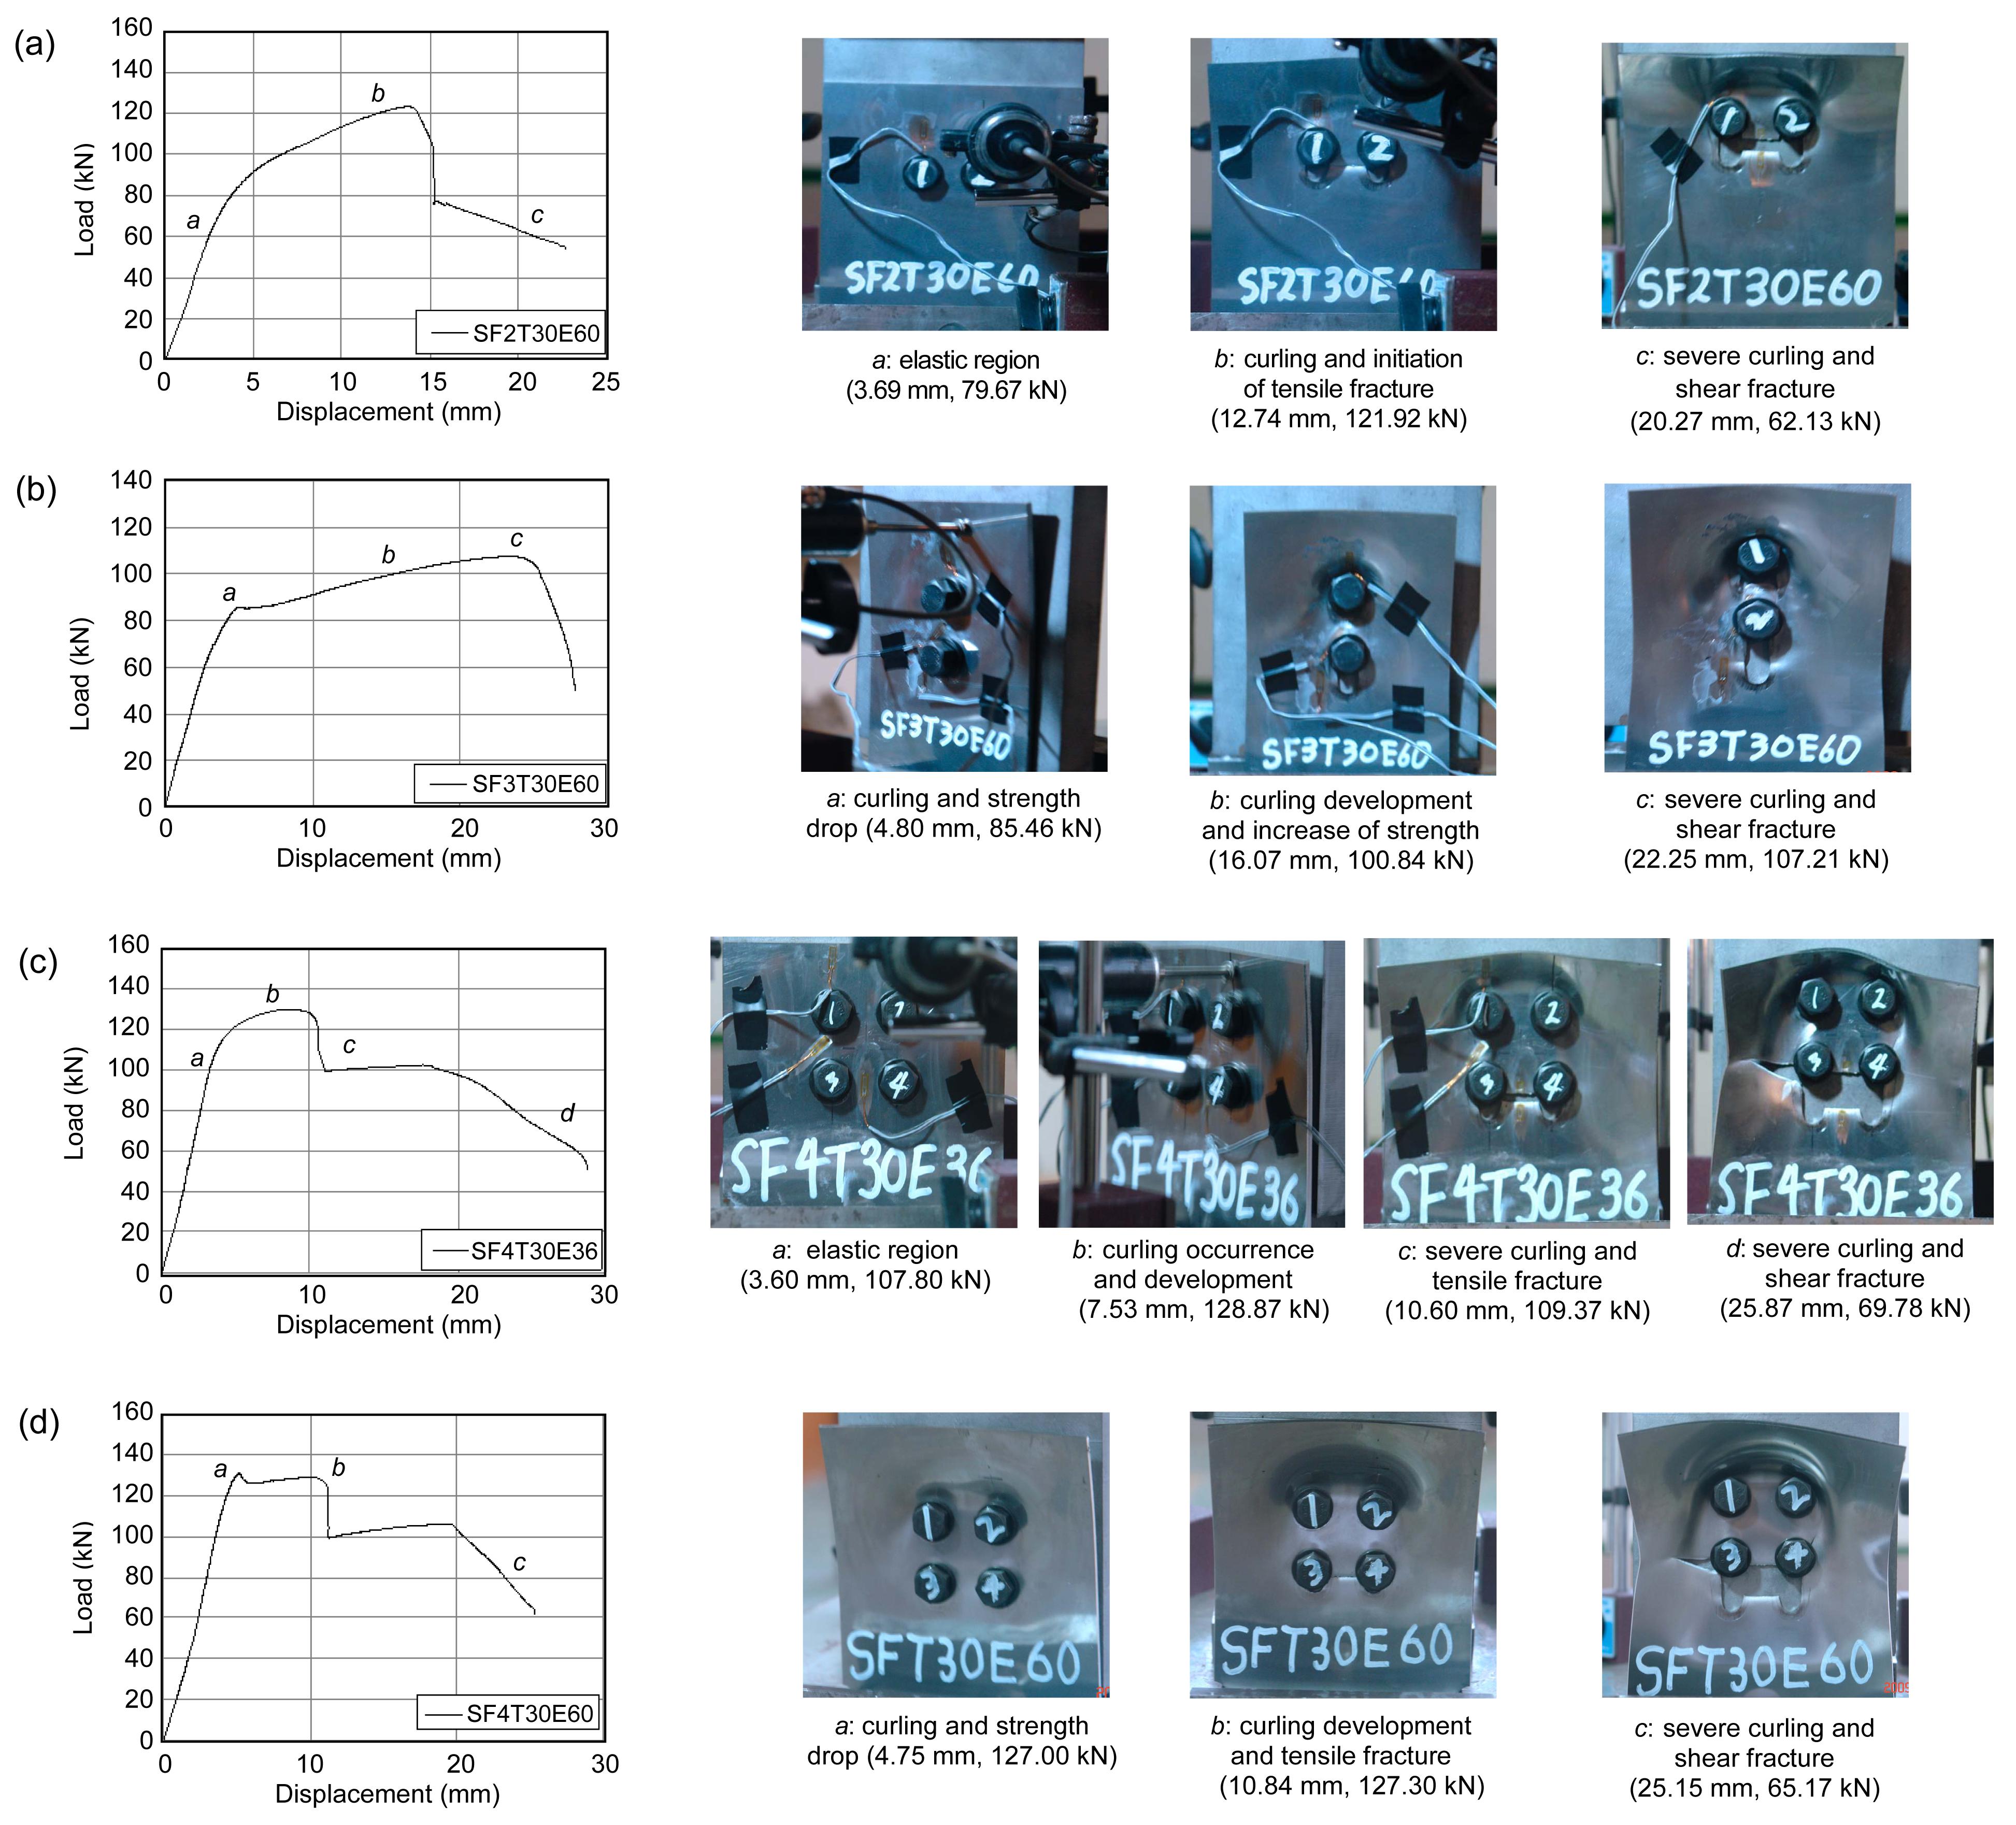
As mentioned in the subsection 3.1, it is clear that curling perpendicular to the direction of the force led to ultimate strength reduction for some curled specimens. The pictures of deformed shape and fracture development were taken at an arbitrary displacement during test to investigate whether the ultimate strength of bolted connection is affected by curling or not (Fig. 7). Table 4 summarizes the detailed investigation results of displacement and strength taken at critical points; strength drop by curling occurrence and tensile fracture between two bolts for curled specimens.
Fig.7 Fracture and curling occurrence with the increase of load (a) SF2T30E60 (e=60 mm, b=60 mm); (b) SF3T30E60 (e=60 mm, b=60 mm); (c) SF4T30E36 (e=36 mm, b=60 mm); (d) SF4T30E60* (e=60 mm, b=60 mm)*; * The name of SF4T30E60 was miswritten with SFT30E60 when performed the test
Table 4
Additional investigation of strength and displacement at critical point for curled specimens
Specimen
Ultimate state
Strength drop point by curling
Fracture mode
due (mm)
Pue (kN)
dueC (mm)
PueC (kN)
SF2T30E60
Curling/Tensile fracture between two bolts
13.51/13.71
123.28/123.38
13.51
123.28
SF3T30E48
Shear fracture between two bolts parallel to the direction of load
17.94
98.78
4.15
78.50
SF3T30E60
23.29
107.51
5.11
85.65
SF4T30E36
Curling/Tensile fracture between two bolts
8.11/10.52
129.36/122.30
8.11
129.36
SF4T30E48
5.78/8.89
127.60/127.79
5.78
127.60
SF4T30E60
5.10/11.18
130.73/123.77
5.10
130.73
From Fig. 7a, it can be found that the ultimate state such as curling and tensile fracture in SF2T30E60 occurred almost simultaneously. Specimen SF2T30E60 at point a (displacement: 3.69 mm, corresponding load (strength): 79.67 kN, where these pictures were taken during test) remains elastic. With the increase of applied load, stress concentrated on tensile section between two bolts and curling deformation began to occur. Therefore, at point b (displacement: 12.74 mm, corresponding strength: 121.92 kN) of load (strength)-displacement, temporary strength drop by curling (at the displacement of 13.51 mm as described in Table 4) was observed. Also, tensile fracture initiated between two bolts right after curling occurrence. There was no big difference in the load (strength) between two ultimate states; curling and tensile fracture. Shear fracture occurred at point c (displacement: 20.27 mm, corresponding strength: 62.31 kN), followed by the maximum state of severe curling and tensile fracture. Consequently, this indicates that specimen SF2T30E60 was little affected by the curling. Fig. 7b represents the deformed shapes and fracture modes of SF3T30E60 taken at points a, b and c. Sudden strength reduction by curling was observed directly after getting through point a (displacement: 4.80 mm, corresponding strength: 85.46 kN). The location of strength drop by curling on curve was expressed with displacement of 5.11 mm and strength of 85.65 kN in Table 4. The strength of bolted connections increased steadily to the peak point c, where specimen failed by shear fracture as shown in Fig. 7b. Fig. 7c displays load-displacement curve of SF4T30E36 with four specified points and photographs of deformed shape and fracture captured at each point. At point b (displacement: 7.53 mm, corresponding strength: 128.87 kN), specimens showed curling occurrence without any tensile or shear fracture and the curling led to the ultimate strength (displacement: 8.11 mm, strength: 129.36 kN in Table 4). When tensile fracture occurred between two bolts (No. 3 bolt and No. 4 bolt) around point c, there was a sharp drop in strength. Finally, the shapes of specimen SF4T30E60 taken from three critical points are shown in Fig. 7d. Specimen SF4T30E60 had a strength drop near point a (displacement: 5.10 mm, corresponding strength: 130.73 kN) caused by curling in Table 4. The picture of the center of Fig. 7d displayed the fracture shape at point b, where curling deformation continued to increase and tensile fracture initiated between two bolts of No. 3 and No. 4. Also, additional tensile fracture toward the left end of the plate and shear fracture occurred as shown in the picture of right side of Fig. 7d, and it resulted in the last strength drop. Therefore, it can be noted that curling caused the strength drop in connection even if the degree of the curling effect is different from the bolt arrangement and end distance. Among them, specimens with four bolts (2×2 array; SF4 series) and long end distance did not show the remarkable increase of strength and stiffness after strength dropped by curling.
3.2.2. Curling deformation and strain distribution
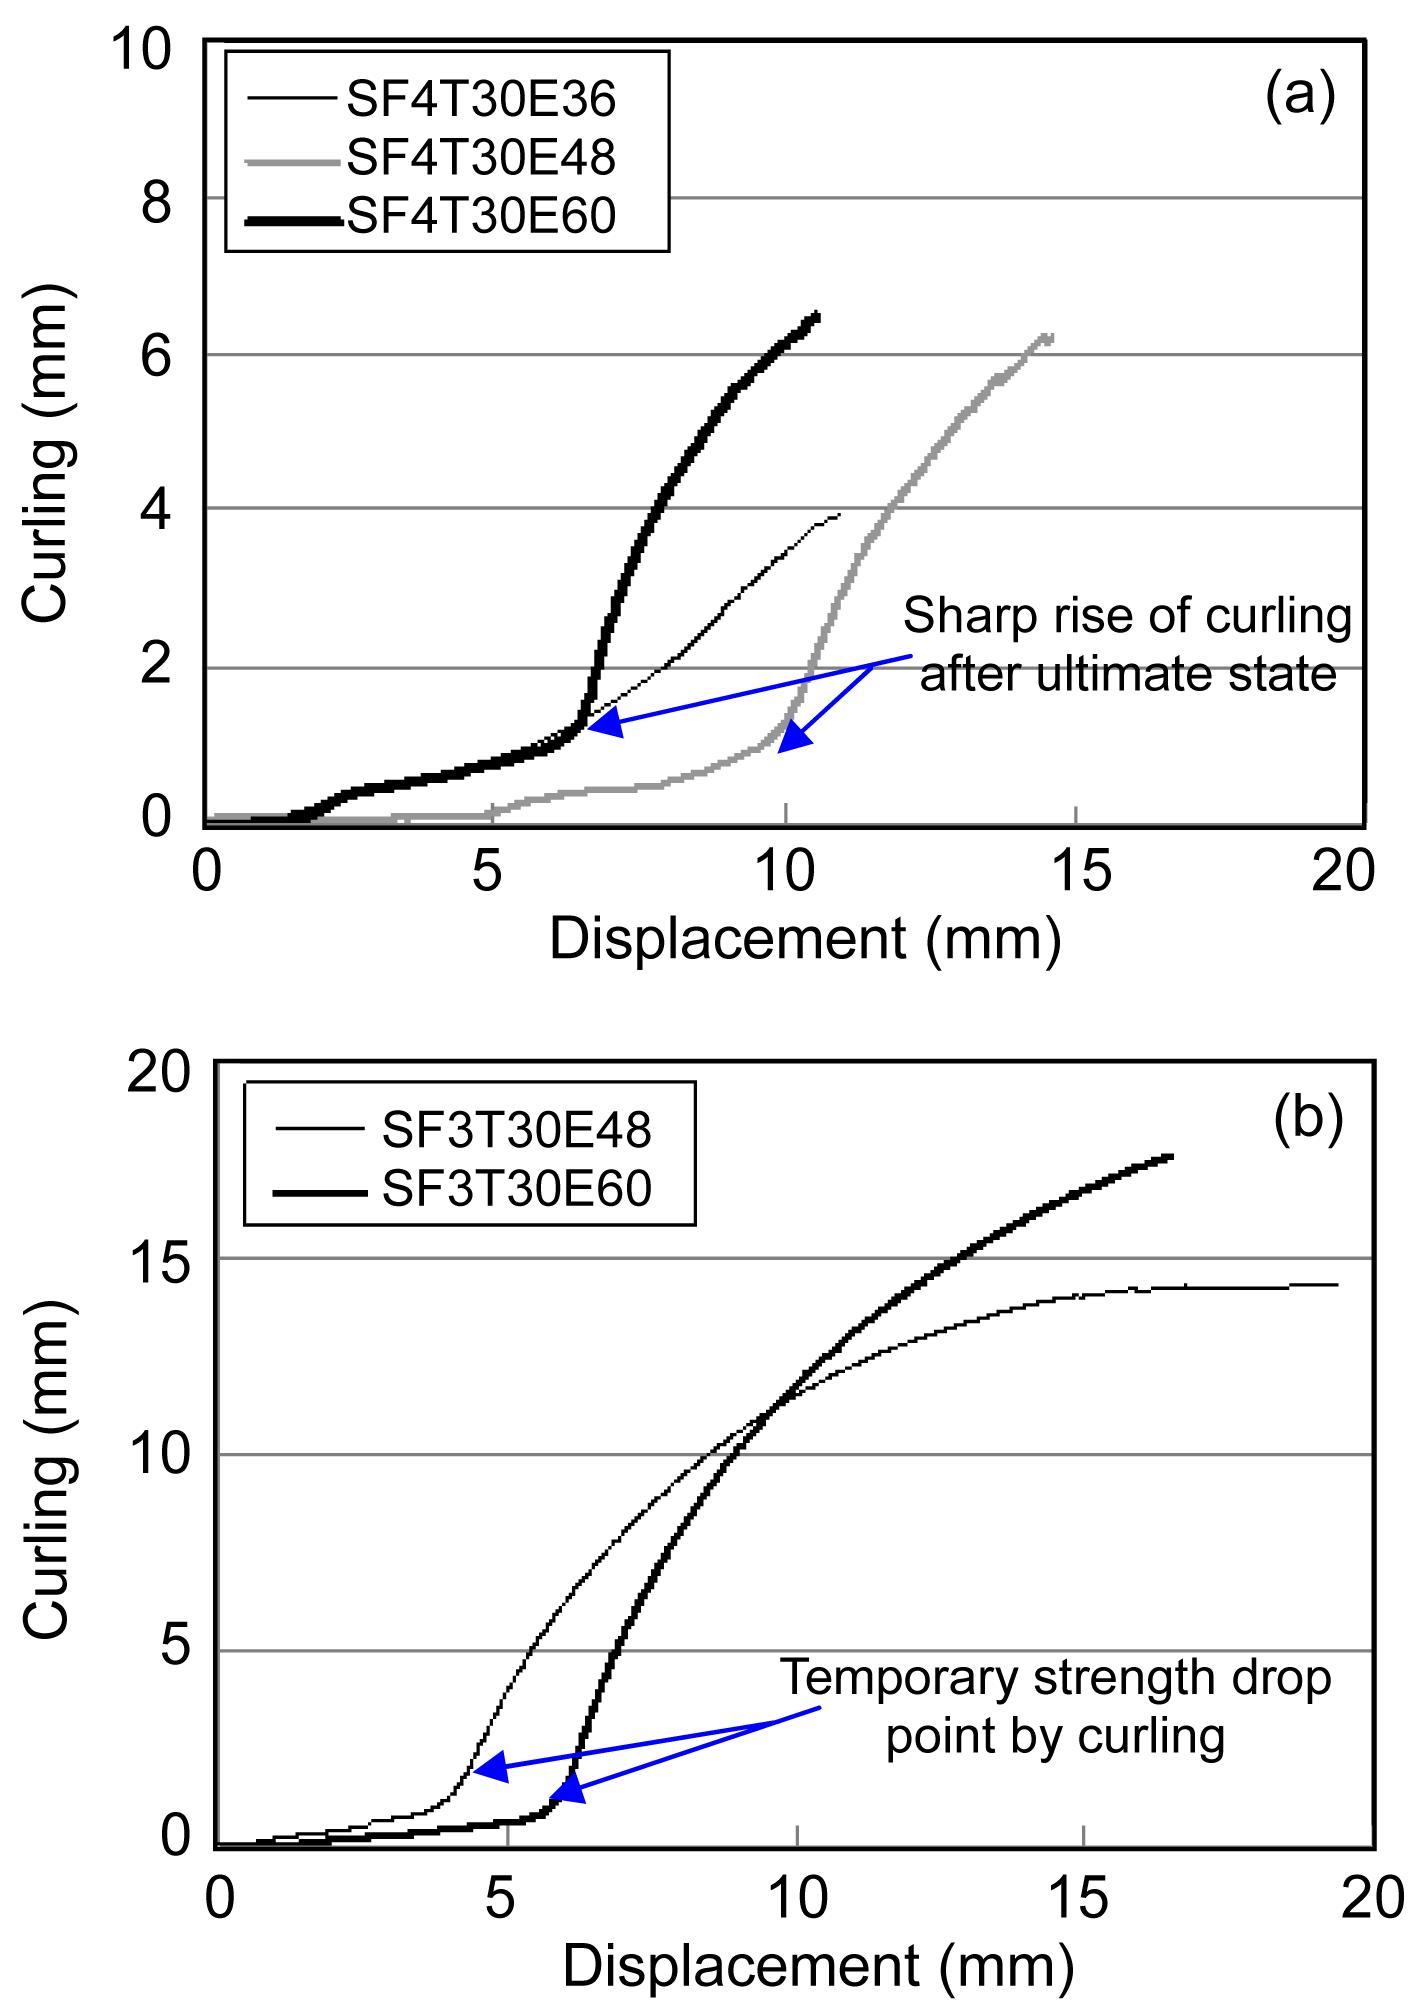
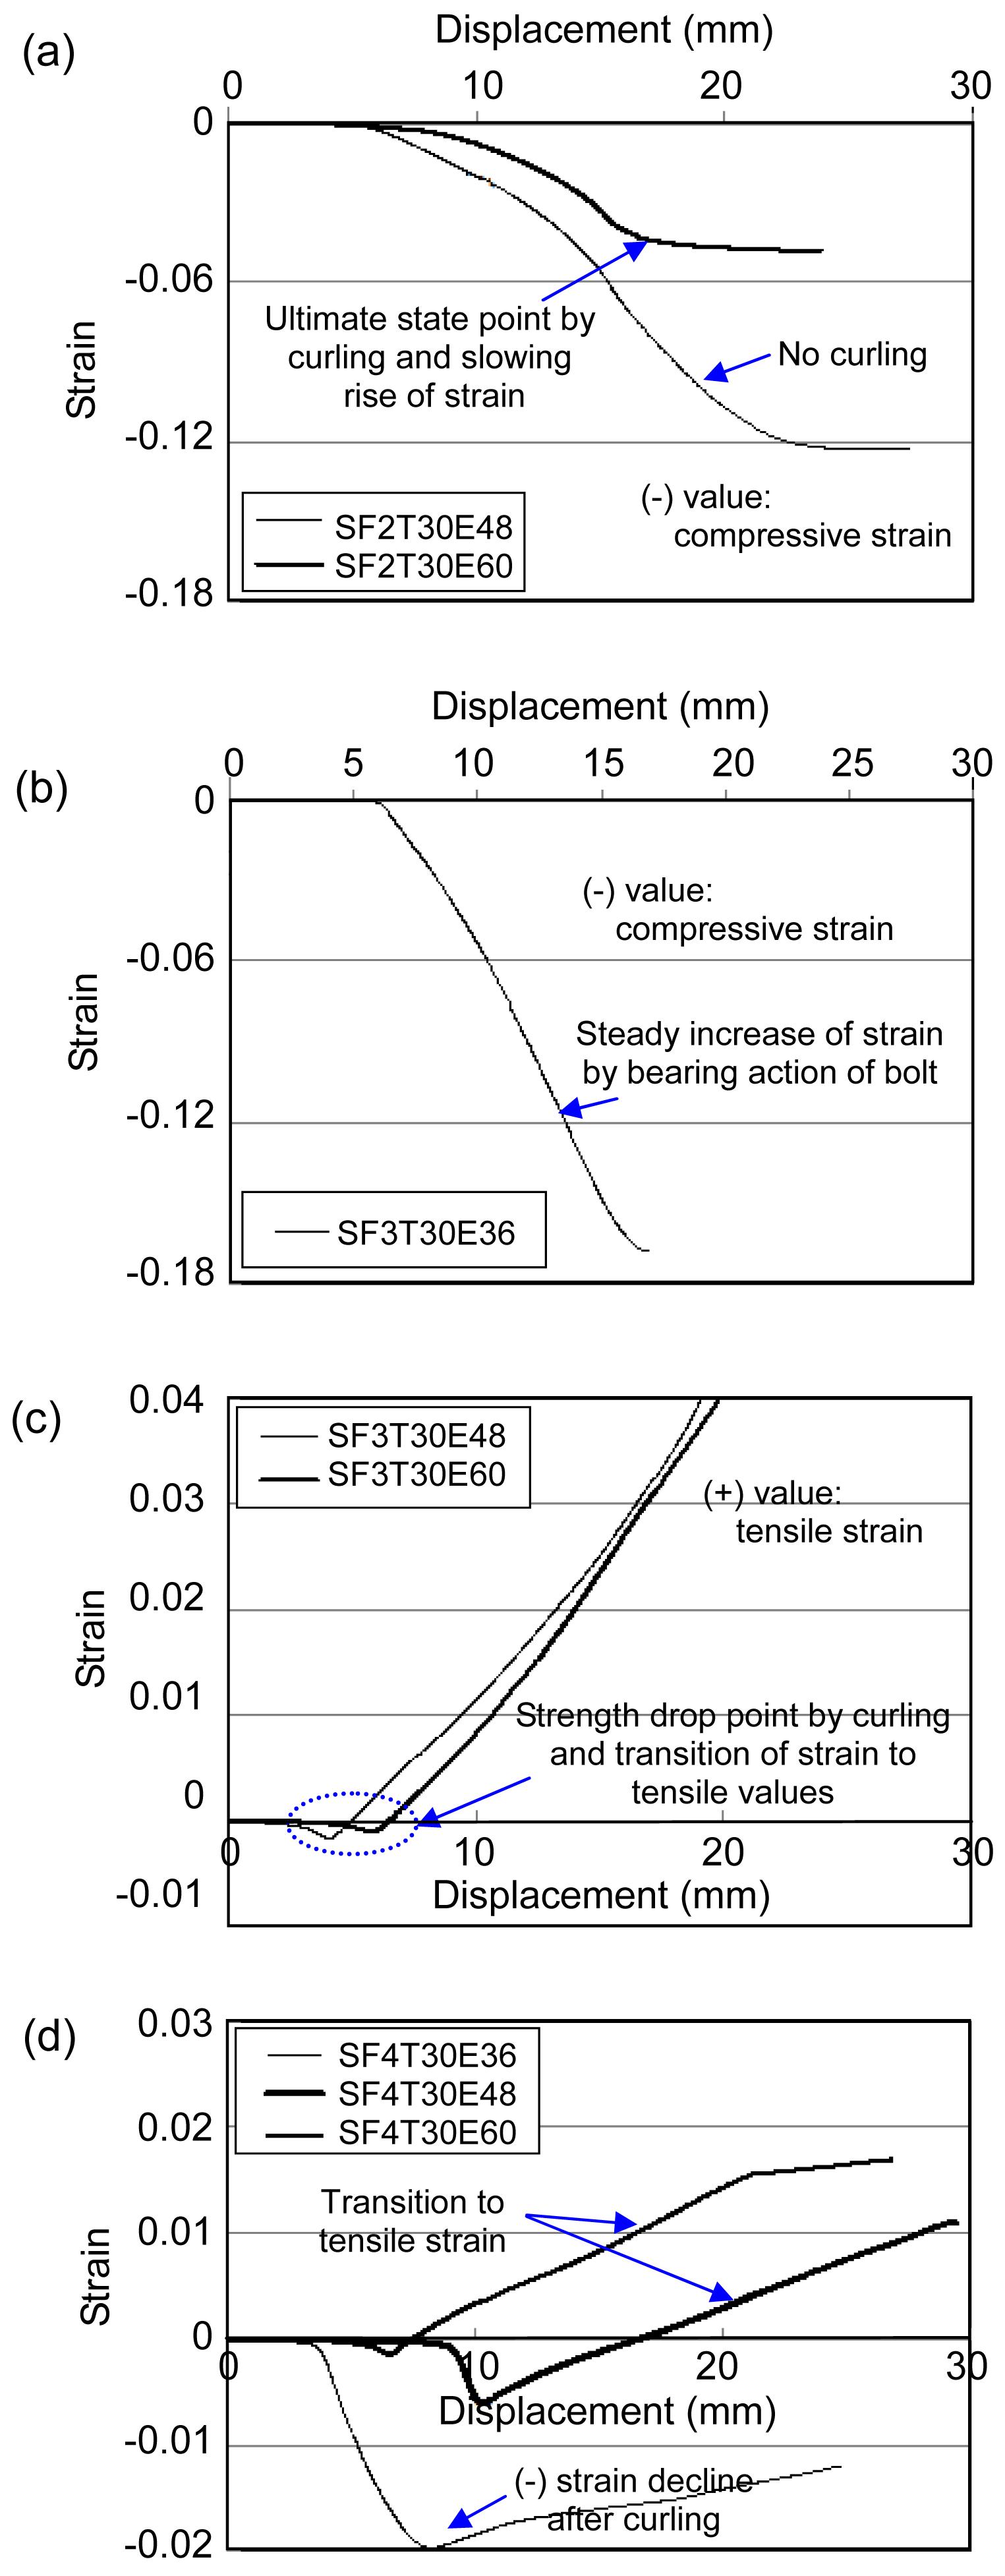
Fig. 8 presents the curling-displacement relationship for some representative specimens. At the initial stage of displacement, curling deformation climbed slightly up to the ultimate state. Specimens, SF3T30E48, SF3T30E60, SF4T30E48, and SF4T30E60 showed a sharp increase in the curling deformation after curling caused a sudden strength drop. Shear fracture in SF3 series or tensile fracture in SF4 series also led to the acceleration of curling development. For example, for SF3T30E48, there was a temporary strength reduction in load-displacement curve at the displacement of 4.15 mm as shown in the bold dotted of Fig. 6c and then curling deformation corresponding to the above displacement also increased significantly as shown in the thin sold line of Fig. 8a. Strain distribution obtained from G1 is shown in Fig. 9. Since plate part on which strain gauge was placed is under compressive pressure due to bearing action of bolt. Strain value measured in G1 is expected to be compressive. Therefore, for specimens SF2T30E48 and SF3T30E36 without curling, compressive strain value tended to increase with the increase of enforced displacement as shown in Figs. 9a and 9b. However, specimens with strength reduction effect by curling such as SF2T30E48, SF3T30E48, SF3T30E60, SF4T30E36, SF4T30E48 and SF4T30E60 presented different patterns in strain change. For example, SF2T30E48 and SF4T30E36 had been relatively less affected by curling compared to the others. At an early displacement, compressive strain value also continued to rise as that of uncurled specimens. However, after strength drop point by curling, the increase of strain value was slowed down for SF2T30E48 or the compressive strain has been falling down for SF4T30E36. For SF3T30E48, SF3T30E60, SF4T30E48 and SF4T30E60, the occurrence of severe curling had much impact on the ultimate strength reduction, and it also led to the transfer of strain distribution from compressive values to tensile ones as shown in Figs. 9c and 9d.
Fig.8 Curling-displacement curves for curled specimens (a) SF4 series; (b) SF3 series
Fig.9 Strain distribution of specimens in gage 1 (G1 in Fig. 3) (a) SF2 series; (b) SF3 series (no curling); (c) SF3 series (curling); (d) SF4 series (curling)
4. Comparison of test result and design strength prediction
4.1. Design standards
The ultimate strength of bolted connection under shear is determined by one of four fracture modes as follows: net-section tensile fracture (N), shear-out fracture (tear-out fracture or end-opening fracture, E), bearing fracture (BE) and block shear fracture (BS). Thus, this study summarizes the current design standards of ultimate strength regarding fracture modes. In particular, SEI/ASCE-8-02 (2002), AS/NZS4673 (2001) and EN 1993-1-4 (2006) provide the specifications or provisions for the design of cold-formed stainless steel members and specify the design strength for only three fracture modes such as tensile fracture, shear fracture and bearing fracture except the block shear fracture. Furthermore, AISI (2007) for cold-formed steel and AISC (2005) and AIJ (2002a) for hot-rolled steel specify design strength equations for the above stated four fracture modes.
The design strength equations for three fracture modes such as shear-out fracture, bearing fracture and block shear fracture are described in the following sections. Since the net-section tensile fracture mode was not observed in the test results, tensile strength equations were not mentioned in this study.
4.1.1. Shear-out fracture (end-opening fracture) and bearing fracture
According to the design standards, shear fracture and bearing fracture strengths are either expressed in single equations or separate equations. Especially, shear-out capacity per bolt depends on the length of two parallel lines that extend from the bolt hole to end part in the direction of force.
Shear-out strength per bolt specified in SEI/ASCE-8-02 (2002) and AISI S100-07 (2007) is given by
,
where e1 is the distance measured in line of force from the center of standard hole to the nearest edge of adjacent hole or to the end of connected part.
AISC (2005) defines design strength with one combined equation for shear fracture and bearing fracture divided into two types according to the acceptability of bolt hole ovalization. These equations are applied to bolts in a connection with standard, oversized and short-slotted holes.
When deformation at bolt hole at service load is a design consideration,
;
When deformation at bolt hole at service load is not a design consideration,
,
where Lc is the clear distance in the direction of the force between the edge of the hole and the edge of the adjacent hole or the edge of the plate, and φ=d+1.0.
AIJ (2002a; 2002b) specify only three fracture modes such as the net-section fracture, the shear fracture and the block shear fracture, and do not include the equation of bearing fracture strength. Shear out fracture strength (Pu) for hot-rolled steel bolted connections is expressed as
,
and for connections with single-row bolt in the perpendicular direction of loading, e1 can be ; for connection with more than double -row bolt, e1 can be . Eq. (4) denotes that if the end distance (e) exceeds 13 times the thickness of connected plate, the maximum of end distance can be regarded as 13t for estimating the shear-out strength, namely e>13t, although the fracture strength keeps a constant value regardless of the increase of the end distance. Note that Eq. (4) of AIJ (2002b) includes both definitions for the shear fracture and the bearing fracture: for e≤13t, bolted connection fails by shear fracture; and for e>13t, bearing failure is assumed to occur.
SEI/ASCE-8-02 (2002) classifies bearing strength into two equations according to the number of shear plane:
,
where Fp is the bearing stress for bolts with washers under both bolt head and nut, and can be expressed by
(a) For single-shear connection:
;
(b) For double-shear connection:
.
The latest AISI S100-07 (2007) presents bearing capacity based on serviceability limit state as follows:
(a) When deformation around bolt holes is not a design consideration:
;
(b) When deformation around bolt holes is a design consideration:
,
where C=a is the bearing factor (d/t<10, C=3.0), and α is the coefficient for conversion of units (for SI units with t in mm, α=0.0394). mf is a modification factor according to the type of bearing connection (single-shear and outside sheets of double-shear connection with washers under both bolt head and nut, mf=1.00).
Lastly, the design bearing resistance of carbon steel connections in EN 1993-1-4 (2006) except partial safety factor is given by
,
where αb is the smallest out of αd, Fub/Fu (where Fub is the tensile stresses of bolt material), or 1.0. In the direction of load transfer, αd=e/(3d) for end bolts and p/(3d)−1/4 for inner bolts. In the direction perpendicular to load transfer, k1 is the smaller of 2.8b/d−1.7 or 2.5 for edge bolts, and 1.4g/d−1.7 or 2.5 for inner bolts.
4.1.2. Block shear fracture (BS)
The block shear fracture specified in AISI S100-07 (2007), AISC (2005), EN 1993-1-4 (2006) and AIJ (2002a; 2002b) is a combination of net-section fracture and shear out fracture. The block shear fracture specified in (AISC, 2005) is a combination of net tensile section fracture and shear out fracture or yielding. AISC specification presents two possible block shear equations. Nominal block shear fracture strength is determined as the smaller value in the following Eqs. (11) and (12). Eq. (11) indicates tensile rupture () on the net-section between two bolts perpendicular to the force followed by shear yielding () on the gross shear plane. Eq. (12) indicates shear rupture along the net shear area () followed by rupture on the net tensile area ():
, ,
where Ant is the net area subjected to tension, Line 1; Agt is the gross area subjected to tension, Line 2; Anv is the net area subjected to shear, Line 3; and Agv is the gross area subjected to shear, Line 4 as depicted in Fig. 10. Reduction factor (Ubs) has been included in the equations to consider the non-uniform stress distribution on the tensile plane; when tension stress is uniform, is 1.0.
Fig.10 Fracture and yielding section line of typical block shear
AISI S100-07 (2007) also specifies the same equations as AISC specification of Eqs. (11) and (12).
The design block shear resistance of stainless steel connections in EN 1993-1-4 (2006) except partial safety factor is given by
.
The block shear fracture by AIJ is a combination of net-section fracture and shear out fracture. The effective shear stress values in shear-out fracture against tensile strength (Fu) are applied to be 0.5 as shown in Eq. (14).
4.2. Comparisons of ultimate strength between test results and design prediction
Ultimate strengths of test results are compared with the design strengths calculated by the strength equations of the subsection 4.1. Geometry of connected plate in Table 1 and material properties (Fy, Fu) in Table 2 are used. Table 5 shows the ultimate strengths (Pue) of test results and the design ultimate strengths (Put) predicted by the above-stated AISC (2005), AIJ (2002a; 2002b), AISI S100-07 (2007), SEI/ASCE-8-02 (2002) and EN 1993-1-4 (2006) standards, respectively. The ultimate strengths (Put) of design standards in Table 5 were determined by the design strength of fracture mode which corresponds to the fracture mode of test result in each specimen and this study did not consider whether fracture modes predicted by design standards agree with those of test results or not. Ultimate strengths predicted by AISC S100-07 (2007), AIJ (2002a; 2002b) and EN 1993-1-4 (2006) standards for the specimens of SF1 series and SF3 series can be regarded as the minimum strength out of shear fracture (E) and bearing fracture (BE). AISC equations of block shear fracture strength contains the reduction factor (Ubs) and on condition that tension stress is uniform for the tensile cross section of the connections, in which reduction factor (Ubs) is assumed to be unity (=1.0). Accordingly, the block shear strength equations coincide with those of AISI S100-07 (2007). The equation number with the smaller block shear strength among Eqs. (11) and (12) was expressed in Table 5 in order to understand the block shear fracture path where the ultimate strength is determined. Most of the specimens with block shear fracture mode in test results except SF4T30E24 were predicted to fail by tensile rupture (Line 1 in Fig. 10) on the net-section between two bolts perpendicular to the applied force followed by the shear yielding (Line 4 in Fig. 10) on the gross shear plane parallel to the force. Since SEI/ASCE-8-02 (2002) standard does not provide a separate provision related to block shear strength of bolted connection, ultimate strength by design standard was left blank in Table 5. Design ultimate strength was calculated on condition that first, deformation at bolt hole at service load is not a design consideration; second, washers are provided under both the bolt head and the nut; third, all specimens are single-shear bolted connection.
Table 5
Ultimate strength by design standards for same fracture mode with test results
Table 6 shows the comparative data of ultimate strength between design prediction (Pue) and test result (Pue), and strength ratio (Put/Pue) and mean value with the corresponding coefficient of variation (COV).
Table 6
Ultimate strength comparisons of test result and design standard prediction
For bolted connections of SF1T30 series (SF1T30E24 and SF1T30E30) with a relatively short end distance, shear fracture strength predicted by AISC (2005), AIJ (2002a) and EN 1993-1-4 (2006) standards increased with the increase of end distance. However, for specimens with end distance of more than 36 mm for AISC (2005) and EN 1993-1-4 (2006) and more than 48 mm for AIJ (2002a), the shear fracture strength kept constant regardless of the increase of end distance as shown in Table 5. That is why the strength of the specimens is governed by the bearing capacity of plate for the end distance condition specified in Eqs. (3), (4) and (10). On the contrary, shear strengths of single bolted connections by AISI S100-07 (2007) and SEI/ASCE-8-02 (2002) increased as end distance increased. Therefore, it can be known that ultimate strength prediction by these standards came closer to the ultimate strengths of test results.
4.2.2. SF2 series (1×2 bolt array)
Most of specimens except SF2T30E60 with curling failed by a typical block shear fracture at the end stage of test and the curling of SF2T30E60 also had little impact on strength reduction as stated in the subsection 3.2. Block shear strength equations are equal in AISC (2005) and AISI S100-07 (2007) (Eq. (11)), and the block shear consists tensile rupture on the net-section and shear yielding on the gross shear section. AIJ (2002a) specifies block shear strength with a combination of tensile fracture of net-section and shear fracture of gross section. Average strength ratios (Put/Pue) by AISC (2005), AIJ (2002a) and EN 1993-1-4 (2006) were 0.77, 0.86 and 0.68, respectively. AIJ (2002a) recommendation provided a good prediction accuracy of ultimate strength compared to those of AISC (2005), AISI S100-07 (2007) and EN 1993-1-4 (2006).
4.2.3. SF3 series (2×1 bolt array)
Ultimate strength of shear out fracture by current design standards for bolted connection with double-row bolts in the parallel direction of applied force is determined by the minimum of pitch (p) and end distance (e). The shear fracture path is assumed by single line as given in Eqs. (1), (3) and (4). The limitation provisions of end distance (e) considering bearing behaviors are included in Eqs. (3), (4) and (10). Therefore, although the end distance continues to get longer, the strength of shear out fracture did not increase anymore on the condition of Eqs. (3), (4) and (10). For example, the maximum clear distance (Lc) in Eq. (3) can not exceed 2.0 times bolt diameter (2.0d), and effective end distance in Eq. (4) is assumed to be the minimum value out of e, 13t and p. Generally, current standards slightly underestimate the shear out strength of specimens.
4.2.4. SF4 series (2×2 bolt array)
Ultimate strength ratio (Put/Pue) of AISC (2005) and AISI S100-07 (2007) standards to test results ranged from 0.81 to 0.83 for specimens SF4T30E24, SF4T30E30 and SF4T30E36 which were little affected by curling and it can be found that the above standards are somewhat conservative in predicting the block shear strength. EN 1993-1-4 (2006) underestimated the block shear strength (Put/Pue ranged from 0.62 to 0.84). Predictions by AIJ (2002a) recommen-dation showed a good correspondence to that of the test results with the strength ratio in the range of 0.92 to 0.96 as given in Table 6. However, for specimens SF4T30E48 and SF4T30E60 with severe curling, since current AIJ standard does not take into enough consideration about the strength drop caused by curling, AIJ prediction showed a tendency to overestimate the block shear strength (Put/Pue=1.09–1.20). Accordingly, a modification of the current design equations considering the strength reduction due to curling is necessary, which will be discussed in the following sections.
4.3. Suggestion of strength equation and its verification
As mentioned in the subsection 3.1, the representative fracture modes of SF1 and SF3 series were shear out fracture. The shear fracture path was observed along two lines of gross shear section as shown in Figs. 3a and 3c. However, current design standards seemed to assume a single line as shear out fracture path. In other words, since there was a discrepancy in fracture path between test result and design prediction, ultimate strengths predicted by the current design standards were smaller than those of test results. Therefore, it is necessary to revise the current shear fracture strength equation in order to consider the bearing behavior of plate and curling effect and estimate the shear strength of the same fracture path as the test result. This study proposed the modified equation (Eq. (15)) for shear out strength using the von Mises yield criterion, which defines that in the case of simple tension the magnitude of the shear yield stress in pure shear is times the tensile yield stress. Table 7 indicates that strength prediction accuracy by Eq. (15) is improved compared to those by current design equations.
Table 7
Comparison of shear fracture strengths between test results and suggested design Eq. (15)
Specimen
Put (kN)
Pue (kN)
Put/Pue
SF1T30E24
36.19
40.47
0.89
SF1T30E30
45.24
52.53
0.86
SF1T30E36
54.29
64.58
0.84
SF1T30E48
72.38
78.69
0.92
SF1T30E60
90.48
90.16
1.00
SF3T30E24
72.38
78.89
0.92
SF3T30E30
90.48
90.36
1.00
SF3T30E36
108.58
101.33
1.07
SF3T30E48
108.58
98.78
1.10
SF3T30E60
108.58
107.51
1.01
Avg
0.96
COV
0.091
For bolted connections of SF2 and SF4 series with typical block shear fracture mode and no curling, current design standards tended to underestimate ultimate strengths as shown in Table 6. In fact, block shear fracture path observed from test results is identical to a combination of tensile rupture (FuAnt) on the net-section between two bolts and shear fracture on the gross shear plane (Line 1 and Line 4 in Fig. 10). The von Mises yield theory was also applied to the shear fracture, and Eq. (16) was suggested for block shear fracture strength of bolted connections with two columned bolt arrays. The ultimate strengths by Eq. (16) of SF2 series and SF4 series without curling effect showed a good correspondence to the test results as shown in Table 8.
Table 8
Comparison of block shear fracture strengths between test results and suggested design Eq. (16) for specimens with little strength reduction effect by curling
Specimen
Put (kN)
Pue (kN)
Put/Pue
SF2T30E24
66.23
72.91
0.91
SF2T30E30
75.28
83.59
0.90
SF2T30E36
84.33
89.38
0.94
SF2T30E48
102.42
106.13
0.97
SF2T30E60
120.52
123.38
0.98
SF4T30E24
120.52
115.84
1.04
SF4T30E30
129.57
125.83
1.03
SF4T30E36
138.61
129.36
1.07
Avg
0.98
COV
0.064
Whereas, for specimens (SF4T30E48 and SF4T30E60) with severe curling, since Eq. (16) has considered the strength reduction caused by the curling, the block shear strength was overestimated as shown in Table 9. Therefore, the von Mises yield criterion and the concept of bearing action were introduced in Eq. (16), and modified equations such as Eq. (17) were suggested.
Table 9
Comparison of block shear fracture strengths between test results and suggested design Eq. (17) for specimens with strength reduction effect by curling
Specimen
Put(16) (kN)
Put(17) (kN)
Pue (kN)
Strength ratio
Put(16)/Pue
Put(17)/Pue
SF4T30E48
156.71
138.61
127.79
1.23
1.08
SF4T30E60
174.81
138.61
130.73
1.34
1.06
(a) For connections without curling:
Shear out fracture (1×1 and 2×1 bolt arrangements),
;
Block shear fracture (1×2 and 2×2 bolt arrangements),
.
(b) For connections with block shear and curling (2×2 bolt arrangement),
Tables 7–9 represent the comparison of shear out strength and block shear strength between test results (Pue) and suggested design equation (Putp). Average strength ratio (Putp/Pue) of the shear fracture for SF1 and SF3 series with the single column array of bolt was 0.96 in Table 7. For the specimens of SF2 and SF4 series with no curling and little strength reduction effect by curling, prediction accuracy for block shear strength has improved somewhat. The mean value of strength ratio and the corresponding COV was 0.98 and 0.064, respectively (Table 8).
Lastly, block shear strengths of suggested equation (Eq. (17)) with limitation of end distance for two specimens with severe curling could be close to those of test results as shown in Table 9 (Put(Eq.(17))/Pue=1.06–1.08).
5. Conclusions
An experimental study for single shear bolted connections with thin-walled ferritic stainless steel (plate thickness, 3.0 mm, bolt diameter, 12 mm, gage & pitch: 36 mm, edge distance perpendicular to the direction of applied force, 60 mm) has been performed in order to investigate the structural behaviors such as the ultimate strength, the fracture mode and the curling effect. End distance parallel to the direction of applied load (24–60 mm) and bolt arrangements (4 types) were chosen as main variables of the specimens.
Bolted connections (SF1 series: 1×1 and SF2 series: 2×1) with single column in a bolt array failed by shear out fracture. Specimens of SF2 series with more than end distance of 48 mm showed the transient strength drop due to curling. SF2 series (1×2) and SF4 series (2×2) which are fastened by bolts of double columns showed block shear fracture at the end of test and curling occurred in some specimens with a long end distance. In particular, for the bolted connections of SF4 series with 48 mm and 60 mm of end distances, curling occurrence led to the strength reduction and it decided the ultimate state of the specimens. Curling deformation continued to increase according to the increase of end distance. Besides, strain distribution taken from strain gauge attached in the plate in front of bolts was changed into tensile strain values from compressive ones after the strength reduction by curling occurred.
The ultimate strength obtained from test results were compared with those predicted by the current design standards such as AISC (2005), AIJ (2002a; 2002b), AISI S100-07 (2007), SEI/ASCE-8-02 (2002) and EN 1993-1-4 (2006). It is concluded that the current standards underestimated the ultimate strength of ferritic stainless single shear bolted connections except some curled specimens of SF4 series with a long end distance, which were overestimated by existing codes. The shear fracture path (two lines of fracture section) of test results differed from that (singe line of fracture section) predicted by current standards. However, since the current standards did not consider exactly the shear fracture path shown in the test results and did not reflect sufficiently the strength reduction effect caused by the curling, modified strength equations (Eqs. (15)‒(17)) were suggested considering the same shear fracture path of two lines as the test results and using the von Mises yield criterion and bearing action of a plate in this paper. Consequently, ultimate strength by the revised equations had a good correspondence to that of test results with an improved accuracy.
Acknowledgements
The authors are thankful to Mr. Ha-young JEONG and Mr. Min-seong KIM for their assistance with this research project.
[1] AISI (American Iron and Steel Institute), 1968. Specification for the Design of Light Gage Cold-Formed Stainless Steel Structural Members. AISI,USA :
[2] AISI (American Iron and Steel Institute), 1974. Stainless Steel Cold-Formed Structural Design Manual. AISI,USA :
[3] AISI S100-07, 2007. North American Specification for the Design of Cold-Formed Steel Structural Members. American Iron and Steel Institute (AISI),Washington DC, USA :
[4] AISC (American Institute of Steel Construction), 2005. Specification for Structural Steel Buildings. AISC,USA :
[5] AIJ (Architectural Institute of Japan), 2002. Recommendation for Limit State Design of Steel Structures. AIJ,Tokyo, Japan :
[6] AIJ (Architectural Institute of Japan), 2002. Recommendation for the Design and Fabrication of Light Weight Steel Structures. AIJ,Tokyo, Japan :
[7] AS/NZS 4673, 2001. Cold-Formed Stainless Steel Structures. Australian Standard/New Zealand Standard (AS/NZS),Australia :
[8] ASTM A370-10, 2010. Standard Test Methods and Definitions for Mechanical Testing of Steel Products. American Society for Testing and Materials (ASTM),USA :
[9] EN 1993-1-4, 2006. Eurocode 3: Design of Steel Structures–Part 1.4: General Rules–Supplementary Rules for Stainless Steel. , European Committee for Standardization (CEN),:
[10] JIS G 4321, 2010. Stainless Steel for Building Structure. Japan Industrial Standards (JIS),Tokyo, Japan :
[11] JIS Z 2241, 2010. Method of Tensile Test for Metallic Materials. Japan Industrial Standards (JIS),Tokyo, Japan :
[12] Johnson, A.L., Winter, G., 1966. Behavior of stainless steel columns and beams. Journal of Structure Division, 92(10):97-118.
[13] Kim, T.S., Kuwamura, H., 2007. Finite element modeling of bolted connections in thin-walled stainless steel plates under static shear. Thin-Walled Structures, 45(4):407-421.
[14] Kim, T.S., Kuwamura, H., Cho, T.J., 2008. A parametric study on ultimate strength of single shear bolted connections with curling. Thin-Walled Structures, 46(1):38-53.
[15] Kim, T.S., Kuwamura, H., Kim, S.H., Lee, Y.T., Cho, T.J., 2009. Investigation on ultimate strength of thin-walled steel single shear bolted connections with two bolts using finite element analysis. Thin-Walled Structures, 47(11):1191-1202.
[16] Kuwamura, H., 2001. Experimental Report on Strength of Bolted Connections in Thin-Walled Plates. Steel Structure Laboratory,the University of Tokyo, Tokyo, Japan :
[17] Kuwamura, H., Isozaki, A., 2002. Ultimate behavior of fastener connections of thin stainless steel plates. Journal of Structural and Construction Engineering (Transactions of Architectural Institute of Japan), (in Japanese),556:159-166.
[18] Nethercot, D.A., Salih, E.L., Gardner, L., 2011. Behaviour and design of stainless steel bolted connections. Advances in Structural Engineering, 14(4):51-62.
[19] Salih, E.L., Gardner, L., Nethercot, D.A., 2010. Numerical investigation of net section failure in stainless steel bolted connections. Journal of Constructional Steel Research, 66(12):1455-1466.
[21] SEI/ASCE-8-02, 2002. Specification for the Design of Cold-Formed Stainless Steel Structural Members. American Society of Civil Engineers (ASCE),USA :
[22] SSBA (Stainless Steel Building Association of Japan), 2006. Design Manual of Light-Weight Stainless Steel Structures. SSBA,Tokyo, Japan :
Open peer comments: Debate/Discuss/Question/Opinion


Open peer comments: Debate/Discuss/Question/Opinion
<1>