Jun-yi Liang, Jian-long Zhang, Xi Zhang, Shi-fei Yuan, Cheng-liang Yin. Energy management strategy for a parallel hybrid electric vehicle equipped with a battery/ultra-capacitor hybrid energy storage system[J]. Journal of Zhejiang University Science A, 2013, 14(8): 535-553.
@article{title="Energy management strategy for a parallel hybrid electric vehicle equipped with a battery/ultra-capacitor hybrid energy storage system", author="Jun-yi Liang, Jian-long Zhang, Xi Zhang, Shi-fei Yuan, Cheng-liang Yin", journal="Journal of Zhejiang University Science A", volume="14", number="8", pages="535-553", year="2013", publisher="Zhejiang University Press & Springer", doi="10.1631/jzus.A1300068" }
%0 Journal Article %T Energy management strategy for a parallel hybrid electric vehicle equipped with a battery/ultra-capacitor hybrid energy storage system %A Jun-yi Liang %A Jian-long Zhang %A Xi Zhang %A Shi-fei Yuan %A Cheng-liang Yin %J Journal of Zhejiang University SCIENCE A %V 14 %N 8 %P 535-553 %@ 1673-565X %D 2013 %I Zhejiang University Press & Springer %DOI 10.1631/jzus.A1300068
TY - JOUR T1 - Energy management strategy for a parallel hybrid electric vehicle equipped with a battery/ultra-capacitor hybrid energy storage system A1 - Jun-yi Liang A1 - Jian-long Zhang A1 - Xi Zhang A1 - Shi-fei Yuan A1 - Cheng-liang Yin J0 - Journal of Zhejiang University Science A VL - 14 IS - 8 SP - 535 EP - 553 %@ 1673-565X Y1 - 2013 PB - Zhejiang University Press & Springer ER - DOI - 10.1631/jzus.A1300068
Abstract: To solve the low power density issue of hybrid electric vehicular batteries, a combination of batteries and ultra-capacitors (UCs) could be a solution. The high power density feature of UCs can improve the performance of battery/UC hybrid energy storage systems (HESSs). This paper presents a parallel hybrid electric vehicle (HEV) equipped with an internal combustion engine and an HESS. An advanced energy management strategy (EMS), mainly based on fuzzy logic, is proposed to improve the fuel economy of the HEV and the endurance of the HESS. The EMS is capable of determining the ideal distribution of output power among the internal combustion engine, battery, and UC according to the propelling power or regenerative braking power of the vehicle. To validate the effectiveness of the EMS, numerical simulation and experimental validations are carried out. The results indicate that EMS can effectively control the power sources to work within their respective efficient areas. The battery load can be mitigated and prolonged battery life can be expected. The electrical energy consumption in the HESS is reduced by 3.91% compared with that in the battery only system. Fuel consumption of the HEV is reduced by 24.3% compared with that of the same class conventional vehicles under Economic Commission of Europe driving cycle.
Darkslateblue:Affiliate; Royal Blue:Author; Turquoise:Article
Article Content
1. Introduction
The large number of automobiles used around the world has produced and continues to cause serious environmental and human survival problems. Dealing with the air pollution, global warming, and rapidly diminishing oil resources has become the primary concern of modern people. The next-generation vehicles have been developed, which are more efficient, cleaner, and safer. Pure electric, hybrid electric (HEV), and fuel cell (FC) vehicles have been proposed as representatives of future vehicles for the replacement of conventional vehicles (Ehsani et al., 2009).
Although pure electric and FC vehicles are more environmentally friendly (Chan, 2002), they both face technical difficulties and require a large number of infrastructure improvements (Tanoue et al., 2008). Thus, these vehicle types are not likely to be widely used in the short term. By contrast, HEVs have recently captured widespread attention because of their relatively similar technologies to conventional vehicles and good adaptability to existing infrastructures (Xiong et al., 2009a).
An HEV’s power train consists of different components, such as the internal combustion engine (ICE) and electric motor (EM). Thus, an energy storage system (ESS) is needed in HEV to satisfy the electric power requirement of the EM. In practice, different kinds of batteries have been selected as the normal ESS (Jung et al., 2002; Karden et al., 2007; Vasebi et al., 2007). However, their relatively low power density hinders batteries from performing well to meet the high electric power requirements of HEVs in some modes, such as pure electric acceleration and regenerative braking.
The features of some energy storage components are shown in Table 1 (Wu et al., 2012). Compared with batteries, ultra-capacitors (UCs) have low energy density but high power density. The specific features of UC enable energy to be stored and released without chemical reaction, thus the energy can be absorbed and released immediately with low losses. Therefore, UC is capable of meeting the instantaneous high power demand of EM. According to different features of batteries and UCs, a battery/UC-based hybrid ESS (HESS) can be constructed. In HESS, the battery only needs to meet the average power requirement of the electric power system during HEV driving, whereas the UC is employed to make up for the fluctuations in electrical power demand. The combination of the two electrical sources can mitigate battery workload, which will improve battery working efficiency and extend battery life expectancy. Moreover, the high power density of UCs makes HESS more effective in absorbing regenerated power during vehicle braking. Notably, the efficiency of HESS also depends on other factors, such as power interface efficiency and the regenerative ratio. However, UC energy efficiency is significantly higher than that of the battery, and power interface efficiency normally has a high value. We can thus employ HESS to obtain better energy efficiency than traditional ESS.
Table 1
Features of different energy storage components (Wu et al., 2012)
Type
Energy density (Wh/kg)
Power density (W/kg)
Lead acid
40
100
Nickel-metal hydride
80
700
Li-ion
150
900
Ultra-capacitor
5.6
11000
This paper emphasizes the EMS design for a parallel HEV equipped with HESS. The EMS for different schemes of HEVs equipped with HESS has recently been explored. Several methods, such as logic threshold, fuzzy logic, and a low-pass filter method, have been applied in this area. Three strategies are studied for the distribution of power between batteries and UCs, and the “filtration strategy” can maintain the current stresses significantly lower than that of the other two strategies (Allegre et al., 2009). A power-flow management for a Series HEV using HESS is proposed to satisfy the vehicle load demand and improve dynamic performance, but the fuel efficiency is not evaluated (Yoo et al., 2008). A fuzzy logic control strategy has been employed in an FC/UC hybrid vehicle, and the strategy is capable of determining the desired FC power and can maintain the DC voltage around the nominal value (Kisacikoglu et al., 2009). Nevertheless, an EMS that could satisfy the complexity of combination of ICE and HESS has not been well addressed in previous study.
HEVs are highly nonlinear systems, and drive loads and driving conditions cannot be explicitly predicted and described. Thus, intelligent controllers have been widely used in HEV control. Previous studies demonstrate that fuzzy logic control could be successfully applied to the design of the HEV control strategy (Baumann et al., 1998; Schouten et al., 2003; Jeong et al., 2005; Won and Langari, 2005; Langari and Won, 2005; Xiong et al., 2009b; Abdelsalam and Cui, 2012).
As regards the complex energy management requirements demanded by HEVs, the fuzzy logic, an inherent solution for complicity problems, is employed. Moreover, other control methods such as logic threshold and low-pass filter are also included for control performance enhancement. The proposed EMS, consisting of six modules, is developed and verified under a Matlab/Simulink environment. These modules, called required torque calculation (RTC), mode switcher (MS), pure electric mode (PEM), parallel mode (PM), braking mode (BM), and electrical power redistribution (EPR), are used to determine the operation mode and to distribute energy at each mode.
2. System architecture
The developed HEV is primarily aimed at the mid- and low-end vehicle markets. Considering the target markets and potential consumers, this HEV has special features compared with other commercially available HEVs. Firstly, this HEV has a small size and light weight and can thus achieve low fuel consumption, which is suitable for crowded urban areas. Secondly, it mainly operates in urban and suburban districts and rarely travels on the highway, such that the maximum velocity can be reduced. Finally, it is mainly used for commuting or driving in scenic areas, such that the driving distance is not long and acceleration demand is not high. As a result, a powerful power train need not be applied in this HEV. To meet the above requirements, the kinetic performance of the HEV is listed in Table 2.
Table 2
Kinetic performance of target HEV
Item
Value
Maximum velocity (km/h)
≤80
0–50 km/h acceleration time (s)
≤20
Grade-ability (%)
≥20
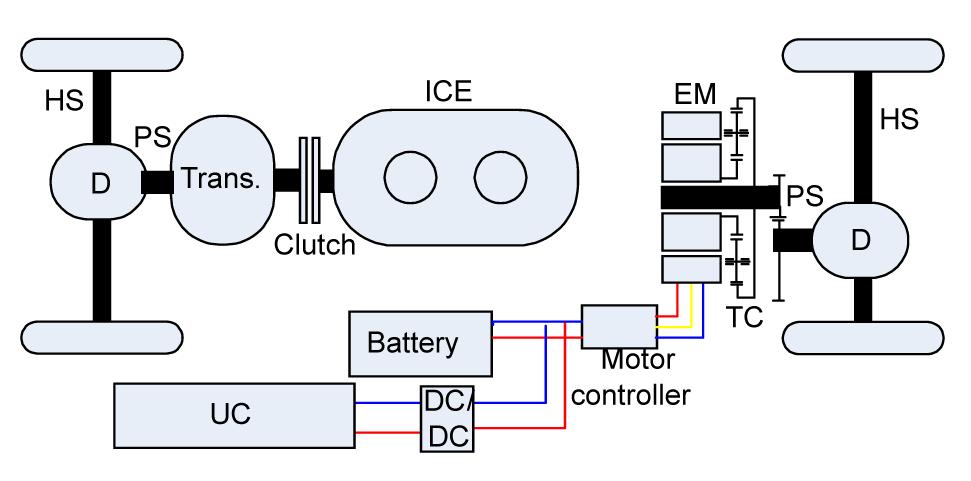
The HEV architecture is shown in Fig. 1. A two-cylinder ICE with small displacement replaced the original ICE and is connected with the automatic mechanical transmission. The output shaft of the transmission is linked to the propeller shaft (PS), differential (D), half shafts (HS), and two wheels. At the rear drive axle, the traction EM connects PS through a torque coupler (TC). The TC increases the EM speed with a gear ratio of 5.187 to ensure that the operating range of the EM can match the maximum speed and power requirements of the vehicle. In this architecture, the transfer case can be abolished with the independent engine-driven front axle and motor-driven rear axle. Meanwhile, an integrated starter generator (ISG) needs not be equipped in this architecture. Thus, this arrangement can not only simplify the structure and spatial arrangement but can also reduce the weight and cost. Moreover, the switch between two-wheel drive and four-wheel drive can be realized based on road and operational conditions. For this unique characteristic, this architecture shows a significant advantage in the context of driving on bad roads or in bad weather. The main specifications of this HEV are listed in Table 3.
Fig.1 Architecture of target HEV power train
Table 3
Main specification of target HEV
Item
Value
Curb/Gross weight (kg)
850/1150
Wheel base (m)
2.34
Tire rolling radius (m)
0.280
Frontal area (m2)
1.91
Minimum ground clearance (m)
0.13
Aerodynamic drag coefficient
0.34
Rolling resistance coefficient
0.009
The HESS in this scheme is composed of a battery pack, a UC pack, and a bi-directional DC/DC converter. The battery and UC packs have different voltage levels: the nominal operating voltage of the battery pack is 72.6 V, whereas the maximum voltage of the UC pack is 48.6 V. Therefore, a bi-directional DC/DC converter is used to connect the UC pack to the DC bus link, as shown in Fig. 1.
3. Energy conversion and vehicle models
3.1. Vehicle dynamic model
During vehicle driving, the traction force FTR and the load FLO drag the vehicle forward and backward. The vehicle load includes the aerodynamic drag force Fw, the rolling friction resistance Fr, and the gradient resistance Fg. The vehicle kinematical equations can be expressed as follows:
,
,
,
,
,
where ρ is the rotational inertia coefficient to compensate for the apparent increase in vehicle mass attributed to the onboard rotating mass, ρA is the air density, CA is the aerodynamic drag coefficient, Dw is the vehicle frontal area, ν is the vehicle speed, M is the vehicle mass, g is the gravitational acceleration constant, f is the tire rolling resistance coefficient, and σ is the road slope.
3.2. ICE model
The ICE on a conventional vehicle is generally sized for the peak power requirement, the occurrence of which composes only a fraction of the real driving cycle. The additional auxiliary drive component (EM in this scheme) in HEV makes the downsizing of ICE reasonable. In this HEV, A 0.25-L displacement two-cylinder ICE is selected. Compared with the original 1.4-L displacement ICE, the displacement of this ICE is significantly decreased. Under the Economic Commission of Europe (ECE) driving cycle conditions, the downsized ICE can work in its high efficiency area (Tomaž, 2007). The parameters of ICE are shown in Table 4.
Table 4
Two-cylinder ICE parameters
Item
Value
Idle/Maximum speed (r/min)
1400/8000
Maximum torque (N·m)
18.7/5500
Maximum power (kW)
12.7/7000
Displacement (L)
0.25
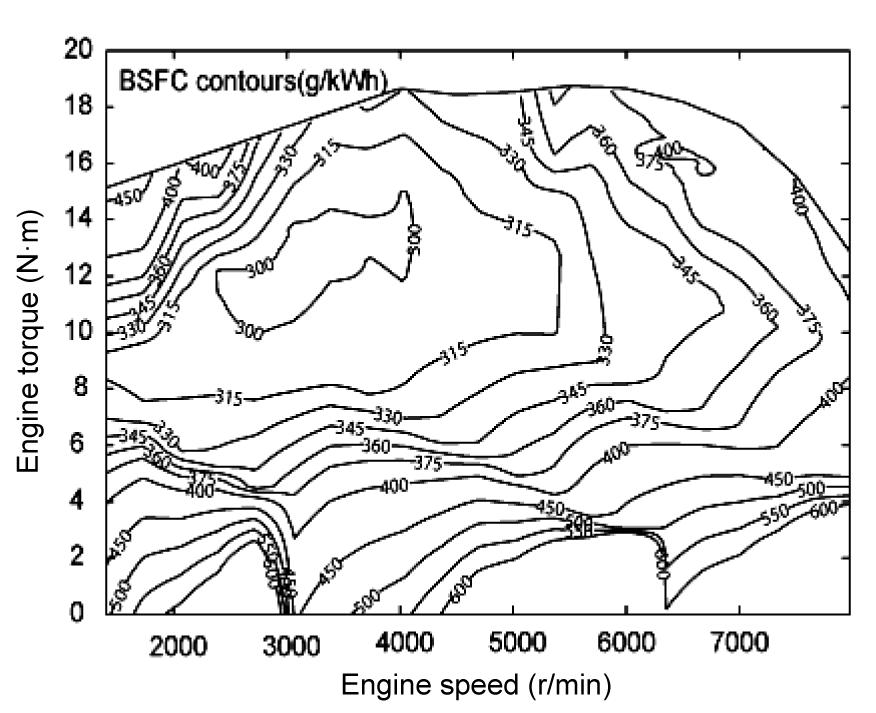
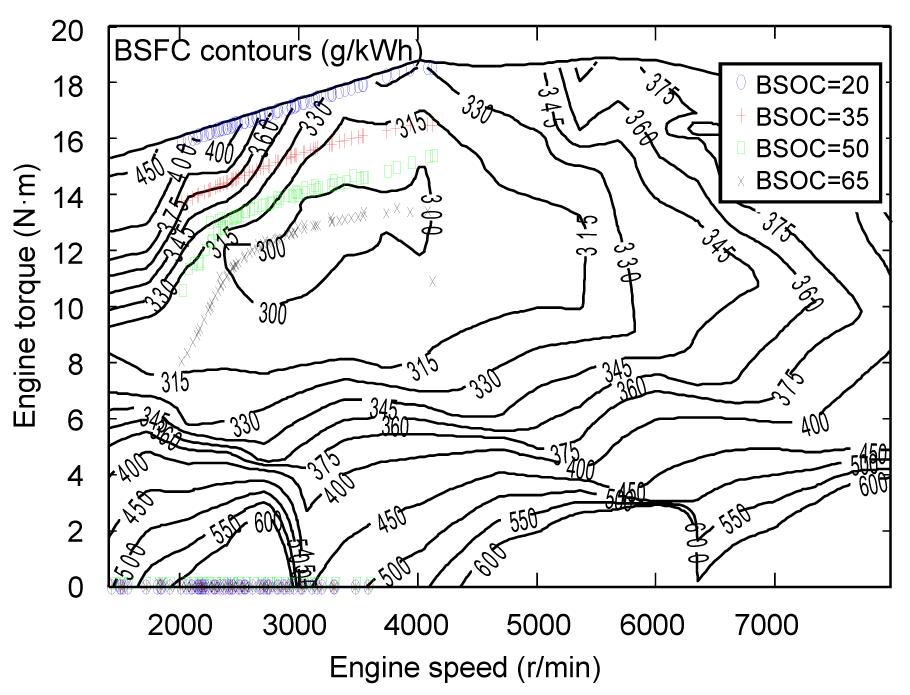
Based on previous studies, the quasi-static model is introduced to ICE (Rizzoni et al., 1999; van Mierlo et al., 2004). In this case, the ICE includes no transient dynamics and is modeled based on a look-up table. As shown in Fig. 2, fuel consumption is given in brake specific fuel consumption (BSFC).
,
,
where PICE is the output power from the ICE, TICE is the output torque of the ICE, ωICE is the rotational speed of the ICE’s output shaft, and is the fuel mass flow used by the ICE.
Fig.2 Fuel map contour of ICE (g/kWh)
3.3. EM model
The EM, which is integrated in the rear drive axle of the HEV, is a traction motor that can also generate electric power while the engine is operating or the vehicle is regenerate braking. Considering different characteristics of various kinds of motors (Trovao et al., 2008) and also the cost and availability in the market, we selected a permanent magnet brushless DC motor, with the nominal operating voltage of 72 V. The efficiencies of the EM are also derived from the quasi-static models (Rizzoni et al., 1999) as follows:
where ηEM is the efficiency of the EM, PH_EM is the power required from the HESS by the EM, TEM is the output torque of the EM, and ωEM is the rotational angular speed of the EM. The specifications of the EM are listed in Table 5. The efficiency map of the EM is given in Fig. 3.
Table 5
EM parameters
Item
Value
Peak power (kW)
14
Continuous power (kW)
7
Peak torque (N·m)
71.6
Continuous torque (N·m)
35.8
Basic speed (r/min)
1860
Maximum speed (r/min)
6000
Fig.3 Efficiency map of EM
3.4. HESS model
By combining the advantages of the battery and UC, HESS can achieve higher efficiency and meet the power requirement of the vehicle.
3.4.1. UC model
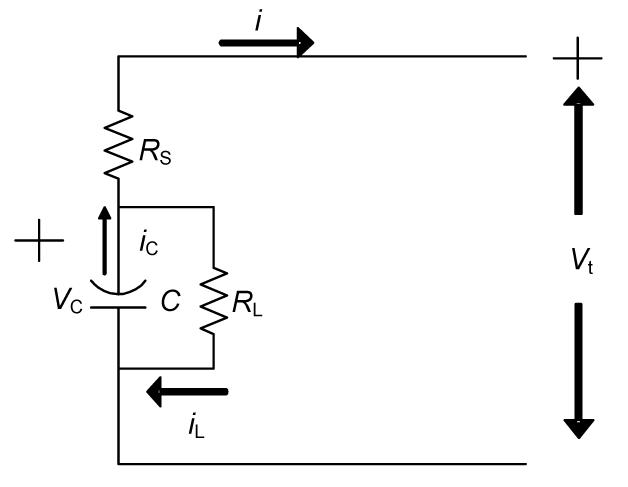
The basic UC model consists of a capacitor, an equivalent series resistance RS, and a leakage resistance RL, as shown in Fig. 4. The capacitor module represents the energy storage capability of the UC. RS represents the charge/discharge resistance, and the UC self-discharge characteristic is described by the leakage resistance module (Wu et al., 2012).
Fig.4 Ultra-capacitor model
The UC model is derived as follows:
The terminal voltage of UC is
,
where i is the total current, and VC is the voltage of UC.
The potential of UC can be expressed as
,
where iL is the leakage current, and C is the capacitance of UC.
The leak current from capacitor is
.
Substituting Eq. (11) into Eq. (10), we can obtain:
,
then the analytic solution of Eq. (12) is
,
where VC0 is the initial voltage of UC.
The model is expressed in a state-space equation. The UC of HESS is a Maxwell BMOD0165 P048. The parameters of the UC are shown in Table 6. The UC state of charge (USOC) depends linearly on the voltage level, that is, 100% USOC corresponds to 48.6 V, whereas 0% USOC corresponds to 0 V.
Table 6
Ultra-capacitor parameters
Item
Value
Capacitance (F)
165
Equivalent series resistance (mΩ)
7.1
Nominal operating voltage (V)
48.6
Leakage current (mA)
5.2
Maximum specific energy (Wh/kg)
3.81
Maximum specific power (W/kg)
7900
3.4.2. Battery model
We select a LiFePO4 battery as the battery model for its relatively good thermal stability (Wu et al., 2012). The battery model parameters are shown in Table 7.
Table 7
LiFePO4 battery parameters
Item
Value
Capacity (Ah)
40
Equivalent series resistance (Ω)
0.066
Nominal operating voltage (V)
Cell: 3.3;
Battery pack: 72.6
Cycle limitation
Cell≥1500 (80% DOD*);
Battery pack≥1200 (80% DOD)
Operating temperature (°C)
Charge: >0;
Discharge: −20–65
Specific energy (Wh/kg)
85–100
Specific power (W/kg)
600
*Depth of discharge
Many different mathematical models could be used to predict battery performance. A common technique for estimating the battery SOC (BSOC) is used in this study, which can be described by (Piller et al., 2001; van Mierlo et al., 2004):
,
where SOC0 is the initial SOC, CN is the rated capacity, and I is the current in the battery pack.
The current I can be evaluated by the internal resistance model:
,
where R is the resistance of battery cell, Pb is the battery power at the terminal voltage, and vOC is the open circuit voltage.
4. EMS
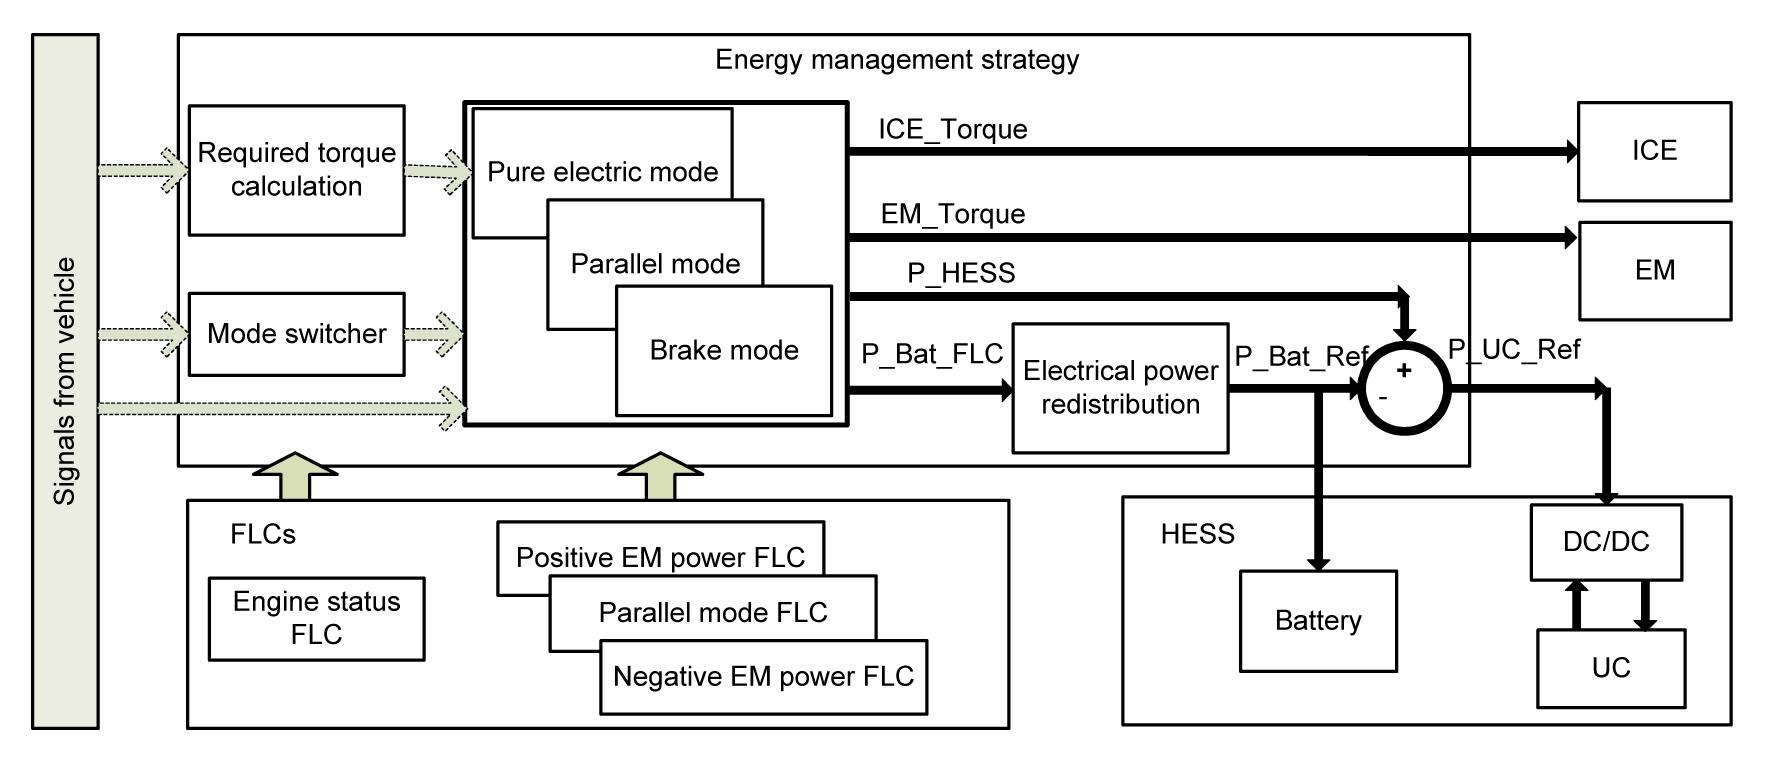
As shown in Fig. 5, the EMS includes six modules: RTC, MS, PEM, PM, BM, and EPR. Based on driver command and driving status, RTC calculates the torque to propel the vehicle, MS determines the current operation mode, and PEM and PM instantaneously distribute the optimal power requirements to all power sources. If the mode switches to PEM, the HEV runs as a pure electric vehicle; if the mode switches to PM, it runs as a parallel HEV; if the brake pedal is pressed, the HEV operates in BM. To meet the battery current limitation, EPR is employed to redistribute the electrical power between the battery and the UC. Notably, there are four fuzzy logic controllers (FLCs), which are called engine status (ES), positive EM power (PEMP), parallel driving mode (PDM) and negative EM power (NEMP), are employed (Fig. 5). According to the different module requirements, the related FLC will be needed to fulfill the corresponding task. The details of these FLCs will be demonstrated in Section 5.
Fig.5 EMS topology
The main goals of EMS are summarized as follows (Erdinc and Uzunoglu, 2010; Çağatay Bayindir et al., 2011; Bizon, 2013): to guarantee the general power balance; to handle the dynamic power peaks and mitigate the battery load; to avoid operating each power source in its low efficiency area; to promote the energy efficiency of HESS; and to improve the fuel economy. Notably, EMS performance is also related to the parameters of the key components. The parameter selection issue has been explored in our earlier study (Wang et al., 2011).
4.1. RTC
The RTC block converts the driver inputs from the accelerator and brake pedal to the required torque at the PS (Schouten et al., 2003). A parameter K is defined as the percentage of the accelerator and brake pedal stroke angle. Zero means not pressed, whereas one means fully pressed. A positive value of K [0–1] represents the position of the accelerator pedal, whereas a negative value of K [−1–1] represents the position of the brake pedal. The torques from ICE and EM are converged at PS, such that the torque command sent to the hybrid power train is also expressed as the required torque Tr at PS, which can be calculated as a function of K and v (Lee and Sul, 1998):
.
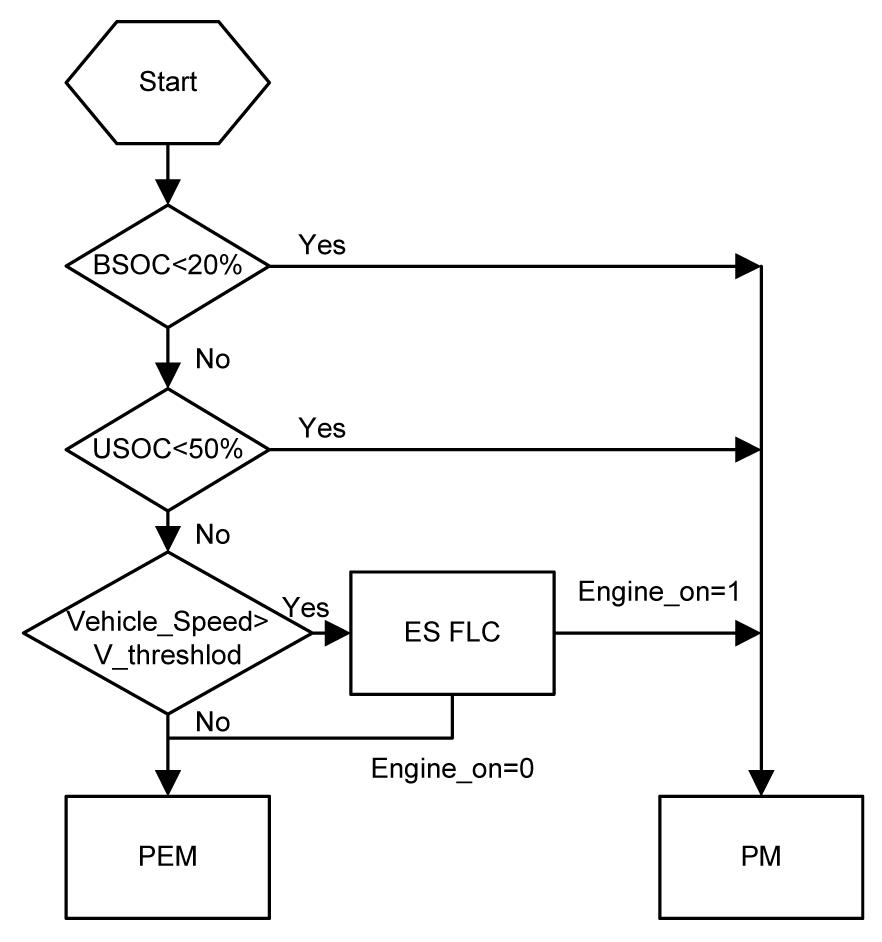
4.2. MS
The MS determines which mode should be used at the current driving condition. The PM is normally selected when the EM torque is insufficient to meet the driver power demand or if the SOC of the battery/UC drops too low. However, the most common reason for switching to PM is that driver power demand is higher than a power threshold and ICE needs to be switched on. The flow chart of the control logic for MS is shown in Fig. 6. Some logic threshold constraints combine with an FLC in this flow chart, forming an integrated control strategy to determine the mode switch between PEM and PM. First, the constraints to protect the battery and UC must be satisfied. If the BSOC drops lower than 20% or the USOC drops lower than 50%, the engine must be switched on immediately, and the mode will be changed to PM. If both of the BSOC and USOC are higher than the thresholds, a vehicle speed threshold is then used to permit the engine to be started after its rotating speed has entered the high-efficiency speed area. However, PEM would still be preferred if the power request is low and HESS can provide sufficient power to meet this request. Thus, an ES FLC is constructed to handle this situation, and a further explanation for this FLC can be found in Section 5.1. By integrating the logic threshold method and fuzzy logic, MS can meet the requirement of mode switching in this HEV.
Fig.6 MS control logic flow chart
4.3. PEM
When the HEV starts moving or drives in low-speed congestion conditions, PEM is preferred. This mode can reduce fuel consumption and bad emission without employing ICE.
If PEM is selected, the HEV runs as a pure electric vehicle. This mode can only be applied when the SOCs are beyond set thresholds to keep the HESS healthy. In this mode, the electric energy needed for driving the EM is supplied by the HESS. To achieve improved overall efficiency and mitigate the battery load, the power distribution between the battery and the UC is determined by PEMP FLC, which will be demonstrated in Section 5.2.
4.4. PM
When the power demand of a vehicle is beyond a threshold or the SOC of the battery/UC is too low, ICE should be switched on to drive the HEV or charge the HESS, and the vehicle will run as a parallel HEV. The additional EM enables the PM to guide the ICE to work in a high-efficiency area to improve fuel economy. According to the difference between the engine power and the power demand of the vehicle, EM can work as a traction motor or a generator to realize power balance in the power train. The power distribution in PM can provide better energy efficiency than that in ICE-only vehicles.
In PM, the power equation can be expressed as follows:
,
where Pps is the power required at the PS, ηtc is the TC efficiency, PEM is the EM output power, ηtran is the transmission efficiency, and PICE is the ICE output power.
In PM, the power flows in three modes which are given as follows:
(a) Mode one: Engine only.
The HEV is driven by ICE alone (PICE>0). EM does not output or regenerate power in this mode, but only rotates freely with the vehicle speed (PEM=0).
(b) Mode two: EM assisting.
EM is employed (PEM>0) to propel the vehicle along with the ICE (PICE>0).
(c) Mode three: Parallel charging.
In this mode, EM is employed as a generator to charge the HESS, with additional power from the ICE. This mode usually occurs when the SOC of battery/UC drops to a low level and the ICE can support both the required driving power and the charging power. The power equations can be described as follows:
,
,
where ηEM is the generator efficiency of EM, and Pch is the charging power to the HESS.
4.5. BM
When the brake pedal is pressed, the BM is selected. In this mode, EM can work as a generator to convert the kinetic energy into electric energy by charging the HESS. In this study, we employ a saturation curve for the regenerative torque of EM according to vehicle speed. Under a certain limitation of vehicle speed, EM stops the regeneration, and the hydraulic braking system takes charge of the total braking power requirement.
4.6. EPR
As shown in Fig. 5, “P_Bat_FLC” presents the output battery power by employing fuzzy logic. Although FLCs have already distributed the electrical power between the battery and the UC, the battery current can possibly change beyond the constraints associated with the battery features. Thus, EPR is introduced in the EMS to limit the battery current in terms of level and slope. The battery current is then kept within an interval [maximum charge current (−3C), maximum discharge current (3C)] by employing a saturation model, where 3C means 3 times the battery capacitor. Moreover, a “battery current slope limitation” (Thounthong et al., 2009) with a second-order delay filter F(s) is embedded in EPR to permit the safe operation of the battery, even during transient power demand. To obtain a natural linear transfer function, the second-order delay filter F(s) is chosen for the battery current dynamics as follows:
,
where the undamped natural frequency ωn and damping ratio ζ are the regulation parameters. Thus, a new battery power “P_Bat_Ref” can be obtained, and the power command “P_UC_Ref” sent to the DC/DC converter can also be acquired. By employing the EPR, the battery load can be mitigated, and the transient fluctuations of electrical power can be met by UC.
5. Implementation of fuzzy logic
The hybrid power train is a multi-domain, nonlinear, and time-varying plant; and fuzzy logic shows good potential for application in this field because of its strong robustness (Salmasi, 2007). Global optimal methods, such as dynamic programming (Serrao et al., 2011), can yield the best economic results but cannot easily realize real-time control. Although fuzzy logic is inferior to global optimal methods when considering economic results, it can be easily used in a real-time control system. Thus, the decision-making property of fuzzy logic can help realize a real-time and suboptimal power split.
In this study, four modules using fuzzy logic, i.e., ES, PEMP, PDM, and NEMP, are employed. ES determines whether the engine should be switched on according to the BSOC; PEMP distributes the requested power in the HESS when the EM-required power is positive; PDM takes charge of the power distribution between EM and ICE when the ICE is switched on; and NEMP deals with the electrical power distribution when EM outputs negative power to charge HESS.
5.1. ES FLC
Given that the deep charge and discharge cycles will affect the lifetime of a battery (Schaltz et al., 2009), keeping the battery operating in a narrow BSOC range will give better protection. The ES FLC deals with the relationship between the ICE on command and the current BSOC. As shown in Fig. 7 (Valerie et al., 2000), ICE is switched off when the vehicle speed is below a certain electric launch speed and the BSOC is not too low. Above this limited speed, ICE will be switched on if the required ICE torque is higher than the off torque envelope (OTE) at the current speed. The ES FLC is used to relocate the OTE based on the current BSOC. Thus, when the BSOC changes, the OTE will move up or down and let the ICE switch on “earlier” or “later” to meet the charge-sustaining request.
Fig.7 Engine on/off threshold
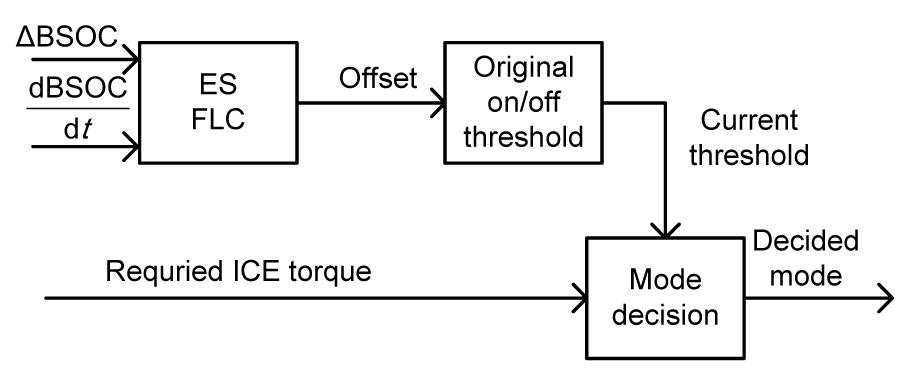
The FLC structure of ES is shown in Fig. 8. The decisions of ES FLC are based on the difference between the target BSOC and the current BSOC, and the rate of BSOC change. Multiplied by a conversion coefficient, ES FLC can output the offset torque from the original threshold, which is compared with the required ICE torque to determine whether the PM should be selected.
Fig.8 Block diagram of ES FLC
The membership functions (MFs) of inputs and outputs are shown in Fig. 9. The two inputs are the departure of BSOC and the change rate of BSOC, whereas the output is the torque offset. FLC relates the output to the inputs by using a list of if-then statements called fuzzy rules. Table 8 presents the fuzzy rule bases of the ES FLC. The possible values are defined as: NB: negative big; NM: negative medium; NS: negative small; Zero: zero; PS: positive small; PM: positive medium; and PB: positive big. As the first rule shown in Table 8, if departure of BSOC is NB and is NB as inputs, then torque offset is NB as output. This rule logic is suitable for all the four FLCs in their rule bases.
Fig.9 Membership functions of ES (a) Departure of BSOC; (b) Change rate of BSOC; (c) Torque offset of OTE
Table 8
Rule bases of the ES FLC
Departure of BSOC
Torque offset
NB
NB
NB
NB
NS
NB
NB
Zero
NB
NB
PS
NM
NB
PB
NS
NM
NB
NB
NM
NS
NB
NM
Zero
NM
NM
PS
NS
NM
PB
Zero
NS
NB
NM
NS
NS
NS
NS
Zero
NS
NS
PS
Zero
NS
PB
PS
PS
NB
NS
PS
NS
Zero
PS
Zero
PS
PS
PS
PM
PS
PB
PM
PM
NB
Zero
PM
NS
PS
PM
Zero
PM
PM
PS
PB
PM
PB
PB
PB
NB
PS
PB
NS
PM
PB
Zero
PB
PB
PS
PB
PB
PB
PB
5.2. PEMP FLC
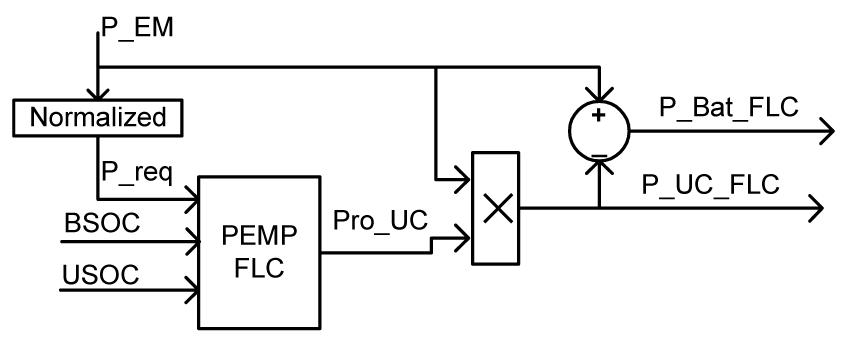
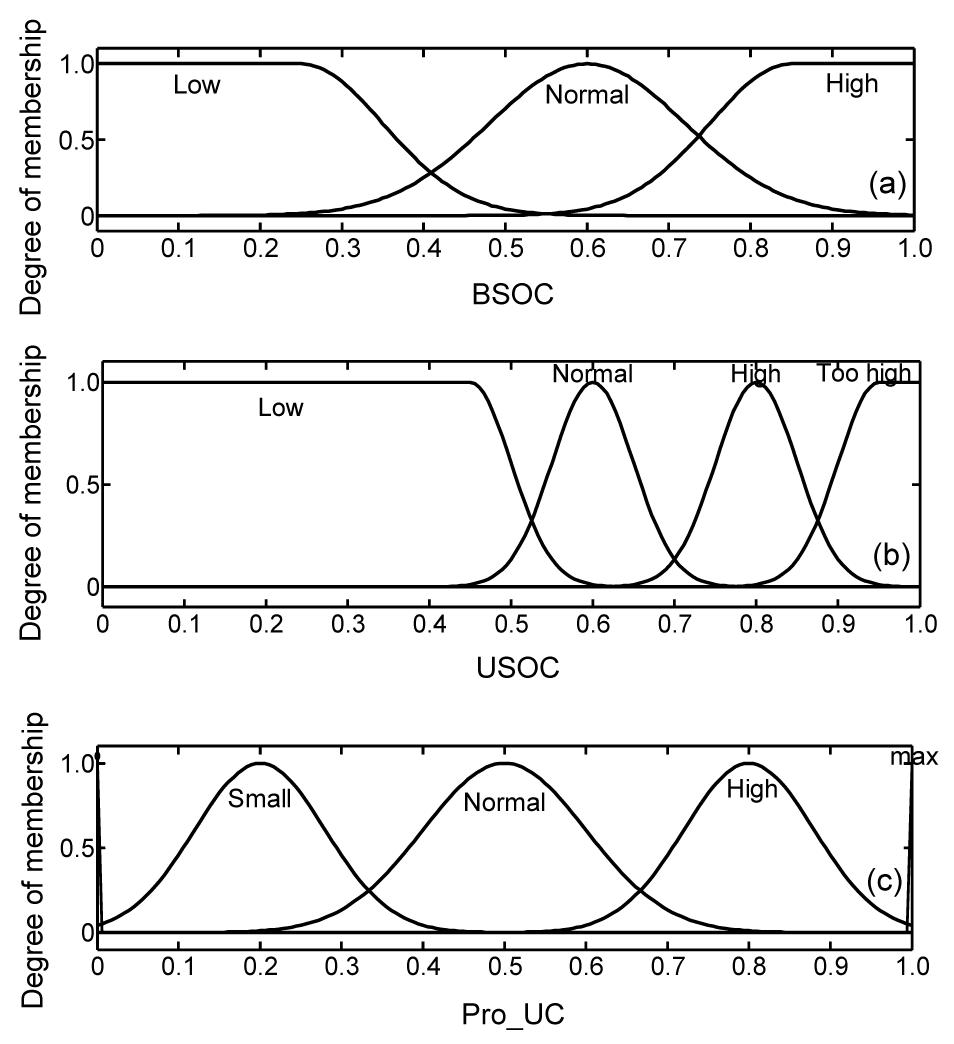
PEMP is specially designed for the energy distribution in HESS when the EM-requested power is positive. This FLC will be called when EM outputs positive power in PEM or PM. Fig. 10 presents the block diagram of the proposed FLC for the PEMP. The inputs of this FLC are the power required by the EM (P_EM), BSOC, and USOC.
Fig.10 Block diagram of PEMP FLC
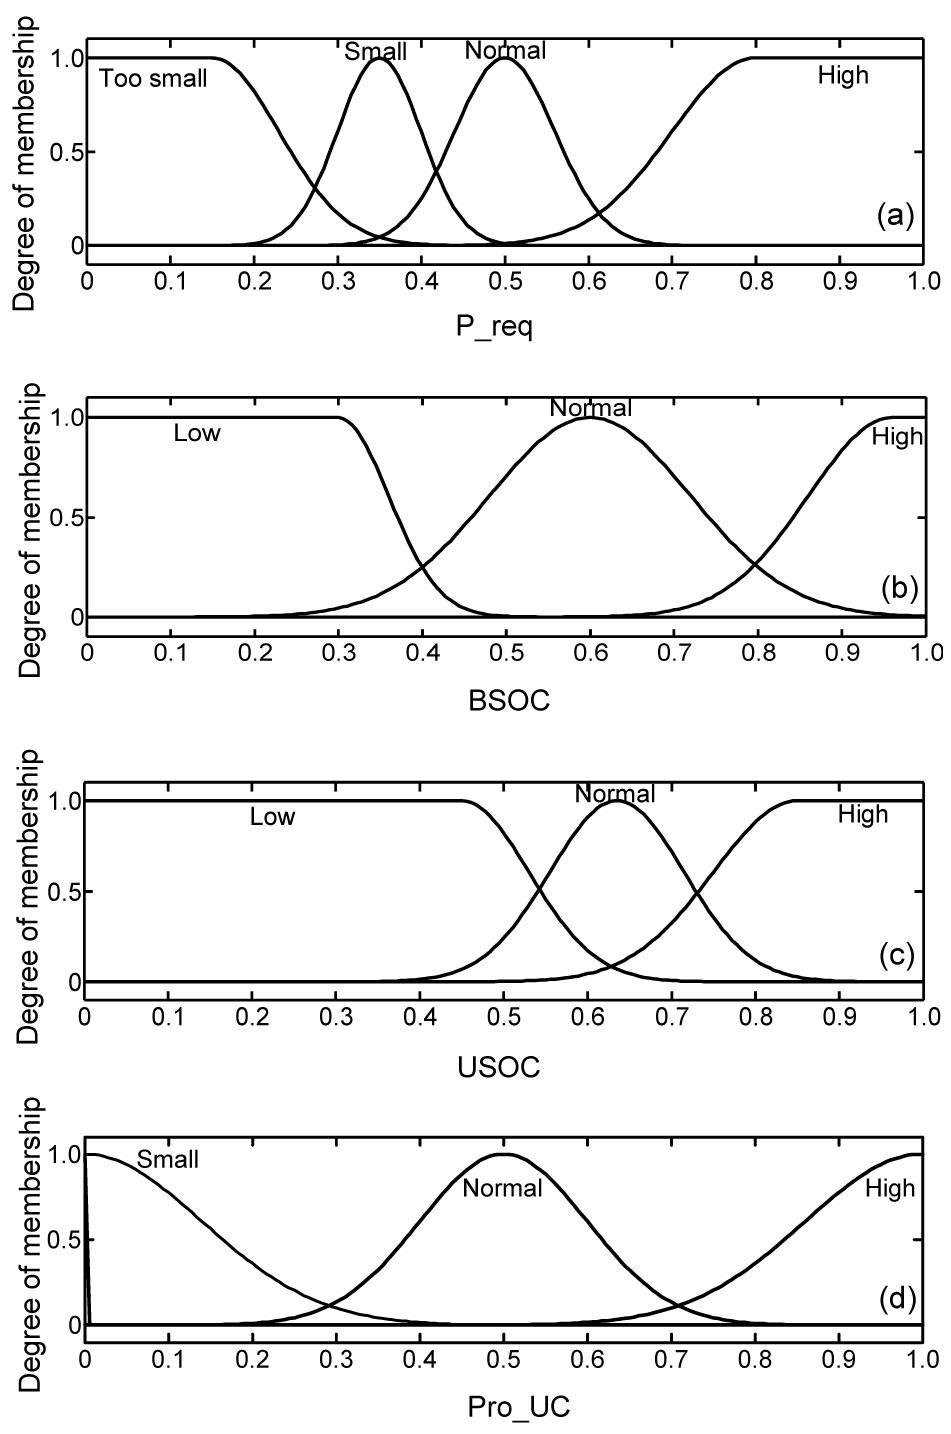
In this study, as shown in Fig. 11, P_req, BSOC, USOC, and Pro_UC are normalized to a value between 0 and 1. The MFs of P_req are presented in Fig. 11a. “Too small” and “small” represent the range of low load, whereas “high” represents the high load under conditions such as vehicle accelerating or climbing. Given that excessive current discharge will deteriorate battery life and performance, the “normal” range of BSOC is set to be approximately 0.5 to 0.7. The UC will release 75% of energy when the USOC falls from 100% to 50%. Thus, “low” represents the forbidden working area, which is below 50% of the full USOC.
Fig.11 Membership functions of PEMP (a) Normalized EM power; (b) Normalized BSOC; (c) Normalized USOC; (d) Proportion of P_EM supplied by UC
The output of this PEMP FLC is the Pro_UC, which refers to the proportion of the P_EM supplied by the UC. The rest of P_EM is supplied by the battery. UC can meet high-power and large-current request in a short time; its energy density is significantly lower than that of a battery, which is a good energy storage component that can supply electric energy for a longer time. A proper fuzzy logic in PEMP can be established according to different energy and power features of the UC and the battery. For instance, the battery supplies the whole electric energy if BSOC is high and the power requirement of EM is small. Otherwise, the requirement is met by both the battery and the UC. When the EM power is high, the UC is discharged more if USOC is not low. The energy distribution between the battery and UC will be determined by their SOC status and EM operation power. The rules in this FLC are listed in Table 9.
Table 9
Rule base of the FLC for PEMP
P_req
BSOC
USOC
Pro_UC
–
–
Low
0
Too small
High
–
0
Too small
Normal
–
0
Too small
Low
High
Normal
Too small
Low
Normal
Small
Small
High
–
0
Small
Normal
High
Normal
Small
Normal
Normal
Small
Small
Low
High
Normal
Small
Low
Normal
Small
Normal
High
High
Normal
Normal
High
Normal
Small
Normal
Normal
High
Normal
Normal
Normal
Normal
Small
Normal
Low
High
High
Normal
Low
Normal
Normal
High
High
High
Normal
High
High
Normal
Small
High
Normal
High
High
High
Normal
Normal
Normal
High
Low
High
High
High
Low
Normal
High
5.3. PDM FLC
For this HEV, PDM is the “full” mode that employs both ICE and EM to work together. Fig. 12 shows the block diagram of the proposed PDM FLC. PDM has three inputs and one output. The inputs of PM are the ICE speed (IS), accelerated pedal position (K), and BSOC. The output is the engine torque (Tice).
Fig.12 Block diagram of PDM FLC
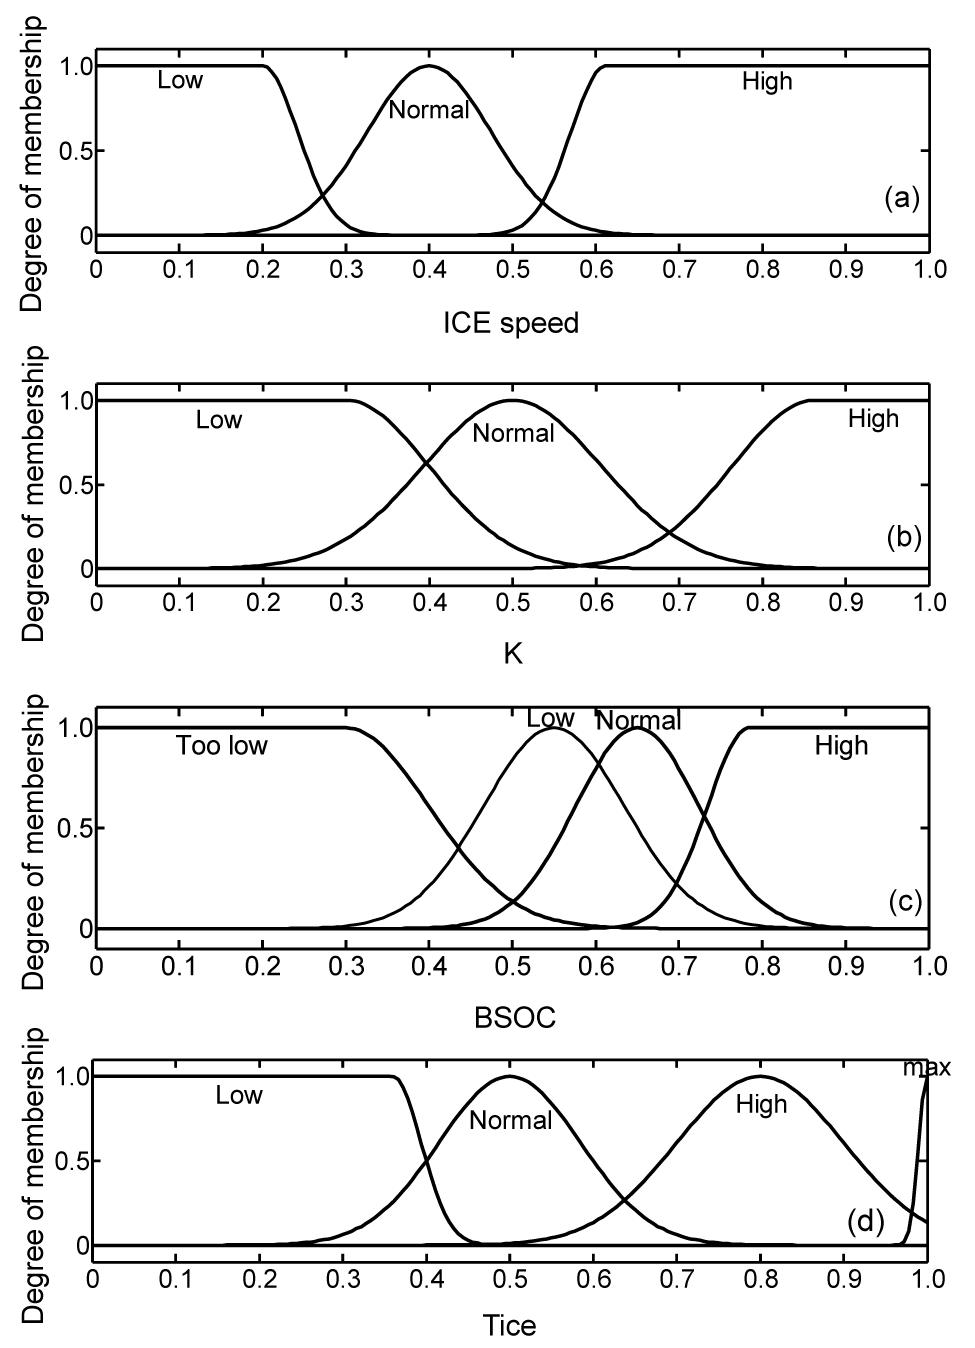
As shown in Fig. 2, the engine efficiency is the highest when engine speed is between 2500 and 4300 r/min, which is the MF “normal” part in IS (Fig. 13), where IS can change between the idling speed and the maximum speed of ICE. All the three inputs and the output are normalized to values between 0 and 1. The output Tice represents the torque percentage of the maximum engine torque at the current rotational speed. Notably, a value of 0.5 for Tice indicates the highest efficiency operation torque of ICE, which will change according to the engine speed.
Given that the energy stored in the battery is significantly greater than that in the UC, the main task of PDM FLC is to regulate the BSOC level by adjusting the ICE torque. The PDM FLC intends to control the ICE to operate in a comparatively high-efficiency region, which is the “normal” part in Tice (Fig. 13). Furthermore, the torque command of ICE can be tuned to keep the BSOC within the normal range. If the BSOC is high, the ICE power will drop, and the EM will provide more power. If the BSOC is low, additional power will be provided by the ICE to charge the battery. If the BSOC is too low, the ICE will turn to its highest torque level to supply the greatest charging power. Notably, the PDM FLC only distributes power between the ICE and the EM. The power management of HESS requires cooperation between the PDM FLC and other FLCs. For instance, when the PDM FLC outputs a positive power command to EM, HESS needs to output power for EM-assisted driving, and then the PEMP FLC is called to regulate the output power flow between the battery and the UC. By contrast, when the EM regenerates power to charge HESS, the NEMP FLC (as discussed in Section 5.4) is called to meet the regenerative power distribution requirement in this situation. The rules used in PM FLC are listed in Table 10.
Table 10
Rule base of the FLC for PM
ICE speed
K
BSOC
Tice
–
–
Too low
Max
Low
Low
Low
High
Low
Low
Normal
Low
Low
Low
High
Low
Low
Normal
Low
High
Low
Normal
Normal
Normal
Low
Normal
High
Low
Low
High
Low
Max
Low
High
Normal
Normal
Low
High
High
Normal
Normal
Low
Low
High
Normal
Low
Normal
Normal
Normal
Low
High
Normal
Normal
Normal
Low
High
Normal
Normal
Normal
Normal
Normal
Normal
High
Normal
Normal
High
Low
High
Normal
High
Normal
Normal
Normal
High
High
Normal
High
Low
Low
High
High
Low
Normal
Normal
High
Low
High
Normal
High
Normal
Low
High
High
Normal
Normal
Normal
High
Normal
High
Normal
High
High
Low
Max
High
High
Normal
High
High
High
High
Normal
5.4. NEMP FLC
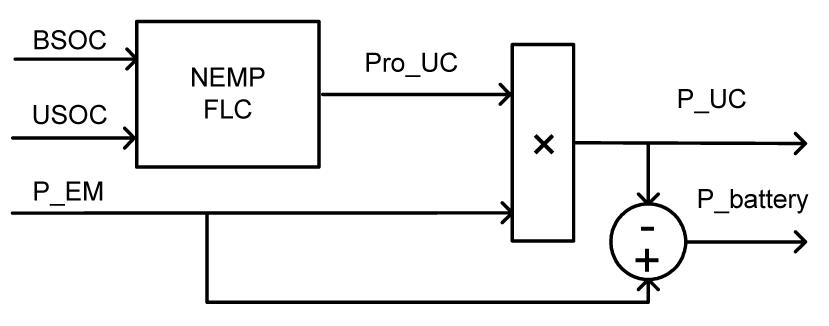
NEMP deals with the power distribution in HESS when EM outputs negative power in BM or PM. Fig. 14 shows the block diagram of NEMP FLC. The inputs of this FLC are BSOC and USOC.
Fig.14 Block diagram of NEMP FLC
As shown in Fig. 15, the MFs for both SOCs are quite similar as that in PEMP. To improve the absorbing efficiency of HESS, the MFs of USOC is separated into four parts, and the output Pro_UC is grouped for five conditions: 0, small, normal, high, and max.
Fig.15 Membership functions of NEMP (a) Normalized BSOC; (b) Normalized USOC; (c) Proportion of P_EM supplied by UC
The main goal of NEMP is to distribute the regenerative energy from the EM to the battery and UC. Given the requirements of high dynamic performance, UC should be first charged by the large current when in a hard transient state. When USOC is low, UC obtains more EM regenerative energy; when USOC is sufficiently high, the battery obtains more EM regenerative energy. When USOC reaches its highest level, Pro_UC turns to 0 to avoid UC overcharge. The rules used in NEMP FLC are listed in Table 11.
Table 11
Rule base of the FLC for NEMP
BSOC
USOC
Pro_UC
High
Low
Max
High
Normal
Max
High
High
Normal
High
Too high
0
Normal
Low
Max
Normal
Normal
High
Normal
High
Normal
Normal
Too high
0
Low
Low
High
Low
Normal
Normal
Low
High
Small
Low
Too high
0
6. Results and discussion
This section explores the effectiveness of this EMS. Simulation results and experimental validation are presented. Both the simulation and the experiment are carried out under ECE driving cycle.
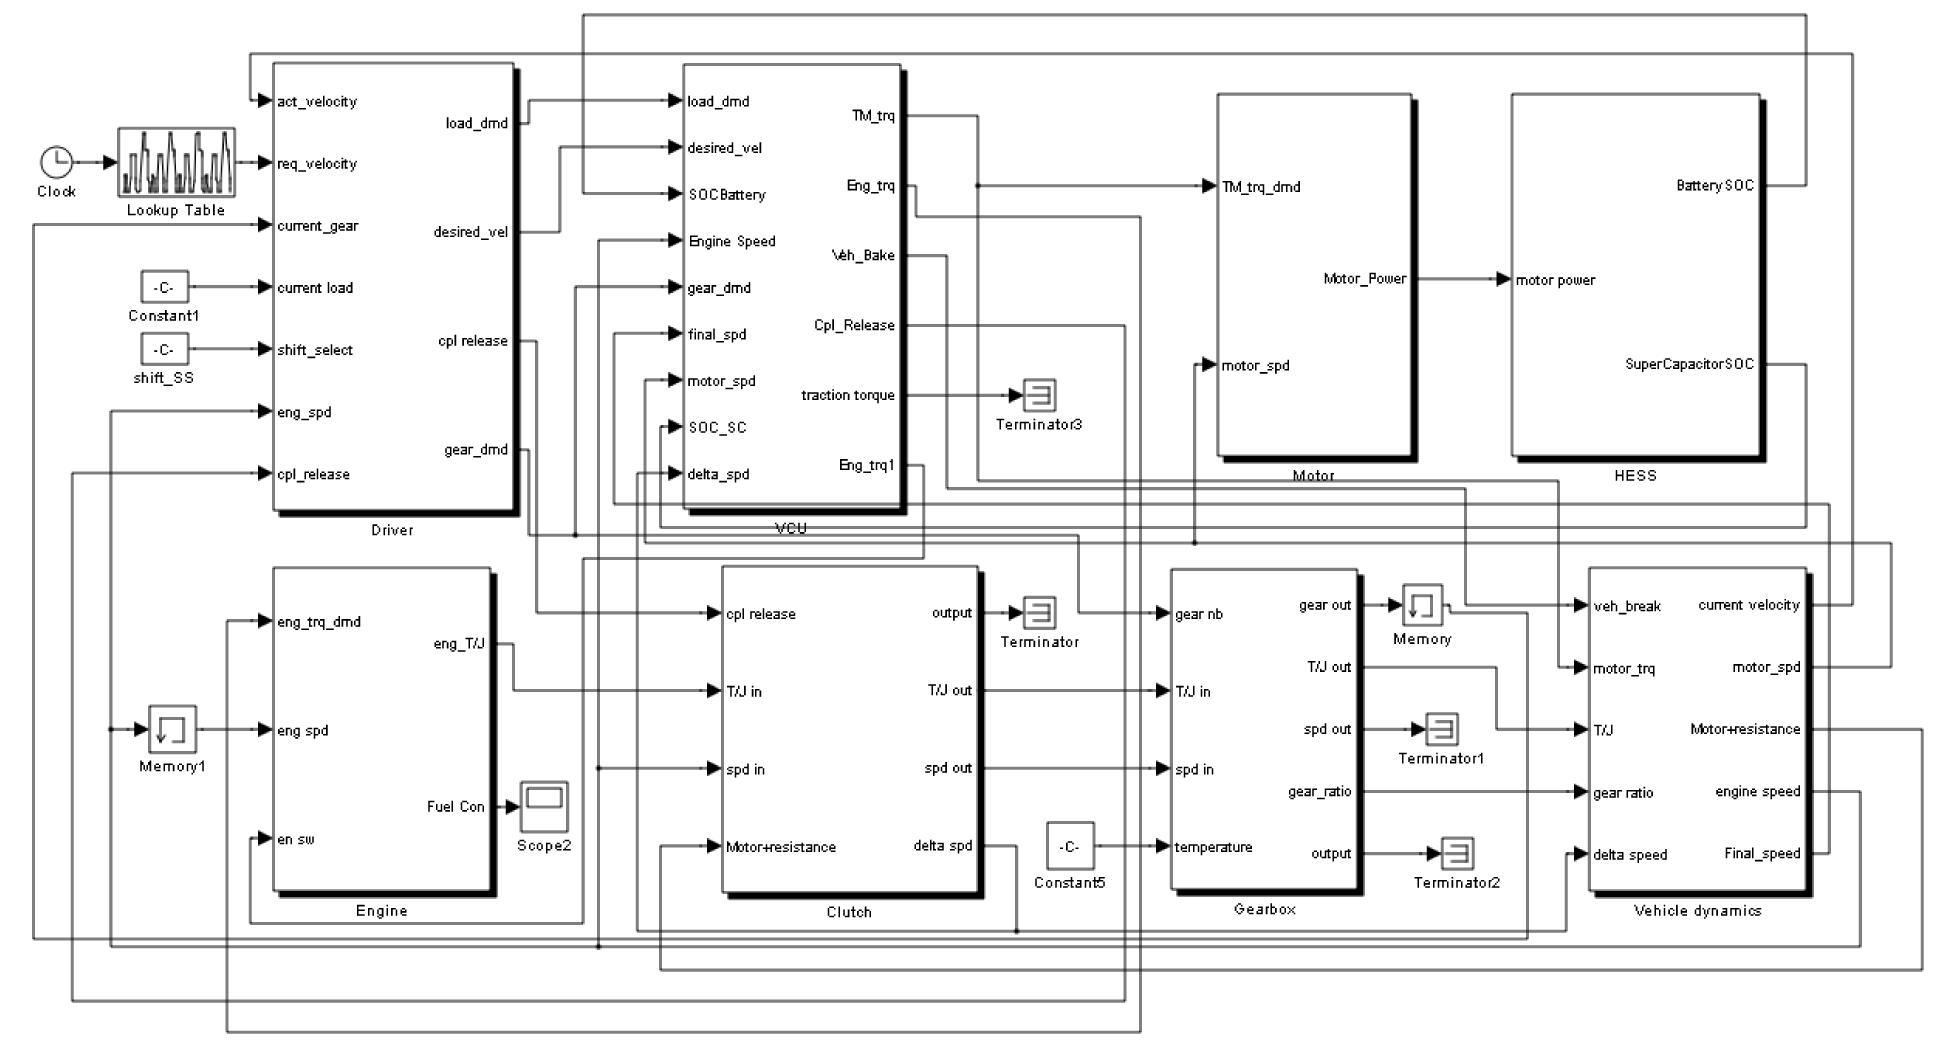
6.1. Simulation results
A forward-facing vehicle model integrated with EMS is developed in the Matlab/Simulink environment (Fig. 16). In Fig. 17, the vehicle velocity, the ICE on/off switch mode, and the value of K are demonstrated. As shown in Fig. 17a, the actual velocity of the HEV can precisely follow the desired velocity of the ECE driving cycle, which indicates that the vehicle kinetic performance is satisfied. Based on the ICE on/off mode, the ICE is controlled to output power only when the vehicle is driven in the PM and without braking operation.
Fig.16 HEV model topology
Fig.17 Simulation results under ECE driving cycle (a) Vehicle velocity; (b) Engine on/off status; (c) Accelerate pedal position
For the HEV, when the BSOC is sufficiently high, the ICE will operate in a comparatively high-efficiency region, which will result in good fuel economy. If the BSOC becomes lower, additional power will be provided by the ICE to charge the battery. If the BSOC is too low, the ICE will operate at its highest torque to fast charge the battery. As shown in Fig. 18, when the value of BSOC becomes increasingly lower, the operation points of ICE will move up toward and finally reach the maximum torque envelope. By controlling ICE in this way, the balance of BSOC can be guaranteed.
Fig.18 Engine operating points under different BSOC
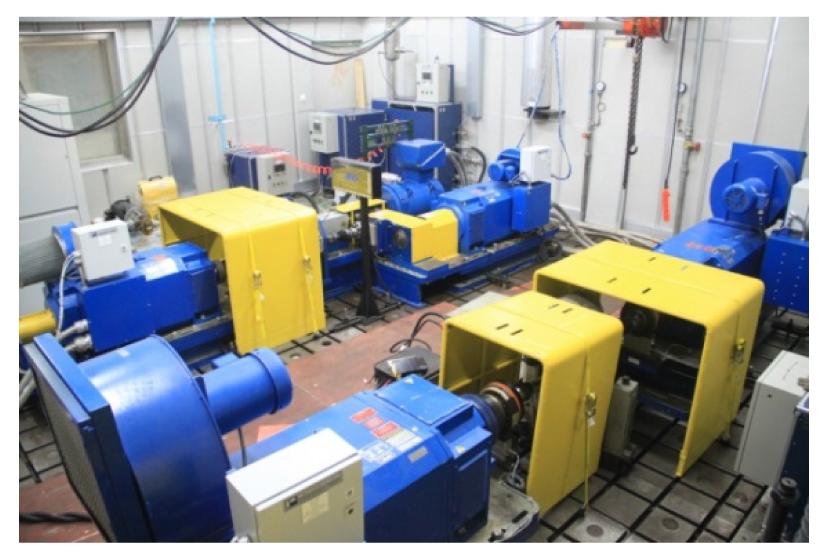
6.2. Experimental validation
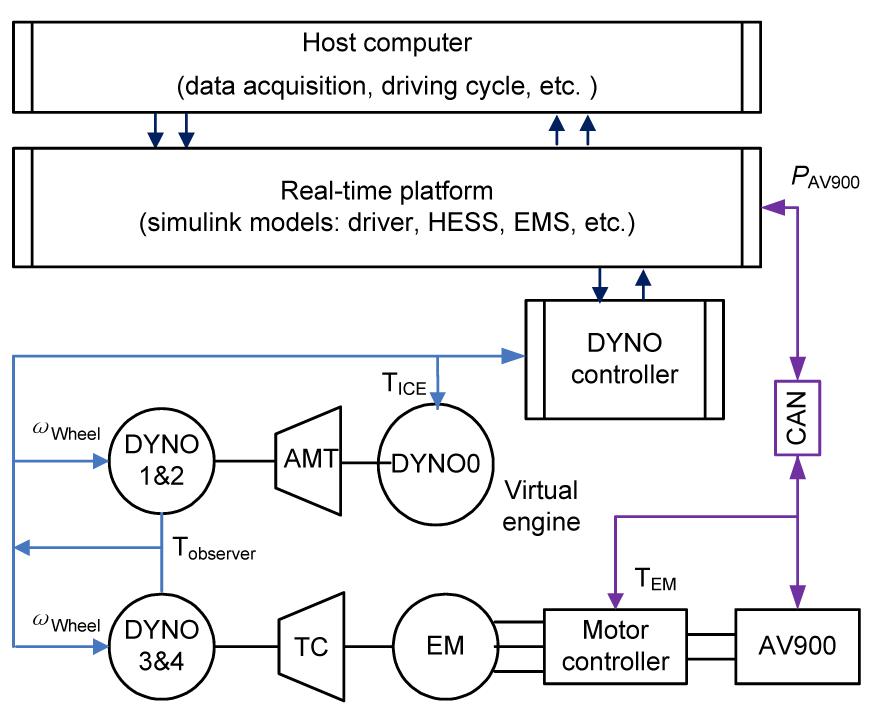
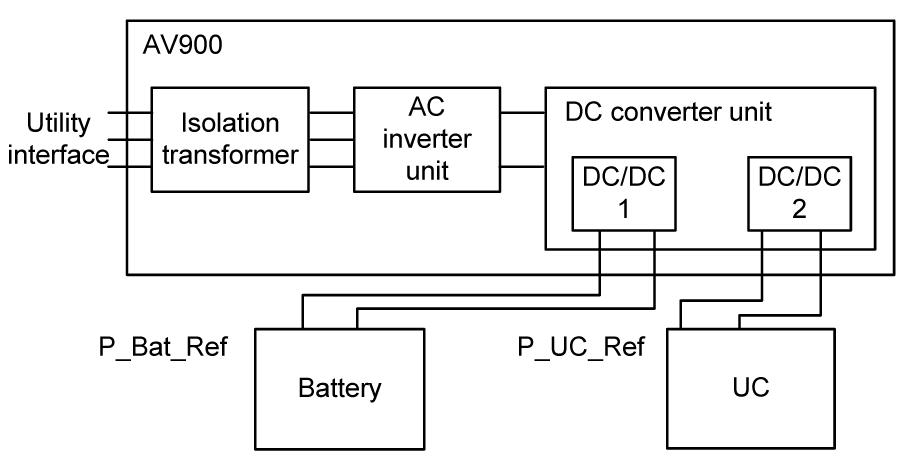
This experimental validation is carried out on a dynamometer power train system (DPS) from A&D Technology, Inc. The DPS and its topology are shown in Figs. 19 and 20. As shown in Fig. 20, a host computer is used for data acquisition and executing a predefined driving cycle (ECE driving cycle in this test). The simulation models (including driver model, HESS model, vehicle model, EMS, etc.) are compiled using the Mathworks real-time workshop and then downloaded into the real-time platform (RTP). The RTP communicates with the DYNO controller to drive the DYNOs. Meanwhile, the communication between the RTP and the EM controller and AV900 is realized by adopting CAN BUS. AV900 is a bi-directional multi-channel DC power system, which is adopted to supply the electrical power needed by EM. The specifications of the DYNOs are shown in Table 12.
Fig.19 Dynamometer power train system
Fig.20 Topology of the dynamometer power train system
Table 12
Specifications of dynamometer motors
Motors
Type
Speed (r/min)
Torque (N·m)
Input motor (DYNO0)
280 kW AC vector motor
0–8000 (bi-direction)
453 (0–5900 r/min)
Front output motor (DYNO1&2)
170 kW AC vector motor
0–3000 (bi-direction)
2029 (0–800 r/min)
Rear output motor (DYNO3&4)
380 kW AC vector motor
0–2500 (bi-direction)
4535 (0 –800 r/min)
In this experiment, some components are actually presented, and some are emulated or simulated. As shown in Fig. 20, the input motor (DYNO0) emulates the ICE by downloading the engine torque map and fuel map into the control system. The four output motors (DYNO1–4) emulate the vehicle power consumption and their speeds follow the wheel speed commands from the RTP. The permanent magnet brushless DC EM is integrated with DPS to construct the same power train architecture as the target HEV.
The operation of this experimental validation is as follows: At each sample time, the driver model calculates the reference driving torque by comparing the actual wheel speed (DYNO1–4) with the target driving cycle speed. The EMS distributes the reference torque into the ICE torque command TICE and EM torque command TEM. These two commands are sent to the virtual engine (DYNO0) and EM controller separately. Then, the observed torque values on DYNO1–4 are transmitted to RTP as the actual torque values on wheels. The vehicle model calculates the wheel speeds ωWheel based on these torque values and sends ωWheel to DYNO1–4. By regulating the PI tuning parameters in the driver model, the actual speed of DYNOs can follow the target ECE driving cycle speed quite well. Moreover, the AV900 sends the PAV900 power values back to RTP. Thus, the EMS model in RTP can calculate the real time distributed power demands for UC and battery in HESS model under ECE driving cycle.
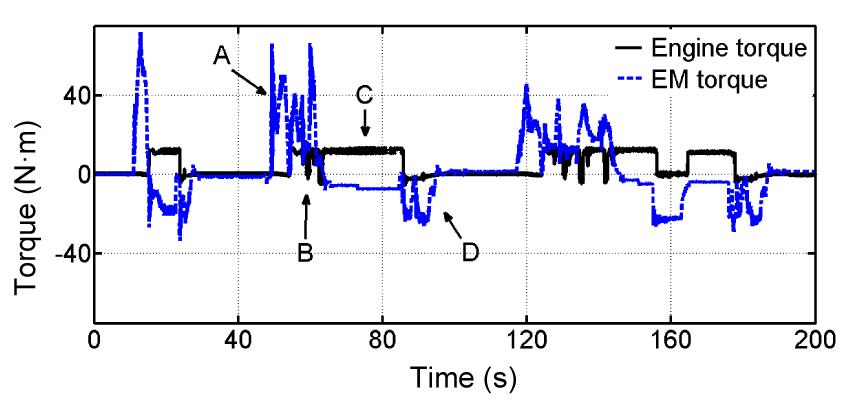
The experimental results are presented and analyzed below. As shown in Fig. 21, the EM and ICE output torques are shown in different modes. For instance, “A” represents PEM, in which EM can meet the power requirement of HEV alone. When the vehicle speed increases, the mode changes from “A” to “B”, the motor assisting sub-mode in PM, in which the ICE is switched on and outputs torque along with EM. When the vehicle speed gets to a constant value, the mode changes to “C”, the parallel charging sub-mode in PM. The EMS regulates ICE working in its high efficiency region, and the additional power is used to drive the EM to charge. When the driver presses the brake pedal, the mode changes to “D”, the BM. The EM regenerates the braking power, improving energy utilization.
Fig.21 Torque distribution and mode transition under ECE driving cycle
According to the consuming EM power in AV900, the EMS can output distributed power requirements for battery/UC simultaneously during the ECE driving cycle. The distributed power requirements are then loaded to the real battery and UC by AV900 to test and verify the effectiveness of the proposed EMS. We select a 40Ah LiFePO4 battery and Maxwell BMOD0165 P048 UC for the test. The topology of the HESS test is shown in Fig. 22. The battery and UC are connected with AV900 with different DC/DC converters, and then the AV900 works in power mode to load the separated power commands to battery and UC.
Fig.22 Topology of HESS test
As shown in Fig. 23, different current variations of battery and UC demonstrate the effectiveness of the EMS. In transient conditions, as battery power dynamics has been reduced by EPR, the UC meets the load variations. Thus, the sudden electrical power increase leads to a sudden current increase of UC, and on the contrary a sudden electrical power decrease leads to a sudden current decrease of UC. By distributing the electrical power in this way, the EMS can effectively mitigate the stress of battery load. Meanwhile, because of the higher voltage level than UC, the battery still undertakes the main part of the electrical power requirement, which is helpful to keep the UC working in its reasonable voltage level. The maximum discharge current of the battery is limited to 56.7 A, which is less than 1.5C for this 40 Ah LiFePO4 battery, whereas the maximum discharge current of UC is 127.7 A. In the regenerated braking condition, the maximum charging current of the battery is 27.52 A, whereas the maximum charging current of the UC is 105.5 A. As shown in Fig. 23, the trends and amplitudes of both simulation battery/UC currents fit well with the experimental results. The good conformity between simulation and experimental results can also be observed in Figs. 24 and 25, which demonstrates the effectiveness of the simulation models.
Fig.23 Current of battery/UC under ECE driving cycle (a) Experimental current; (b) Simulation current
For commercial battery products, 3C is usually the highest charge-discharge rate (Chen et al., 2002). As shown in Fig. 23, both the charge rate and discharge rate of this 40 Ah battery are restricted within 3C. In contrast, the UC current is significantly higher than that of the battery in the transit power fluctuation condition. Thus, the results demonstrate that UC is effectively controlled to meet the transit power demand, which proves the effectiveness of the EMS.
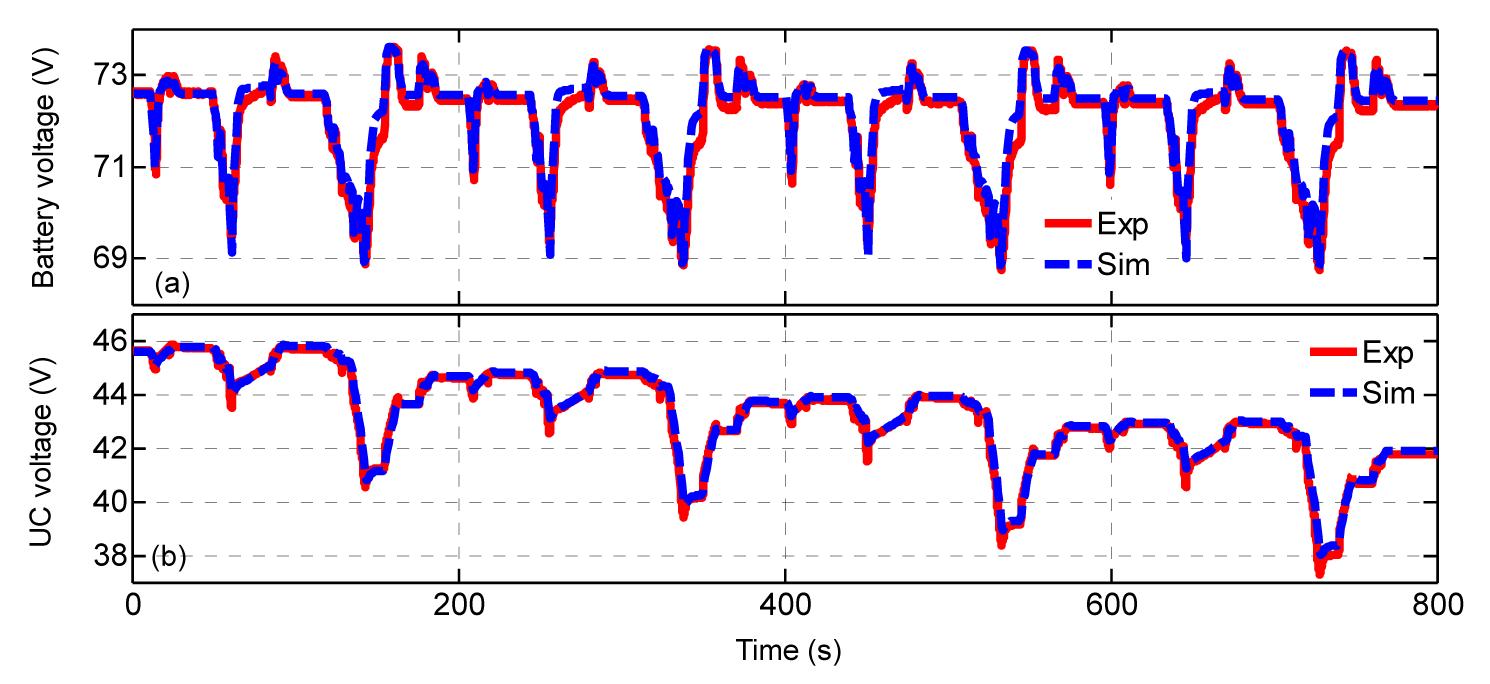
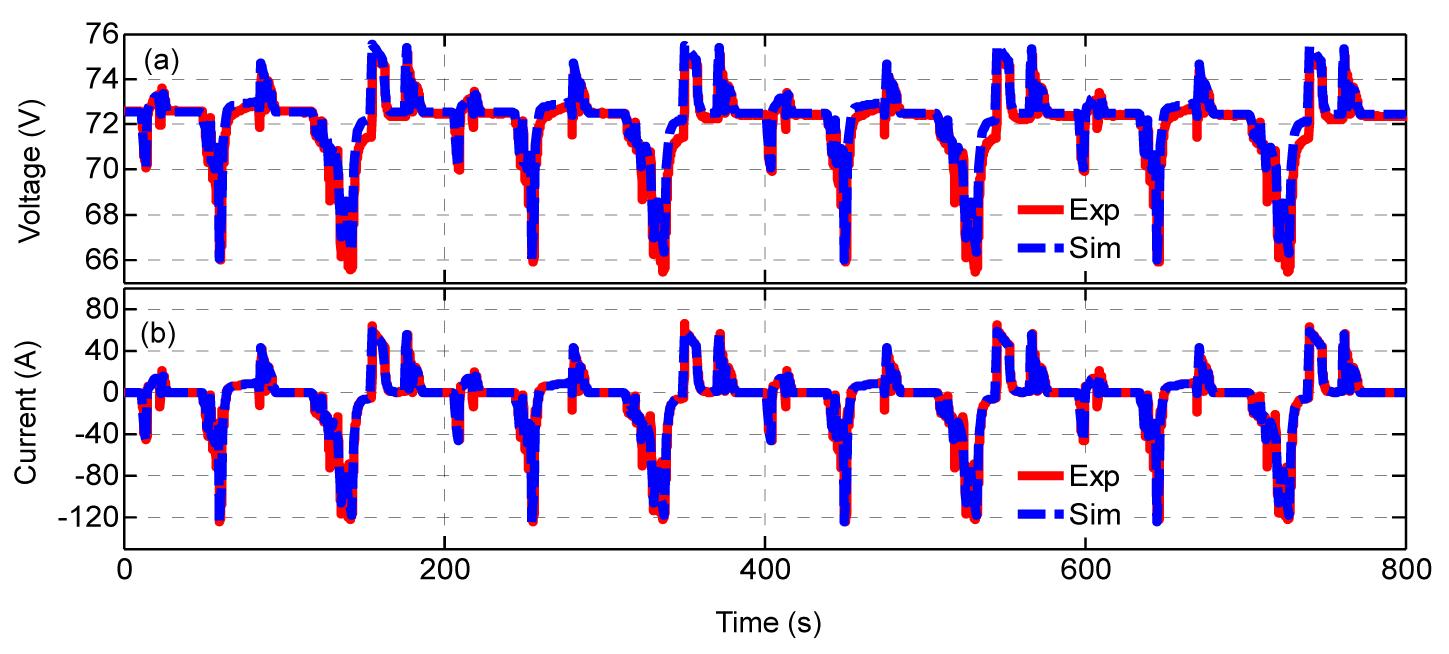
As shown in Fig. 24, the fluctuant range of battery terminal voltage is [68.74 V, 73.6 V]; while the fluctuant range of UC terminal voltage is [37.3 V, 45.84 V]. By contrast, if the total EM power is met by the battery only system, the voltage and current fluctuation of battery significantly increases. As shown in Fig. 25, the maximum discharging current of the battery is 124.38 A, and the maximum charging current is 66.14 A. Under the frequent large charging and discharging current condition, the battery terminal voltage also fluctuates dramatically. The fluctuant range of the battery terminal voltage is [65.44 V, 75.16 V] in this test. As we know, the DC bus stability is critical to the efficiency of the EM system. Large voltage fluctuation or low voltage level will deteriorate the EM efficiency. In comparison with the approximately 10 V terminal voltage fluctuation in the battery only system, a 4.86 V battery terminal voltage fluctuation is achieved in the HESS topology. Thus, the HESS can guarantee a higher EM efficiency than the battery only system.
Fig.24 Voltage of battery/UC under ECE driving cycle (a) Battery voltage; (b) UC voltage
Fig.25 Voltage and current of battery only system under ECE driving cycle (a) Voltage; (b) Current
The HESS energy efficiency result is shown in Table 13. The initial BSOC is 70%, and the initial UC voltage is 45.6 V. By using the HESS topology, the total energy consumption of battery and UC is reduced 3.91% when comparing with the battery only system. Therefore, the following points can be concluded:
By coordinating the battery and UC in an HESS topology, the current in battery can be smoothened. Thus, the fluctuation of battery terminal voltage can also be reduced, which is helpful to control the EM system.
The battery is adopted to meet the average power in the ECE driving cycle, and the maximum discharge/charge rate is limited within 3C, which is beneficial to prolong the battery life.
The total energy consumption in HESS is lower than that of the battery only system. Thus, the electrical energy efficiency is improved by adopting HESS topology.
Table 13
HESS energy efficiency result
ESS type
BSOC
UC voltage
Battery energy consumption (Wh)
UC energy consumption (Wh)
Total energy consumption (Wh)
Energy efficiency improvement (%)
Initial (%)
Final (%)
Initial (%)
Final (%)
Battery only
70
67.21
–
–
80.82
–
80.82
–
HESS
70
67.52
45.6
41.76
71.90
5.76
77.66
3.91
By downloading the ICE fuel map into the DPS controller, the ICE fuel consumption can be calculated. In this case, the ICE fuel consumption value is 4.43 L/100 km. Meanwhile, there is electrical energy consumption in the battery/UC, which is 77.66 Wh (1.941 kWh/100 km) under the ECE driving cycle. To obtain the equivalent fuel consumption (EFC) value, an “energy transition” method is adopted by using Eq. (21). Assuming that the ICE can drive EM to generate power for charging HESS back to its initial electrical energy level, there is a relationship between the equivalent fuel consumption and the HESS electrical energy consumption, as shown in Eq. (21):
,
where EHESS is the consumed HESS energy, Df is the density of fuel, and Qf is the low heat value of gasoline. The generator-set efficiency ηgen is assumed as 30% on average. The energy consumption of this HEV is given in Table 14. The total fuel consumption by adding the ICE fuel consumption and EFC together is 5.15 L/100 km. Compared with that of the same class conventional vehicle, the fuel consumption of this HEV is reduced by 24.30%.
Table 14
Energy consumption under ECE driving cycle
Vehicle type
Energy consumption
Fuel consumption (L/100 km)
HESS (kWh/100 km)
Equivalent fuel consumption (L/100 km)
Energy reduction (%)
Hybrid electric vehicle
4.43
1.941
5.15
24.30
Conventional vehicle
6.80
–
6.80
–
7. Conclusions
The main aim of this work is to propose a fuzzy logic-based EMS for an HEV including three power sources: the ICE, the battery, and the UC. The combined utilization of the battery and UC can form a HESS with advantages of high energy density and high power density. The study mainly focuses on the EMS development taking account of the intrinsic energetic characteristics of each source, to determine the operation mode and to distribute power among the power sources. The EMS employs the UC to meet the transient power variation, by adopting the limited slope for the battery reference current. Thus, the battery load is mitigated and a longer battery lifetime can be expected.
The experimental validation is carried out in a dynamometer power train system, which includes five DYNOs and also combining with an EM and an AV900 power source. The LiFePO4 battery pack (72 V, 40 Ah) and Maxwell BMOD0165 P048 UC (48 V, 165 F) are also employed in the experiment. The results show that EMS can meet power requirements for the vehicle, and battery load is mitigated and both battery and UC can be maintained in their reasonable SOC range under the ECE driving cycle. Electrical energy efficiency is improved by adopting HESS topology, the energy consumption of which is reduced 3.91% comparing with the battery only system. Fuel economy of this HEV is improved by 24.30% compared with the same class conventional vehicle. The results indicate that this EMS can realize good fuel economy and be effective in power distribution and mitigation of battery load.
The fuel economy and kinetic performance of the HEV also depend on the gear-shifting strategy. Moreover, achieving a deeper understanding for the optimal operation of HESS can further improve the system efficiency and prolong the life cycle of the electric components. These two issues will be our future work.
[1] Abdelsalam, A.A., Cui, S., 2012. A fuzzy logic global power management strategy for hybrid electric vehicles based on a permanent magnet electric variable transmission. Energies, 5(4):1175-1198.
[2] Allegre, A.L., Bouscayrol, A., Trigui, R., 2009. Influence of Control Strategies on Battery/Supercapacitor Hybrid Energy Storage Systems for Traction Applications. , Vehicle Power and Propulsion Conference, IEEE, 213-220. :213-220.
[3] Baumann, B., Rizzoni, G., Washington, G., 1998. Intelligent Control of Hybrid Vehicles Using Neural Networks and Fuzzy Logic. SAE Technical Paper 981061, :
[4] Bizon, N., 2013. Energy efficiency for the multiport power converters architectures of series and parallel hybrid power source type used in plug-in/V2G fuel cell vehicles. Applied Energy, 102(0):726-734.
[5] ağatay Bayindir, K., Gzkk, M.A., Teke, A., 2011. A comprehensive overview of hybrid electric vehicle: Powertrain configurations, powertrain control techniques and electronic control units. Energy Conversion and Management, 52(2):1305-1313.
[6] Chan, C.C., 2002. The state of the art of electric and hybrid vehicles. Proceedings of the IEEE, 90(2):247-275.
[7] Chen, H., Qiu, X., Zhu, W., Hagenmuller, P., 2002. Synthesis and high rate properties of nanoparticled lithium cobalt oxides as the cathode material for lithium-ion battery. Electrochemistry Communications, 4(6):488-491.
[8] Ehsani, M., Gao, Y., Emadi, A., 2009. Modern Electric, Hybrid Electric, and Fuel Cell Vehicles, CRC Press,:1-2.
[9] Erdinc, O., Uzunoglu, M., 2010. Recent trends in PEM fuel cell-powered hybrid systems: Investigation of application areas, design architectures and energy management approaches. Renewable and Sustainable Energy Reviews, 14(9):2874-2884.
[10] Jeong, K.S., Lee, W.Y., Kim, C.S., 2005. Energy management strategies of a fuel cell/battery hybrid system using fuzzy logics. Journal of Power Sources, 145(2):319-326.
[11] Jung, D.Y., Lee, B.H., Kim, S.W., 2002. Development of battery management system for nickel-metal hydride batteries in electric vehicle applications. Journal of Power Sources, 109(1):1-10.
[12] Karden, E., Ploumen, S., Fricke, B., Miller, T., Snyder, K., 2007. Energy storage devices for future hybrid electric vehicles. Journal of Power Sources, 168(1):2-11.
[13] Kisacikoglu, M.C., Uzunoglu, M., Alam, M.S., 2009. Load sharing using fuzzy logic control in a fuel cell/ultracapacitor hybrid vehicle. International Journal of Hydrogen Energy, 34(3):1497-1507.
[14] Langari, R., Won, J.S., 2005. Intelligent energy management agent for a parallel hybrid vehicle-part I: System architecture and design of the driving situation identification process. IEEE Transactions on Vehicular Technology, 54(3):925-934.
[15] Lee, H.D., Sul, S.K., 1998. Fuzzy-logic-based torque control strategy for parallel-type hybrid electric vehicle. IEEE Transactions on Industrial Electronics, 45(4):625-632.
[16] Piller, S., Perrin, M., Jossen, A., 2001. Methods for state-of-charge determination and their applications. Journal of Power Sources, 96(1):113-120.
[17] Rizzoni, G., Guzzella, L., Baumann, B.M., 1999. Unified modeling of hybrid electric vehicle drivetrains. IEEE/ASME Transactions on Mechatronics, 4(3):246-257.
[18] Salmasi, F.R., 2007. Control strategies for hybrid electric vehicles: Evolution, classification, comparison, and future trends. IEEE Transactions on Vehicular Technology, 56(5):2393-2404.
[19] Schaltz, E., Khaligh, A., Rasmussen, P.O., 2009. Influence of battery/ultracapacitor energy-storage sizing on battery lifetime in a fuel cell hybrid electric vehicle. IEEE Transactions on Vehicular Technology, 58(8):3882-3891.
[20] Schouten, N.J., Salman, M.A., Kheir, N.A., 2003. Energy management strategies for parallel hybrid vehicles using fuzzy logic. Control Engineering Practice, 11(2):171-177.
[21] Serrao, L., Onori, S., Rizzoni, G., 2011. A comparative analysis of energy management strategies for hybrid electric vehicles. Journal of Dynamic Systems, Measurement, and Control, 133(3):031012-031019.
[22] Tanoue, K., Yanagihara, H., Kusumi, H., 2008. Hybrid is a Key Technology for Future Automobiles Hydrogen Technology. Springer,Berlin Heidelberg :235-272.
[23] Thounthong, P., Ral, S., Davat, B., 2009. Energy management of fuel cell/battery/supercapacitor hybrid powersource for vehicle applications. Journal of Power Sources, 193(1):376-385.
[24] Tomaž, K., 2007. Hybridization of powertrain and downsizing of IC engine–a way to reduce fuel consumption and pollutant emissions–part 1. Energy Conversion and Management, 48(5):1411-1423.
[25] Trovao, J.P., Pereirinha, P.G., Ferreira, F.J.T.E., 2008. Comparative Study of Different Electric Machines in the Powertrain of a Small Electric Vehicle. , 18th International Conference on Electrical Machines, 1-6. :1-6.
[26] Valerie, H.J., Keith, B.W., David, J.R., 2000. HEV Control Strategy for Real-time Optimization of Fuel Economy and Emissions. SAE Technical Paper 2000-01-1543, :
[27] van Mierlo, J., van den Bossche, P., Maggetto, G., 2004. Models of energy sources for EV and HEV: Fuel cells, batteries, ultracapacitors, flywheels and engine-generators. Journal of Power Sources, 128(1):76-89.
[28] Vasebi, A., Partovibakhsh, M., Bathaee, S.M.T., 2007. A novel combined battery model for state-of-charge estimation in lead-acid batteries based on extended Kalman filter for hybrid electric vehicle applications. Journal of Power Sources, 174(1):30-40.
[29] Wang, L., Zhang, J.L., Yin, C.L., Zhang, Y., Wu, Z.W., 2011. Realization and analysis of good fuel economy and kinetic performance of a low-cost hybrid electric vehicle. Chinese Journal of Mechanical Engineering, 24(05):774-789.
[30] Won, J.S., Langari, R., 2005. Intelligent energy management agent for a parallel hybrid vehicle-part ii: Torque distribution, charge sustenance strategies, and performance results. IEEE Transactions on Vehicular Technology, 54(3):935-953.
[31] Wu, Z., Zhang, Z., Yin, C., Zhao, Z., 2012. Design of a soft switching bidirectional DC-DC power converter for ultracapacitor-battery interfaces. International Journal of Automotive Technology, 13(2):325-336.
[32] Xiong, W., Zhang, Y., Yin, C.L., 2009. Configuration design, energy management and experimental validation of a novel series-parallel hybrid electric transit bus. Journal of Zhejiang University-SCIENCE A, 10(9):1269-1276.
[33] Xiong, W., Zhang, Y., Yin, C., 2009. Optimal energy management for a series-parallel hybrid electric bus. Energy Conversion and Management, 50(7):1730-1738.
[34] Yoo, H., Sui, S.K., Park, Y., Jeong, J., 2008. System integration and power-flow management for a series hybrid electric vehicle using supercapacitors and batteries. IEEE Transactions on Industry Applications, 44(1):108-114.
Open peer comments: Debate/Discuss/Question/Opinion


Open peer comments: Debate/Discuss/Question/Opinion
<1>