Predicting crest settlement in concrete face rockfill dams using adaptive neuro-fuzzy inference system and gene expression programming intelligent methods
Affiliation(s):
1.
Department of Mining Engineering, Science and Research Branch, Islamic Azad University, Tehran, Iran; moreAffiliation(s): 1.
Department of Mining Engineering, Science and Research Branch, Islamic Azad University, Tehran, Iran; 2.
Faculty of Water and Environmental Engineering, Power and Water University of Technology, Hakimieh, Tehran, Iran; less
Danial Behnia, Kaveh Ahangari, Ali Noorzad, Sayed Rahim Moeinossadat. Predicting crest settlement in concrete face rockfill dams using adaptive neuro-fuzzy inference system and gene expression programming intelligent methods[J]. Journal of Zhejiang University Science A, 2013, 14(8): 589-602.
@article{title="Predicting crest settlement in concrete face rockfill dams using adaptive neuro-fuzzy inference system and gene expression programming intelligent methods", author="Danial Behnia, Kaveh Ahangari, Ali Noorzad, Sayed Rahim Moeinossadat", journal="Journal of Zhejiang University Science A", volume="14", number="8", pages="589-602", year="2013", publisher="Zhejiang University Press & Springer", doi="10.1631/jzus.A1200301" }
%0 Journal Article %T Predicting crest settlement in concrete face rockfill dams using adaptive neuro-fuzzy inference system and gene expression programming intelligent methods %A Danial Behnia %A Kaveh Ahangari %A Ali Noorzad %A Sayed Rahim Moeinossadat %J Journal of Zhejiang University SCIENCE A %V 14 %N 8 %P 589-602 %@ 1673-565X %D 2013 %I Zhejiang University Press & Springer %DOI 10.1631/jzus.A1200301
TY - JOUR T1 - Predicting crest settlement in concrete face rockfill dams using adaptive neuro-fuzzy inference system and gene expression programming intelligent methods A1 - Danial Behnia A1 - Kaveh Ahangari A1 - Ali Noorzad A1 - Sayed Rahim Moeinossadat J0 - Journal of Zhejiang University Science A VL - 14 IS - 8 SP - 589 EP - 602 %@ 1673-565X Y1 - 2013 PB - Zhejiang University Press & Springer ER - DOI - 10.1631/jzus.A1200301
Abstract: This paper deals with the estimation of crest settlement in a concrete face rockfill dam (CFRD), utilizing intelligent methods. Following completion of dam construction, considerable movements of the crest and the body of the dam can develop during the first impoundment of the reservoir. Although there is vast experience worldwide in CFRD design and construction, few accurate experimental relationships are available to predict the settlement in CFRD. The goal is to advance the development of intelligent methods to estimate the subsidence of dams at the design stage. Due to dam zonification and uncertainties in material properties, these methods appear to be the appropriate choice. In this study, the crest settlement behavior of CFRDs is analyzed based on compiled data of 24 CFRDs constructed during recent years around the world, along with the utilization of gene expression programming (GEP) and adaptive neuro-fuzzy inference system (ANFIS) methods. In addition, dam height (H), shape factor (Sf), and time (t, time after first operation) are also assessed, being considered major factors in predicting the settlement behavior. From the relationships proposed, the values of R2 for both equations of GEP (with and without constant) were 0.9603 and 0.9734, and for the three approaches of ANFIS (grid partitioning (GP), subtractive clustering method (SCM), and fuzzy c-means clustering (FCM)) were 0.9693, 0.8657, and 0.8848, respectively. The obtained results indicate that the overall behavior evaluated by this approach is consistent with the measured data of other CFRDs.
Darkslateblue:Affiliate; Royal Blue:Author; Turquoise:Article
Article Content
1. Introduction
In 1985, the first concrete face rockfill dam (CFRD) was constructed in California. The dam construction was followed by constructing a timber faced dumped rockfill dam that had been started in 1850 (Fell et al., 2005). Through the progress of engineering concepts and technology, this type of dam construction has become popular during recent years, especially in areas with shortage of impenetrable soil (Ozkuzukiran et al., 2006). In fact, this type of dam has been constructed for almost 150 years around the world. Over the past two decades, many of them were constructed with heights exceeding 150 m. For instance, Shuibuya, with a height of 233 m, and Mongjiadu, with a height of 179 m (both in China) are two examples (Zhou et al., 2011). China is one of the countries where CFRDs have become common, and as a result, a Chinese design code for CFRDs has been developed and is used in the field (Chinese National Committee on Large Dams, 1999). The history of construction and design of modern rockfill dams, including description of designing procedure of CFRDs, was presented by Cooke (1984). Along the same line of thought in Australia, there has been an attempt to provide the standard procedure of designing CFRDs based on the results of their own experience (Australian National Committee on Large Dams Incorporated, 1991).
One of the most common causes of dam failure is the settlement of crest and body, which leads to the formation of cracks across the body and downstream slope. These cracks increase drainage flow at the dam toe and cause instability, which is transmitted to the entire structure and eventually failure of the dam. In most of the dams, the crest settlement is not uniform, although it may be symmetrical (because the load is the maximize in axial points and reaches to zero in toes). The impact of non-uniform settlement (even if it is symmetrical) in various sectors of construction is not negligible. In conventional design procedures, the crest settlement is considered as 2% of the total height and in areas prone to earthquakes (due to earthquake effects) 1% of this amount will be added to the dam body height. However, the settlement for the entire dam crest cannot be accurately estimated (Kutzner, 1997). The crest settlement of rockfill dams will be consistently continued for a long time after construction. It is believed that a significant amount of the settlement occurs between 24–30 months after construction (Dascal, 1987). To monitor the dam, a good assessment of dam settlement after construction is required to warn the engineers against any potential problems (Habibagahi, 2002).
Considering the above discussion, it is obvious that prediction of dam crest settlement is of major importance. In most studies, one or several dams have been considered specifically to determine the influential parameters in predicting dam settlement (Park et al., 2005; Malla et al., 2007; Gikas and Sakellariou, 2008; Seo et al., 2009; Zhou et al., 2011). Based on these studies, it is noted that the dam height is the main factor in crest settlement (Kim and Kim, 2008). Among the few proposed relationships in this field, Clements (1984)’s equation was developed for the crest settlement of 68 rockfill dams after completion. He suggested an equation in the form of S=aHb, where S is the crest settlement, H is the dam height, a and b are constant numbers in which a=0.002 (at the initial impounding) and a=14×10−7 (after 10 years of operation), b=1.1 (at the initial impounding) and b=2.6 (after 10 years of operation). One of the limitations of this equation is that only one input parameter is used; however, the dam settlement prediction depends on several parameters (such as time and shape factor). As each parameter has an effect on another, the application of the empirical methods could become impractical. On the other hand, no specific relation has been developed for predicting settlement of CFRDs yet. To overcome these limitations, soft computing techniques can be used to develop a more accurate and reliable predictive method. In the present study, two intelligent methods, adaptive neuro-fuzzy inference system (ANFIS) and gene expression programming (GEP), widely used in solving complex engineering problems, have been utilized to propose new models for predicting CFRD crest settlement.
2. Intelligent methods
The dam behavior depends on many influential factors, which complicate the prediction of the settlement of dam structure. Methods derived from experimental modeling are not only time-consuming, but also do not provide reasonable estimates. Therefore, in such cases, the application of artificial intelligence based methods is recognized to be an appropriate substitute. In recent years, these methods have been widely used in problems related to geosciences and geotechnical engineering (Lazzari and Salvaneschi, 1994; Beiki et al., 2010; Fragos et al., 2010; Mollahasani et al., 2011; Mousavi et al., 2012).
2.1. Adaptive neuro-fuzzy inference system (ANFIS)
ANFIS is the integration of fuzzy logic (FL) and artificial neural network (ANN) introduced by Jang (1993). Fuzzy systems and ANNs include various advantages and disadvantages. A fuzzy system can model the qualitative aspects of human knowledge and reasoning processes, whereas it does not feature any earning capabilities. In other words, a fuzzy system cannot be trained. Nevertheless, neural networks are able to do self-training using datasets. Meanwhile, neural networks are implicit and they are unable to use human language (Kartalopoulos, 1996). To overcome these deficiencies, ANFIS has been proposed. ANFIS has the advantages of both fuzzy and neural systems (Srinivasan and Fisher, 1995; Jang and sun, 1997).
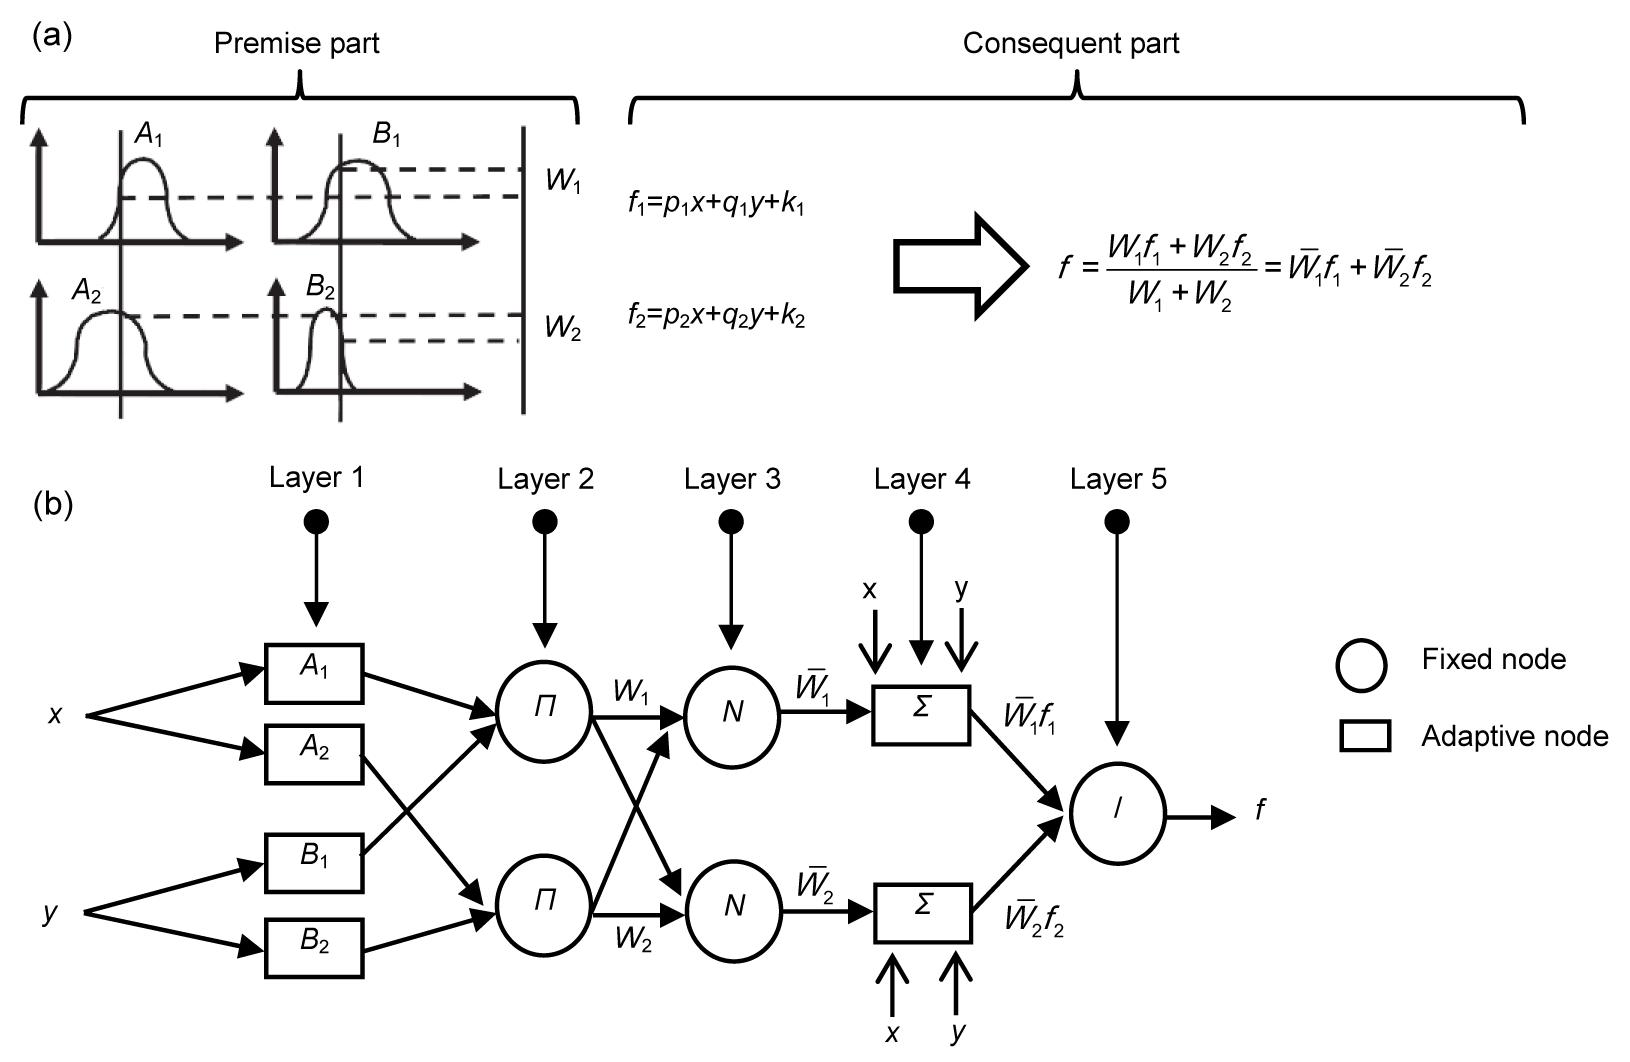
ANFIS systems are often applied in conjunction with the Takagi-Sugeno (TSK) fuzzy system. The main purpose of Takagi-Sugeno approach is to automate fuzzy modeling using measured data. In the fuzzy TSK method, for a system bearing two input parameters X and Y each describing a membership function, the following IF-THEN rules apply:
, ,
where x (or y) is the input to node, i, p, q, and k are consequence parameters resulted from the training; and A and B are labels of the fuzzy set (small, large, etc.) defined as suitable membership functions. According to Fig. 1, ANFIS process acts in five steps (Jang et al., 1997; Kayadelen, 2011; Jalalifar et al., 2011).
The basic parameters of membership functions are defined, i.e., bell-shape membership functions are described as follows:
,
where ηA is the bell-shaped membership function, and a, b, and c are parameters of the equation. Changes in each of these parameters will change bell-shape membership function symmetrically. In fact, various forms of membership functions for fuzzy sets were made. Parameters of this layer are defined as initial (or premise) parameters.
The firing strength of a rule, which represents the product of the incoming signals, is calculated by
.
The firing strength calculated in the second step is normalized using the following equation:
,
where is the normalized firing strength.
The effect of each rule on output is calculated with an adaptive node function as
,
where pi, qi, and ki are the consequence parameters.
The final output of ANFIS model is
.
Fig.1 The first-order TSK fuzzy model (a) and ANFIS architecture (b) (Jalalifar et al., 2011; Kayadelen, 2011)
In this system, training means that with the use of training data, the non-linear parameters related to the fuzzy membership functions at the first level and the linear parameters of the forth layer are determined in a way that for each desired input, a favorable output is obtained. During this fuzzy-neural process, membership function parameters are regulated through the back propagation (BP) algorithm or in combination with the least squares (LS) method (Jang et al., 1997; Demuth and Beale, 2001).
Using various methods of identification, different techniques to construct ANFIS model are available such as grid partitioning (GP), subtractive clustering method (SCM), fuzzy c-means clustering (FCM) (Jalalifar et al., 2011). In this study, to identify premise membership functions, the three aforementioned methods were used.
2.1.1. Grid partitioning (GP)
In the GP method, each part of premise variables is recommended independently (Jang, 1993). In developing this expert model, membership functions of all premise variables are defined by using previous experiences and knowledge. Membership functions are designed to provide the concept of linguistic terms in a specific content. In most systems, no specific knowledge is available for these partitions. In these cases, domains of premise variable can simply be partitioned into a number of equally-spaced and equally-shaped membership functions. Using available input-output data, parameter of membership function can be optimized (Jalalifar et al., 2011).
2.1.2. Subtractive clustering method (SCM)
The SCM is a modified form of the mountain, originally introduced by Chiu (1994). When there is no clear view of the number of clusters that should be specified for data collection, this algorithm will be a fast method for finding the number of clusters and also its centers (MATLAB User’s Guide, 2006). This method assumes that each data will be analyzed as a clustering center (Delmirli and Muthukumaran, 2000). The point that has the maximum number of neighbors is selected as the cluster center. The data will be placed within a circle with a fuzzy radius. The algorithm will search for a new point between the points with more neighbors. Then, by finding a new point, other points with fewer neighbors will be ignored. This procedure continues until all points are tested. In this method, the smaller radius clustering increases the rules and clusters, and vice versa (MATLAB User’s Guide, 2006).
2.1.3. Fuzzy c-means clustering (FCM)
The FCM is the most common method of fuzzy clustering. This method will place the data in groups, based on their degree of membership. This method was introduced by Bezdek (1981) and, in fact, is an optimized method of clustering such as the K-means method (Dave and Krishnapuram, 1997; Chintalapudi and Kam, 1998).
Generally, in systems where no certain knowledge is available for recognizing membership functions, these functions are defined for all primary variables using previous experiences. Therefore, the GP method is utilized to meet the requirements. But the aim of clustering method is to categorize the huge data sets and to provide a simple representation of system behavior. In case the number of clusters is unknown, by using the SCM, the number and center of clusters can be found quickly. In the FCM method, which is proposed to improve SCM performance, the data are classified into pertinent groups based on their degrees of membership.
2.2. Gene expression programming (GEP)
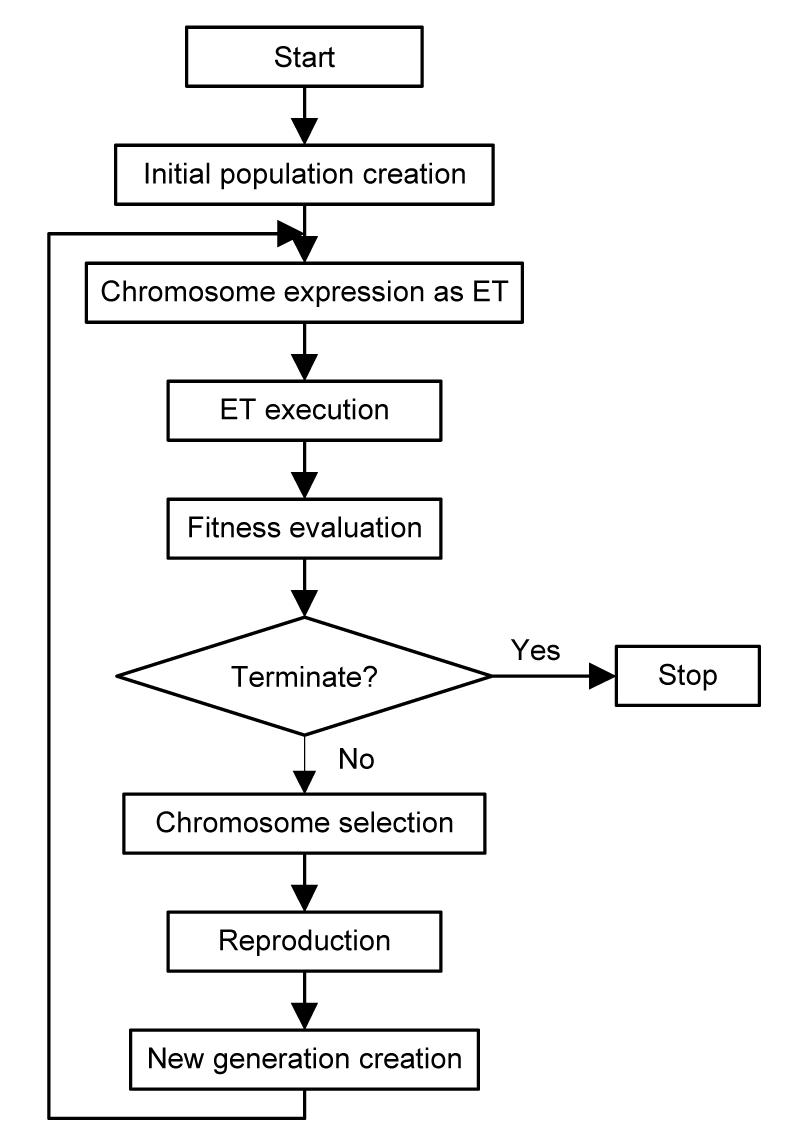
Ferreira (2001) proposed for the first time an algorithm based on genetic algorithms (GAs) and genetic programming that was called gene expression programming (GEP) (Kayadelen, 2011). GEP is a new evolutionary algorithm that has been established to overcome many limitations of GA and genetic programming (Teodorescu and Sherwood, 2008; Kayadelen, 2011). GA is a machine learning model, inspired from the behavior evolution mechanism of nature (Sivanandam and Deepa, 2008). However, genetic programming was presented to automate programming and induction and was introduced by Koza (1992) after testing on the symbolic regression. Genetic programming can be viewed as a special type of GAs, where the size of chromosomes will be modified and changed by genetic operators. The genetic programming can be considered as a subset of GAs. The main difference between GA and genetic programming is that development programs in the second subset are as parse trees, but in the first subset it is a binary string of fixed length. GEP can be considered a new subset genetic programming, and the differences between these two are the ways of providing solutions. GEP has two main parts called chromosomes and expression tree (ET) (Ferreira, 2001; Kayadelen, 2011). Any mathematical information is coded in gene in chromosomes by way of bilingual and conclusive language called Karva Language (the language of the genes), and also is translated to the ETs by means of the language of ET (Kayadelen, 2011). Fig. 2 demonstrates the GEP algorithm that the selected process starts with five elements such as: function set, terminal set, fitness function, control parameters, and stop conditions (Teodorescu and Sherwood, 2008).
Fig.2 The algorithm of GEP (Teodorescu and Sherwood, 2008)
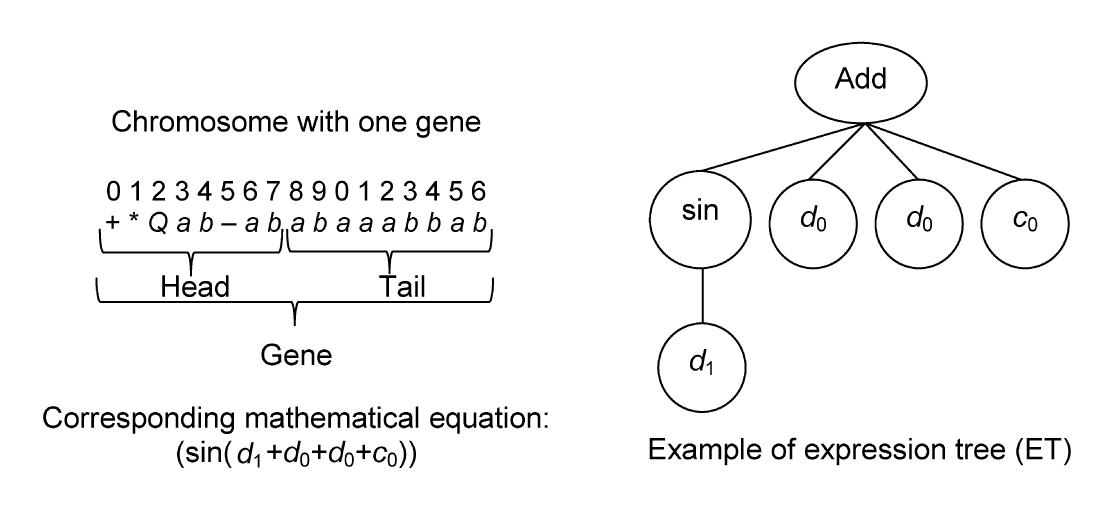
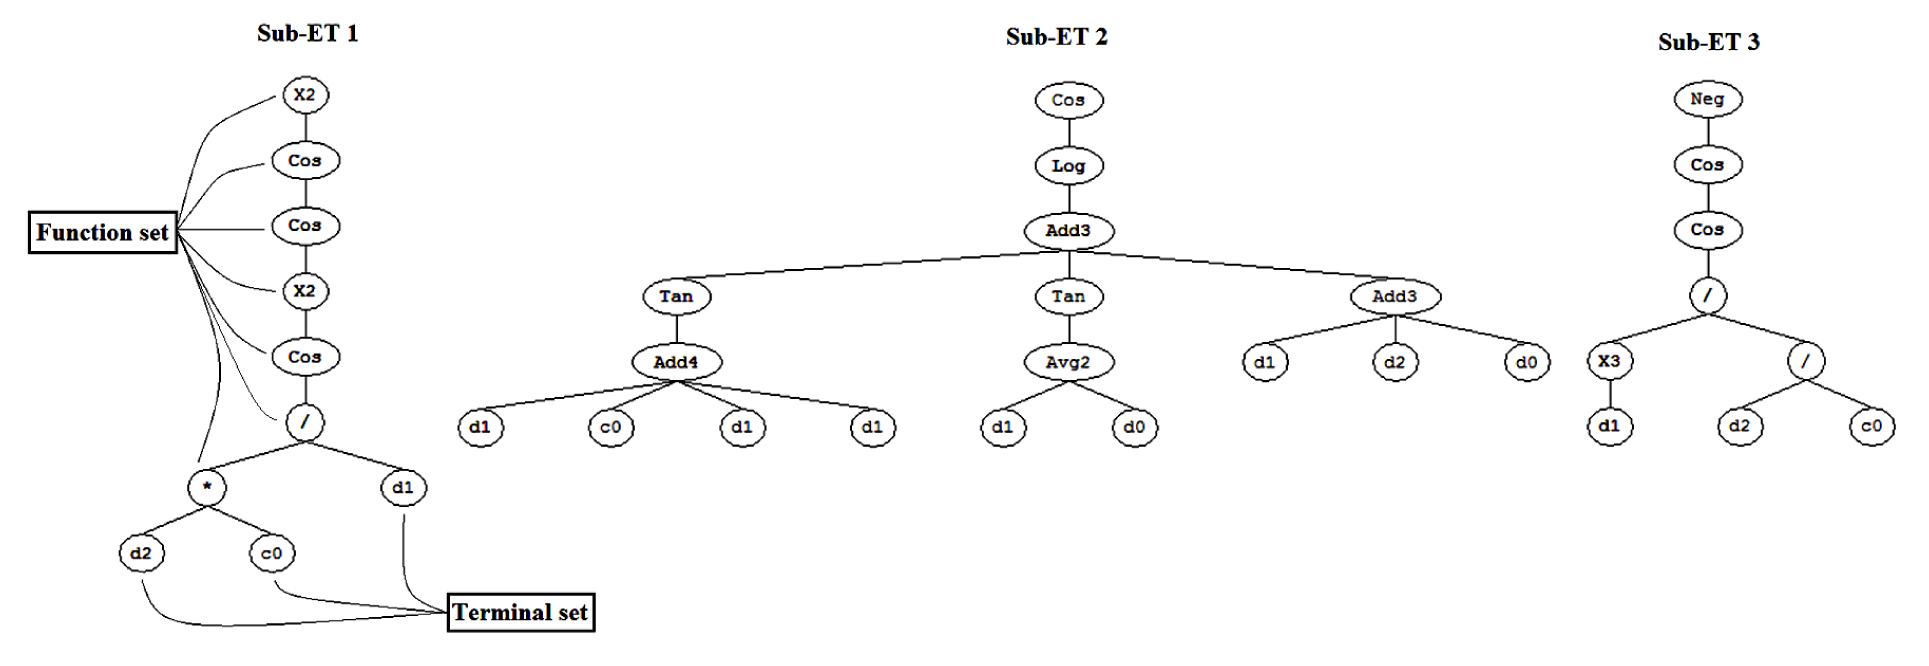
In this method, a mathematical function is defined as a chromosome including many genes, which is extended using the provided data. In GEP, it is encoded as simple strings of fixed-length which are subsequently expressed as ETs of different sizes and shapes. This algorithm randomly builds an initial chromosome, which indicates a mathematical function. Then, it is converted into an ET. In other words, this method creates a fixed-length string character to provide solutions. These solutions are tree-like structures, and these ETs can be written as mathematical functions. Each ET consists of two parts called ‘function set and terminal set’ (an example as shown in Fig. 3 (Kayadelen, 2011)). Then the next step is to compare predicted results with real values. The GEP process will stop if the error is in agreement with error standards that have been initially specified. If the error standards cannot be met, some of the chromosomes will be selected by roulette wheel sampling selection to find a new chromosome and mutation will occur (Kayadelen, 2011).
Fig.3 Schematic of a chromosome with one gene and its expression tree and corresponding mathematical equation (Kayadelen, 2011)
GEP has four main operators, including: selection, mutation, transposition, and crossover. Selection operator is responsible for selecting chromosome using roulette wheel sampling method with elitism to determine probability of producing offspring. In encoding sequence the chosen chromosome will change by mutation operator or in other words the selected chromosome will mutate. Transposition operator will duplicate a part of the chromosomes accidentally and put it in another location. Then coding in chromosomes (which are chosen randomly) will change through (crossover) combining. This is the base of GEP function (Ferreira, 2006). The rate of the operator is determined by users before analysis. The mutation rates are usually between 0.1 and 0.01. It also recommended that the rate of crossover and transposition be considered 0.1 and 0.4.
3. Database
The information of 24 CFRD has been used in this research, based on the information of previous studies in different regions of the world. The specifications of these dams are given in Table 1 (Kim and Kim, 2008).
Table 1
Specifications of some CFRDs used in this study (Kim and Kim, 2008)
No.
Dam name
Country
Dam height (m)
Dam shape factor, A/H2
Time (year)
Dam crest settlement (m)
Application type
1
Golillas
Colombia
127
0.9
7
0.057
Training
2
Foz do Areia
Brazil
160
5.4
20
0.21
Training
3
Mangrove creek
Australia
80
4.5
4
0.084
Training
4
Tullabardine
Australia
26
8.1
12.8
0.019
Training
5
Murchison
Australia
94
1.9
18
0.082
Training
6
Bastyan
Australia
75
3.4
9
0.053
Training
7
Salvajina
Columbia
154
2.4
7.5
0.09
Training
8
Shiroro
Nigeria
125
4.2
1.8
0.166
Training
9
Lower Pieman
Australia
122
2.5
15
0.221
Training
10
Chengbing
China
74.6
2.8
10
0.1
Training
11
White Spur
Australia
43
2.3
5.9
0.058
Training
12
Xibeikou
China
95
3.3
6
0.061
Training
13
Crotty
Australia
83
1.9
9
0.056
Training
14
Segredo
Brazil
145
4.1
8
0.229
Training
15
Buan
Korea
50
7.3
11
0.204
Training
16
Yongdam
Korea
70
8.8
6
0.123
Training
17
Sancheong (L)
Korea
70.9
6.3
6
0.087
Training
18
Sancheong (U)
Korea
86.9
3.1
6
0.3
Training
19
Daegok
Korea
52
3.7
1
0.019
Training
20
Dongbok
Korea
44.7
3.5
7
0.043
Test
21
Mackintosh
Australia
75
4.9
19
0.235
Test
22
Miryang
Korea
89
6.8
6
0.088
Test
23
Alto Anchicaya
Columbia
140
1.1
10
0.173
Test
24
Aguamilpa
Mexico
187
3.9
7
0.34
Test
In order to simulate the settlement prediction, data was divided into training and test sets. 80% (19 sets of data) were used for training and 20% (five sets of data) were used for the test. We attempted to select the test data that includes various dam heights, and then obtained simulating can be applicable in various heights. Three input parameters used were height (H), shape factor (Sf), and time (t), in the prediction of dam crest settlement (CSCFRD). The complete information and the range of each parameter is presented in Table 2.
Table 2
Range of different parameters used in this study
H (m)
Sf
t (year)
CSCFRD (m)
Parameter type
Input (independent)
Input (independent)
Input (independent)
Output (dependent)
Minimum
26
0.9
1
0.019
Maximum
187
8.8
20
0.34
Mean
94.546
4.046
8.875
0.129
Variance
1743.727
4.56
24.729
0.008
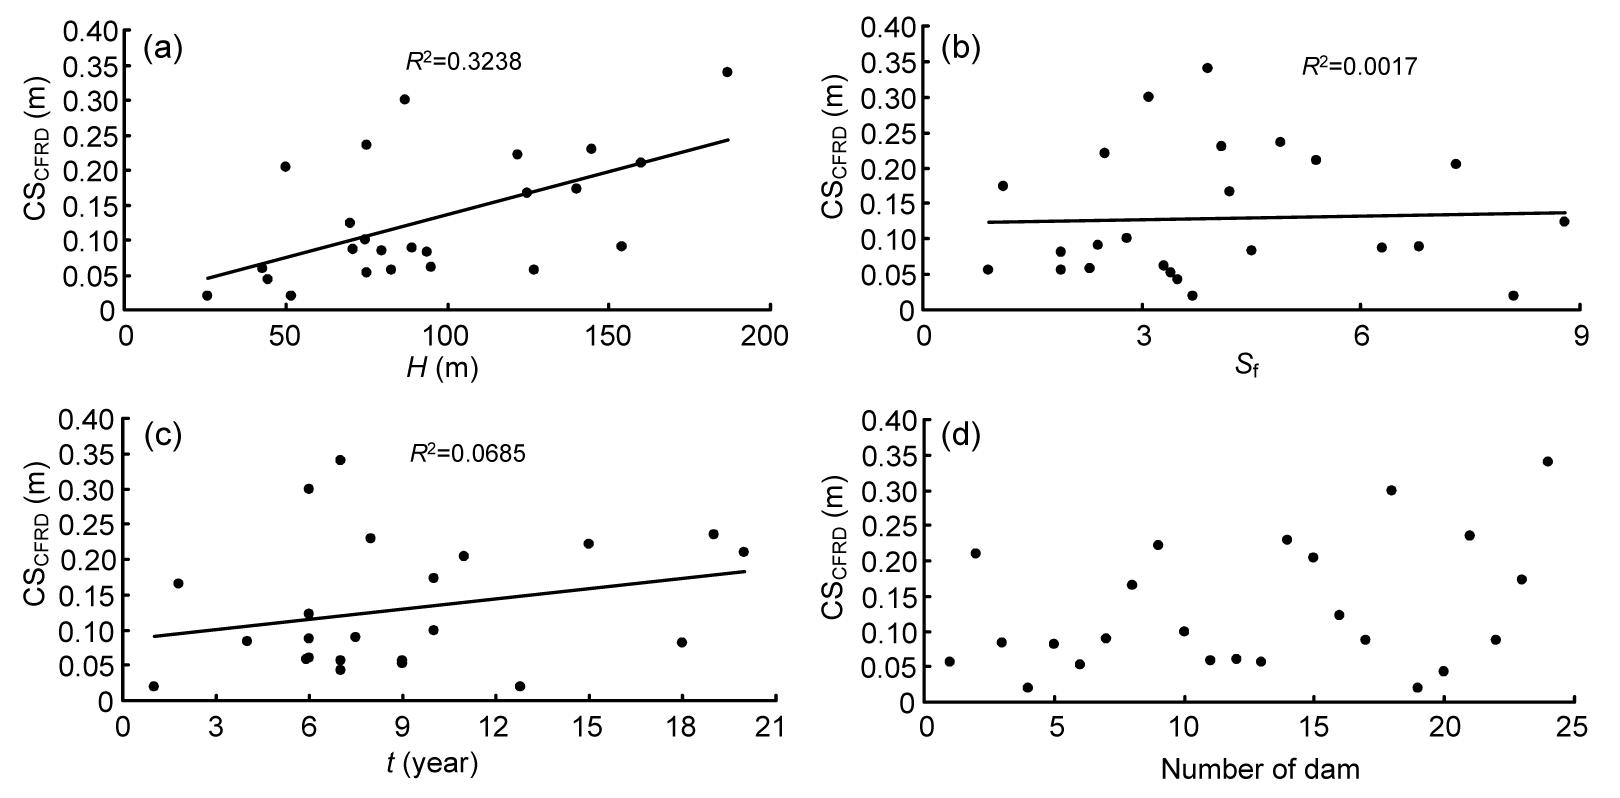
Several parameters, such as height of dam, condition of the foundations, dam shape, duration of impounding, and geo-mechanical parameters of rock fills are considered influential in settlement. All of the available relations in predicting settlement of embankment dams depend on a single factor, namely the dam height. Since only the three parameters, dam height, time, and shape factor are common in all CFRDs, they have been selected as inputs (Fig. 4).
Fig.4 Cross plots of the relationship between crest settlement (CSCFRD) and independent variables (a) Dam height; (b) Shape factor; (c) Time; (d) Number of dam
Four statistical evaluation criteria were used to assess the performances of the applied intelligent methods. These criteria are mean absolute error (MAE), standard deviation (σ), root mean square error (RMSE), and determination of the coefficient (R2), respectively, given by Eqs. (8)–(11) (Kayadelen, 2011; Mousavi et al., 2012; Ozcan, 2012).
,
,
,
,
where r is the actual value and p is the predicted value, and are the mean of actual and predicted values, respectively, e is the absolute error (ri−pi), is the mean of absolute error , and n is the number of data sets.
4. Predicting dam settlement using two intelligent methods
4.1. Predicting dam settlement using ANFIS method
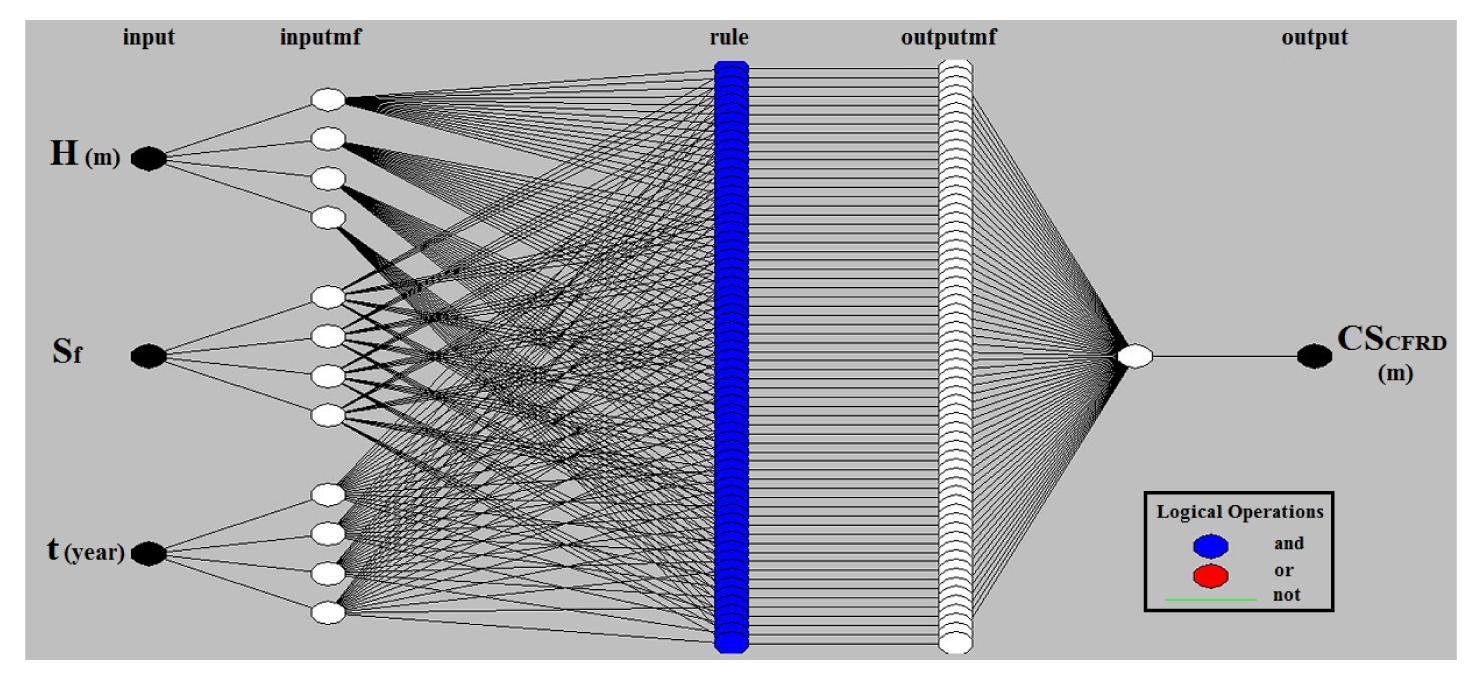
In this research, MATLAB software has been used for ANFIS modeling. To predict the dam crest settlement, three ANFIS methods (GP, SCM, and FCM) were employed. Before modeling, in order to reduce the range of input and output parameters, all parameters were normalized in [−1, 1] interval. The training phase was completed with 19 data sets while the remaining 5 sets of raw data were applied for validation of ANFIS models. The RMSE rate has been used as a criterion for evaluation and comparison. In Tables 3–5 the results of each method to achieve the best ANFIS structure have been specified. By using the trial-and-error method, and according to the RMSE, the appropriate model was selected. Based on the GP results presented in Table 3, the third row has the minimum rate of RMSE. This ANFIS model has four membership functions (Gaussian2), parameters of which have been optimized by the hybrid algorithm (combination of BP and least squares). The system consists of five layers and 64 IF-THEN rules, which connect to each other by AND operator as displayed in Fig. 5 (p.597).
Table 3
Effect of different parameters on crest settlement ANFIS model (GP) and RMSE of each model
Model number
Number of membership functions
Membership function type
Epochs
Optimize method
Number of fuzzy rules
RMSE
1
4
Trapezoidal
57
Hybrid
64
0.0550
2
4
Trapezoidal
84
BP
64
0.0741
3
4
Gaussian2
38
Hybrid
64
0.0510
4
4
Gaussian2
46
BP
64
0.0940
5
3
Gaussian
119
Hybrid
27
0.0629
6
3
Gaussian
250
BP
27
0.0773
7
4
Pi
61
Hybrid
64
0.0542
8
4
Pi
280
BP
64
0.0952
9
4
DSigmoid
120
Hybrid
64
0.0557
10
4
DSigmoid
60
BP
64
0.0931
11
4
PSigmoid
120
Hybrid
64
0.0557
12
4
PSigmoid
60
BP
64
0.0931
13
5
Triangular
20
Hybrid
125
0.0543
14
5
Triangular
1000
BP
125
0.0624
15
3
Gbell
40
Hybrid
27
0.0567
16
3
Gbell
220
BP
27
0.0805
Fig.5 ANFIS structure made by GP method to predict CSCFRD based on three input parameters (height, shape factor, and time)
Furthermore, in ANFIS model, after 64th epochs of training, testing phase RMSE of the model reached its minimum value (0.0510). The value of R2 is between the predicted and real rate of crest dam settlement for test data, which is equal to 0.9693 (Fig. 6a).
Fig.6 Coefficient of determination between real values of dam crest settlement and predictions of ANFIS (a) Grid partitioning (GP); (b) Subtractive clustering methods (SCM); (c) Fuzzy c-means clustering (FCM)
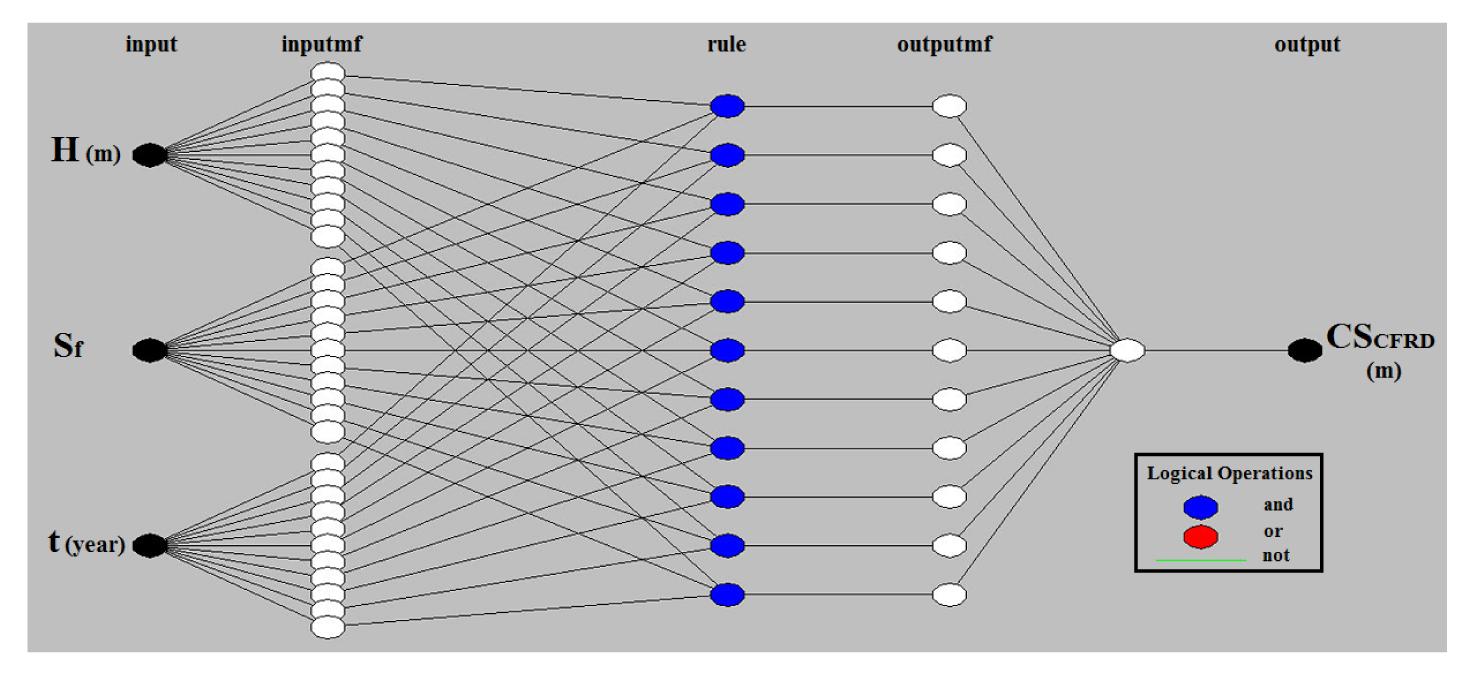
Table 4 shows the results of the second ANFIS (SCM) model based on different parameters. According to the RMSE rate, the most appropriate result is in row number 10. The cluster radius of this model is 0.56 and it is formed of 11 rules. The structure of the present model is given in Fig. 7. After 13th epochs of training, the RMSE of the testing phase reached its minimum value (0.0553). The value of R2 is between the predicted and real rate of crest dam settlement for test data, which is equal to 0.8657 (Fig. 6b).
Table 4
Effect of different parameters on crest settlement ANFIS model (SCM) and RMSE of each model
Model number
Radius
Membership function type
Epochs
Optimize method
Number of fuzzy rules
RMSE
1
0.1
Gaussian
140
Hybrid
19
0.1280
2
0.2
Gaussian
540
Hybrid
19
0.0969
3
0.3
Gaussian
100
BP
19
0.1188
4
0.35
Gaussian
60
Hybrid
16
0.1054
5
0.4
Gaussian
20
Hybrid
15
0.0878
6
0.43
Gaussian
20
Hybrid
14
0.0567
7
0.45
Gaussian
20
Hybrid
13
0.0642
8
0.5
Gaussian
20
Hybrid
12
0.0611
9
0.55
Gaussian
20
Hybrid
11
0.0565
10
0.56
Gaussian
13
Hybrid
11
0.0553
11
0.56
Gaussian
100
BP
11
0.1709
12
0.6
Gaussian
15
Hybrid
9
0.0703
13
0.7
Gaussian
1000
Hybrid
5
0.1742
14
0.8
Gaussian
50
Hybrid
3
0.1184
15
0.9
Gaussian
50
Hybrid
3
0.1144
16
1
Gaussian
50
Hybrid
3
0.1630
Fig.7 ANFIS structure built using SCM method to predict CSCFRD based on three input parameters (height, shape factor, and time)
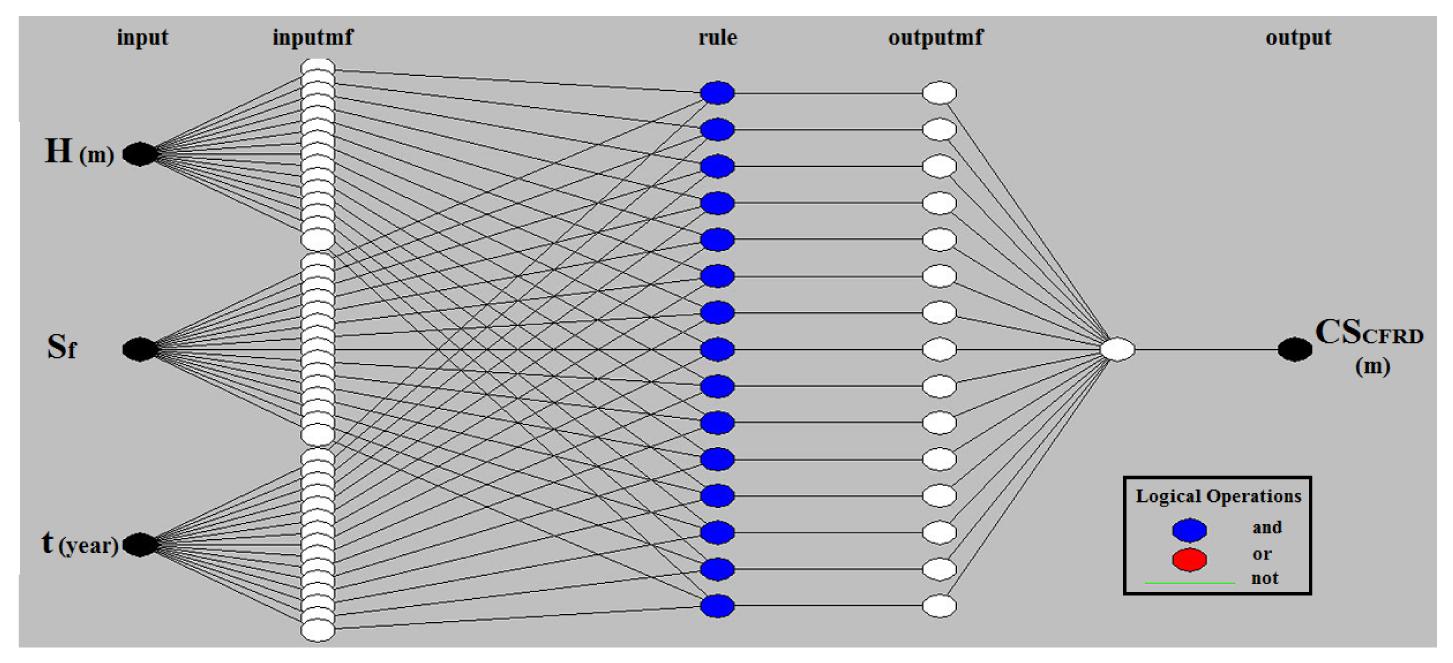
In the third ANFIS model, which uses FCM, the optimum structure is shown in row 12 of Table 5. Fifteen Gaussian membership functions with application of hybrid method in the 100th epochs created the minimum value of RMSE for the test data. RMSE and R2 values of this model are 0.0430 and 0.8848, respectively (Table 5 and Fig. 6c). ANFIS current structure has 15 rules. The structure has been demonstrated in Fig. 8. Table 6 can be proposed to indicate the overall results and the specifications of ANFIS three models. In this table, other characteristics of models, such as the number of linear and nonlinear parameters, are also shown.
Table 5
Effect of different parameters on crest settlement ANFIS model (FCM) and RMSE of each model
Model number
Number of n-cluster
Membership function type
Epochs
Optimize method
Number of fuzzy rules
RMSE
1
2
Gaussian
60
Hybrid
2
0.1053
2
4
Gaussian
60
Hybrid
4
0.1335
3
6
Gaussian
100
Hybrid
6
0.1071
4
8
Gaussian
50
Hybrid
8
0.1111
5
10
Gaussian
100
Hybrid
10
0.0467
6
10
Gaussian
300
BP
10
0.0776
7
11
Gaussian
100
Hybrid
11
0.0532
8
12
Gaussian
100
Hybrid
12
0.0555
9
13
Gaussian
300
Hybrid
13
0.0617
10
14
Gaussian
100
Hybrid
14
0.0510
11
14
Gaussian
200
BP
14
0.0642
12
15
Gaussian
100
Hybrid
15
0.0430
13
15
Gaussian
100
BP
15
0.0650
14
16
Gaussian
100
Hybrid
16
0.0603
15
17
Gaussian
120
Hybrid
17
0.0672
16
18
Gaussian
120
Hybrid
18
0.0889
Fig.8 ANFIS structure built using FCM method to predict CSCFRD based on three input parameters (height, shape factor, and time)
Table 6
Different parameter types and their values used for the prediction of CSCFRD ANFIS model
ANFIS parameter type
Grid partitioning (GP)
Sub clustering method (SCM)
Fuzzy c-means (FCM)
Number of membership functions
4
11
15
Membership function type
Gaussian2
Gaussian
Gaussian
Output membership function
Linear
Linear
Linear
Optimize method
Hybrid
Hybrid
Hybrid
Epochs
38
13
100
Number of nodes
158
94
126
Number of linear parameters
256
44
60
Number of nonlinear parameters
48
66
90
Total number of parameters
304
110
150
Number of fuzzy rules
64
11
15
Number of training data pairs
19
19
19
Number of testing data pairs
5
5
5
Test results
RMSE
0.0510
0.0553
0.0430
σ
0.0457
0.0445
0.0407
MAE
0.0342
0.0425
0.0341
R2
0.9693
0.8657
0.8848
4.2. Predicting dam crest settlement using GEP method
In this study, the software GeneXProTools 4.0 was used to employ the GEP method. To obtain the most appropriate model for solving the problem, a series of adjustments made in the software were undertaken (Table 7). Determining the number of genes is one of the most important issues, affecting the accuracy and application of the model (the decrease or increase of the number of genes may lower the precision of the obtained equation or prolong it). According to the above conditions, only three genes were used. To communicate between the mapping functions, each ET of a function is used to connect models with more than one gene in order to calculate the final mapping function, which is composed of several genes (these adjustments are obtained from the trial-and-error method).
Using the 19 sets of data (80%), two equations are obtained based on three input parameters (dam height (H), shape factor (Sf), and time (t)) to predict dam crest settlement (CSCFRD). Eq. (12) has the constant, while Eq. (13) is without constant.
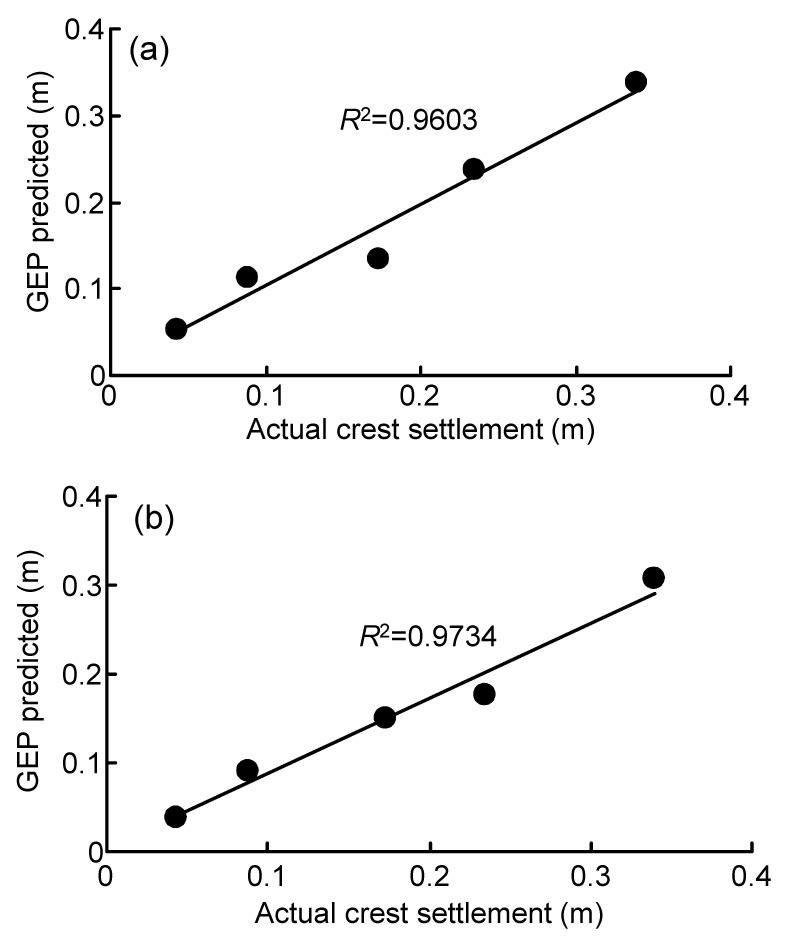
Five sets of data (20%) were used for the evaluation. The values of R2 for the real dam crest settlement and GEP prediction (with and without constant) are 0.9603 and 0.9734, respectively (Fig. 10). Survey results to predict CSCFRD are also demonstrated in Table 8. Note that Eq. (12) (with constant) has a better performance in predicting CSCFRD.
Fig.10 Coefficients of determination between real values of dam crest settlement and predictions of the GEP (a) With constant (Eq. (12)); (b) Without constant (Eq. (13))
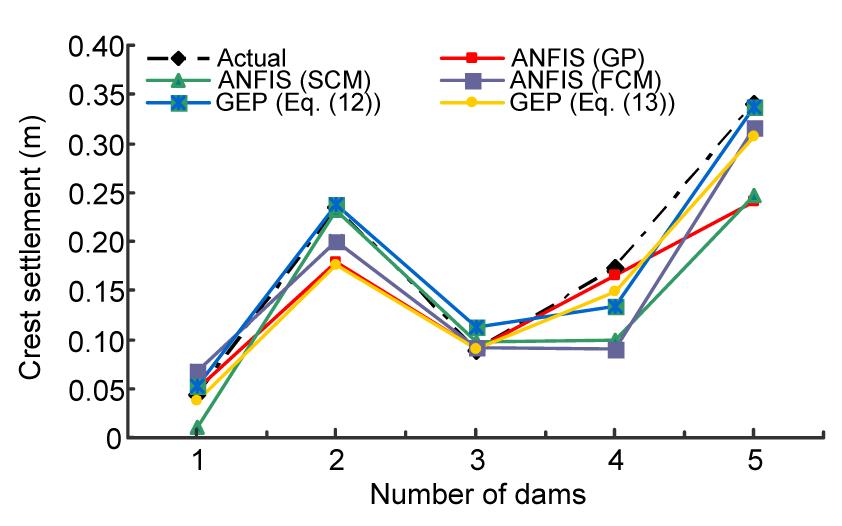
Fig. 11 compares the predictions of all the two methods (ANFIS-based models and GEP-based models) for the test data at a glance. According to Fig. 11, the values predicted by these methods are very close to the real ones of the dam settlement. Proximity or overlapping of the lines shows that, the predictions of intelligent methods are well adapted to the real values. Meanwhile, there are some areas that have relatively large errors (especially in predicting fourth sets of data). High correlation coefficients and low error rates mean that both intelligent methods are excellent methods in modeling such behavior.
Fig.11 Comparing the real of crest settlement and predicted intelligent models ANFIS (GP, SCM, and FCM) and GEP (Eq. (12) (with constant number) and Eq. (13) (without constant number))
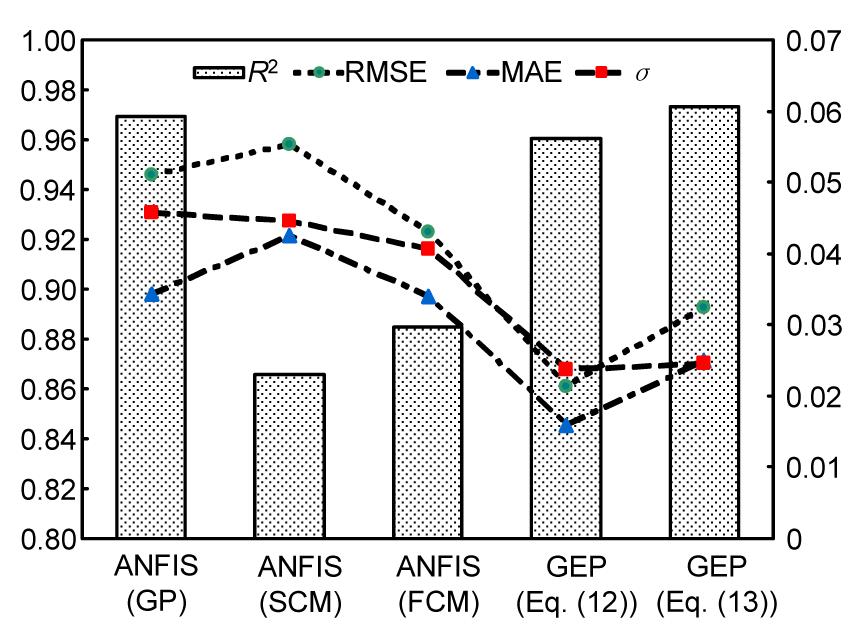
Error values (RMSE, MAE, and σ) and correlation of coefficient (R2) of all intelligent methods are shown in Fig. 12. This figure displayed results of ANFIS model (GP, SCM, and FCM) and GEP equations (with and without constant). The rate of error in the GEP method was less than ANFIS and also the value of R2 was larger in the GEP method. For ANFIS, the SCM method has more errors and lower R2 values than other methods (GP and FCM). Comparing GP with FCM, although GP has higher R2, the error rate of GP (RMSE, MAE, and σ) is larger than that of FCM. Note that the value of R2 is more definitely that cannot assurance the appropriate results. Therefore, RMSE and MAE should also be considered. Comparing results of Eq. (12) with Eq. (13), it is found that Eq. (13) has a higher R2 but the rate of error is far more, which has a better performance.
Fig.12 Comparing the rate of R2, RMSE, MAE and σ for predicting crest settlement using ANFIS (GP, SCM and FCM) and GEP (Eq. (12) (with constant number) and Eq. (13) (without constant number))
Therefore, the preferred predicting results are GEP (Eq. (12)), GEP (Eq. (13)), FCM, GP, and SCM. On the other hand, unlike GEP, ANFIS does not provide a specific equation, and its development is just a coding in MATLAB software that will not be applicable as GEP method for further use. Thus, GEP had a better performance than ANFIS.
It is noteworthy that a particular equation to predict the CFRD crest settlement has not been provided. As the only equation to predict rockfill dams crest settlement is the Clements (1984)’s equation, its constants in different conditions are given in Table 9.
Table 9
Constants of Clements (1984)’s equation in different conditions
Condition
a
b
At initial impounding
0.002
1.1
After 10 years of operation
2.6
0.0000014
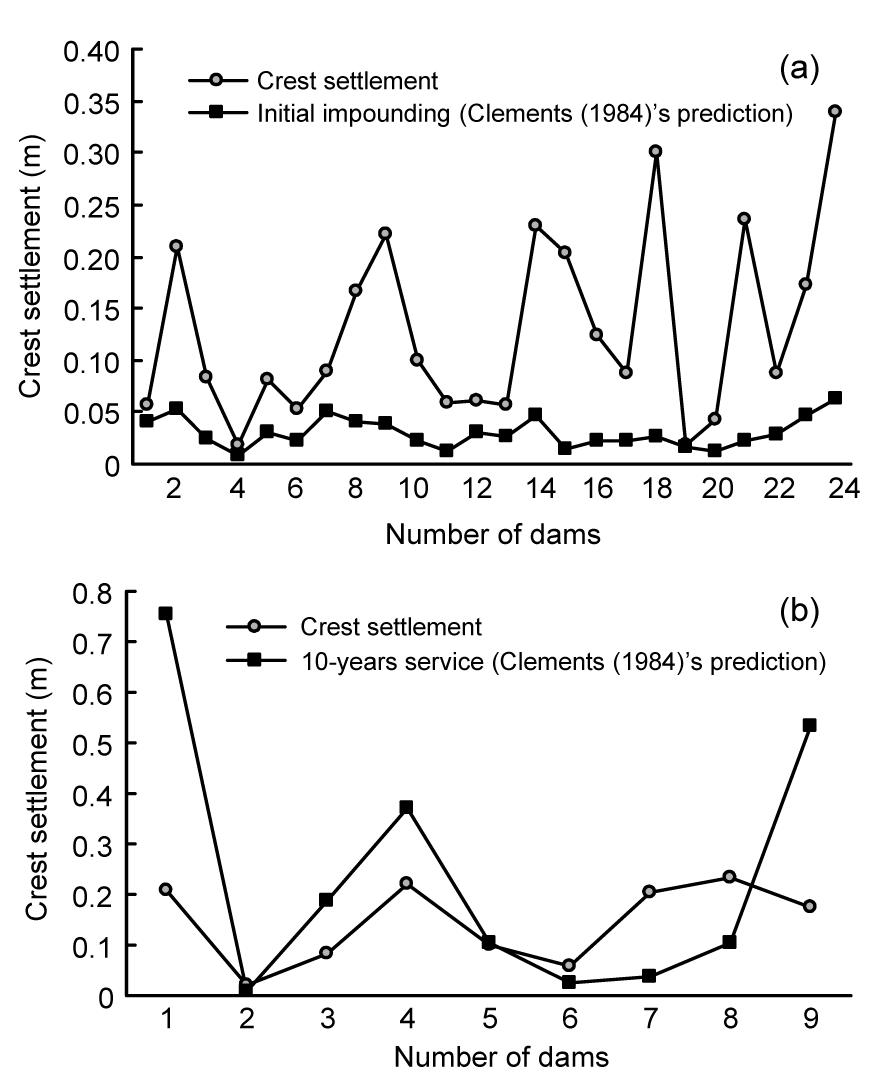
Based on the parameters given in Table 9 for the case of an initial impounding and using the equation S=0.002H1.1, R2 equals 0.3255. For the second case (10 years after operation), the data pertinent to dams under 10 years of life must be removed first. Consequently, only nine dams remain, and the value of R2 from Clements (1984)’s equation (S=0.0000014H2.6) will be equal to 0.2541. Fig. 13 illustrates the amount of accuracy of Clements’s prediction for both cases, in comparison to the real CSCFRD.
Fig.13 Comparison of the real and computed values by Clements (1984)’s equation (a) At initial impounding; (b) After 10-years service
The two mentioned models indicate that Clements (1984)’s equation lacks the appropriate accuracy for these kinds of dams. In addition, another deficiency is the dependency of this equation to a single parameter, i.e., the height of dam. Increasing the number of input parameters will involve more effective parameters, so the results will be more practical and more reliable. Finally, the presented equations (Eqs. (12) and (13)), together with the appropriate number of inputs, are more accurate in predicting crest settlements of these types of dams (CFRDs) compared to other methods (e.g., empirical methods).
6. Conclusions
CFRDs are now being considered as an alternative at most sites to the embankment and rockfill dams, largely due to the cost and construction schedule. Numerous CFRDs are presently under construction throughout the world, and their popularity is increasing. In the present research, in order to predict the CFRD crest settlement, two approaches using ANFIS and GEP models were used, along with the data of all 24 dams. ANFIS includes FCM, SCM, and GP methods. Furthermore, two equations (with and without a constant) were proposed in the GEP models. Parameters such as H (dam height), Sf (dam shape factor), and t (time after first operations) were considered as input parameters. For modeling, data of 24 CFRDs were compiled from reliable sources from seven countries around the world such that 80% of data were employed for training, and the remaining (20%) were used for test (validation) of the models. Results of both intelligent methods were good in predicting the settlement. However, the results of GEP were more reasonable than the ANFIS method. To conclude, this study indicates that intelligent methods are an appropriate tool for solving problems with complex mechanisms and multiple influential factors. These methods have no restrictions on the number of input parameters to predict the behavior of dams. It is noteworthy that the presented intelligent models could reveal the relation between input parameters and their effects on outputs, and have the ability to intelligently generalize the new data.
References
[1] Australian National Committee on Large Dams Incorporated, 1991. Guidelines on Concrete-faced Rockfill Dams, Available from
http://www.ancold.org.au, Sydney, Australia :
[2] Beiki, M., Bashari, A., Majdi, A., 2010. Genetic programming approach for estimating the deformation modulus of rock mass using sensitivity analysis by neural network. International Journal of Rock Mechanics & Mining Sciences, 47(7):1091-1103.
[3] Chinese National Committee on Large Dams, 1999. Design Code for CFRDs. , (in Chinese), Beijing, China :
[4] Chintalapudi, K.K., Kam, M., 1998. A Noise Resistant Fuzzy C-means Algorithm for Clustering. , IEEE Conference on Fuzzy Systems Proceeding, 2327-2330. :2327-2330.
[5] Chiu, S.L., 1994. Fuzzy model identification based on cluster estimation. Journal of Intelligent & Fuzzy Systems, 2:267-278.
[6] Clements, R.P., 1984. Post-construction deformation of rockfill dams. Journal of Geotechnical Engineering, 110(7):821-840.
[7] Cooke, J.B., 1984. Progress in rockfill dams (18th Terzaghi lecture). ASCE Journal of Geotechnical Engineering, 110(10):1383-1414.
[8] Dascal, O., 1987. Postconstruction deformations of rockfill dams. Journal of Geotechnical Engineering, 113(1):46-59.
[9] Dave, R.N., Krishnapuram, R., 1997. Robust clustering methods: a unified view. IEEE Transactions on Fuzzy Systems, 5:270-293.
[10] Delmirli, K., Muthukumaran, P., 2000. Higher order fuzzy system identification using subtractive clustering. Journal of Intelligent and Fuzzy Systems, 9:129-158.
[11] Demuth, H., Beale, M., 2001. Neural Network Toolbox for Use with MATLAB. The MathWorks Inc,Natick, MA :840
[12] Fell, R., MacGregor, P., Stapledon, D., 2005. Geotechnical Engineering of Dams. Taylor & Francis Group plc,London, UK :
[13] Ferreira, C., 2001. Gene expression programming: a new adaptive algorithm for solving problems. Complex System, 13(2):87-129.
[14] Ferreira, C., 2006. Gene Expression Programming (Mathematical Modeling by an Artificial Intelligence). Springer-Verlag,Berlin Heidelberg :55-56.
[15] Fragos, K., Kealy, A., Gikas, V., 2010. Dynamic Modeling for Land Mobile Navigation Using Low-cost Inertial Sensors and Least Squares Support Vector Machines Learning. ION/GNSS,Portland, OR :1687-1696.
[16] Gikas, V., Sakellariou, M., 2008. Settlement analysis of the Mornos earth dam (Greece): Evidence from numerical modeling and geodetic monitoring. Engineering Structures, 30(11):3074-3081.
[17] Habibagahi, G., 2002. Post-construction settlement of rockfill dams analyzed via adaptive network-based fuzzy inference systems. Computers and Geotechnics, 29(3):211-233.
[18] Jalalifar, H., Mojedifar, S., Sahebi, A.A., Nezamabadi-pour, H., 2011. Application of the adaptive neuro-fuzzy inference system for prediction of a rock engineering classification system. Computers and Geotechnics, 38(6):783-790.
[19] Jang, J.S.R., 1993. ANFIS: Adaptive-network-based fuzzy inference systems. IEEE Transactions on Systems, Man, and Cybernetics, 23(3):665-685.
[21] Jang, J.S.R., Sun, C.T., Mizutani, E., 1997. Neuro-fuzzy and Soft Computing a Computational Approach to Learning and Machine Intelligence, Prentice Hall,:640
[22] Kartalopoulos, S.V., 1996. Understanding Neural Networks and Fuzzy Logic, Basic Concepts and Applications, Wiley-IEEE, Press,:
[23] Kayadelen, C., 2011. Soil liquefaction modeling by genetic expression programming and neuro-fuzzy. Expert Systems with Applications, 38(4):4080-4087.
[24] Kim, Y.S., Kim, B.T., 2008. Prediction of relative crest settlement of concrete-face rockfill dams analyzed using an artificial neural network model. Computer and Geotechnics, 35(3):313-322.
[25] Koza, J., 1992. On the Programming of Computers by Means of Natural Selection. Genetic Programming, MIT Press,Cambridge, MA :
[26] Kutzner, C., 1997. Earth and Rockfill Dams (Principles of Design and Construction), A.A.Balkema/Rotterdam/Brookfield,:
[27] Lazzari, M., Salvaneschi, P., 1994. Improved Monitoring and Surveillance through Integration of Artificial Intelligence and Information Management Systems. , Proceedings of the Tenth IEEE Conference on Artificial Intelligence for Applications, San Antonio, Texas, :
[28] Malla, S., Wieland, M., Straubhaar, R., 2007. Assessment of Long-term Deformations of Ataturk Dam. , 1st National Symposium and Exposition on Dam Safety, Ankara, Turkey, :
[30] Mollahasani, A., Alavi, A.H., Gandomi, A.H., 2011. Empirical modeling of plate load test moduli of soil via gene expression programming. Computers and Geotechnics, 38(2):281-286.
[31] Mousavi, S.M., Aminian, P., Gandomi, A.H., Alavi, A.H., Bolandi, H., 2012. A new predictive model for compressive strength of HPC using gene expression programming. Advances in Engineering Software, 45(1):105-114.
[32] Ozcan, F., 2012. Gene expression programming based formulations for splitting tensile strength of concrete. Construction and Building Materials, 26(1):404-410.
[33] Ozkuzukiran, S., Ozkan, M.Y., Ozyazicioglu, M., Yildiz, G.S., 2006. Settlement behaviour of a concrete faced rockfill dam. Geotechnical and Geological Engineering, 24(6):1665-1678.
[34] Park, H.G., Kim, Y.S., Seo, M.W., Lim, H.D., 2005. Settlement behavior characteristics of CFRD in construction period-case of Daegok Dam. Journal of the KGS, 21(7):91-105.
[35] Seo, M.W., Ha, I.S., Kim, Y.S., Olson, S.M., 2009. Behavior of concrete-faced rockfill dams during initial impoundment. Journal of Geotechnical and Geoenvironmental Engineering, 135:1070-1081.
[37] Srinivasan, K., Fisher, D., 1995. Machine learning approaches to estimating software development effort. IEEE Transactions on Software Engineering, 21(2):126-137.
[38] Teodorescu, L., Sherwood, D., 2008. High energy physics event selection with gene expression programming. Computer Physics Communications, 178(6):409-419.
[39] Zhou, W., Hua, J., Chang, X., Zhou, C., 2011. Settlement analysis of the Shuibuya concrete-face rockfill dam. Computers and Geotechnics, 38:269-280.
Open peer comments: Debate/Discuss/Question/Opinion


Open peer comments: Debate/Discuss/Question/Opinion
<1>