1. Introduction
Rice (
Oryza sativa L.) is one of the most important crops in the world, providing over 21% of the dietary calories for more than half of the global world population (Fitzgerald et al.,
2009). However, zinc (Zn) deficiency in rice has been widely reported in many rice-growing regions of the world (Lonergan et al.,
2009; Tiong et al.,
2014). Zn deficiency in crop plants results in not only yield reduction but also Zn malnutrition in humans, where a high proportion of rice is consumed as a staple food (Wu et al.,
2011; Chasapis et al.,
2012). Zn biofortification of rice grains, which aims at increasing Zn concentration and bioavailability of food crop, appears to be the most feasible, sustainable, and economical approach among the different interventions to address human Zn deficiency (Zhao and Mcgrath,
2009; Salunke et al.,
2011).
Low bioavailability of Zn in soil generally results in Zn deficiency in rice plants, and thus becomes one of the common constraints for Zn biofortification in rice grains (Zhao and Mcgrath,
2009). Zn deficiency in rice can be alleviated through Zn fertilization, which is considered to be a cost-effective method to alleviate Zn malnutrition (Zhao and Mcgrath,
2009). Zn fertilization to cereal crops improves productivity and grain Zn concentration (Kang and Okoro,
1976; Yilmaz et al.,
1997; Cakmak,
2008a; Phattarakul et al.,
2012), and thus contributes to grain nutritional value for human beings. However, the vast majority of Zn fertilizer trials and resulting fertilizer recommendations in rice have been in the context of managing the Zn deficiency, with very few studies related to Zn biofortification (Impa and Johnson-Beebout,
2012). Selection of appropriate Zn sources for soil application is considered to be an alternative strategy to improve plant availability of Zn under lowland conditions (Rehman et al.,
2012). Generally, ZnSO
4 is the most widely applied Zn source for its high solubility and low cost. In addition, Zn-EDTA (ethylenediaminetetraacetic acid) is also being recommended due to its efficiency of Zn availability for the plant (Rehman et al.,
2012). However, varied responses of crops to the Zn fertilizers have been reported, depending on the source, application time, methods (Rehman et al.,
2012; Takrattanasaran et al.,
2013) as well as soil chemical properties, which are also influenced by water management (Rehman et al.,
2012).
Because of the water crisis, rice production in China is now undergoing changes, on a gradient from continuous flooding (CF) to continuously aerobic (Bouman et al.,
2002; Yao et al.,
2012). Among several water-saving strategies, alternate wetting and drying (AWD) management is one of the most commonly practiced water-saving technologies, which is being widely adopted in China (Li and Barker,
2004; Rehman et al.,
2012). It has been reported that AWD potentially results in decreased water inputs by 5%–35% when compared with CF, with the yield of rice grain either being maintained (Chapagain and Yamaji,
2010) or even increasing (Zhang et al.,
2009).
The widespread phenomenon of Zn deficiency is generally aggravated by CF, resulting in the changes of the soil pH and Eh, which influences the availability of Zn through controlling Zn forms in soils (Xu et al.,
2003; Rehman et al.,
2012). The shift from flooding towards water-saving rice cultivation may change the soil factors affecting crop Zn availability, which is expected to change and cause an impact on the Zn uptake of rice (Rehman et al.,
2012). Compared with CF, drier water management that maintains more aerobic soil is expected to increase Zn availability in most soils (Impa and Johnson-Beebout,
2012). The soil flooded continuously for chemical reactions generally results in lower Zn availability for plant uptake than a non-flooded soil (Kögel-Knabner et al.,
2010). However, it is reported that Zn deficiency occurs not only in traditional lowland rice, but also in some newly developed water-saving management (Rehman et al.,
2012). According to Gao et al. (
2006), the adoption of the water-saving systems may also decrease Zn availability in aerobic soil. To our knowledge, few papers have reported on Zn concentration and bioavailability for lowland rice under AWD management. It is therefore interesting to investigate the impact of AWD management on grain Zn accumulation. The purposes of the present study are: (1) to compare the effectiveness of a Zn fertilizer source (ZnSO
4 and Zn-EDTA), (2) to investigate if the water-saving management (i.e., AWD) could increase grain yield, Zn accumulation in rice grain and Zn bioavailability.
2. Materials and methods
2.1. Plant materials and growth conditions
A greenhouse experiment was performed at Zhejiang University, Hangzhou, Zhejiang Province, China (30°14′ N, 120°10′ E) during the rice growing season. The soil used in the experiment was collected from the surface horizon (0–30 cm) of an experimental field of Zhejiang University. The air-dried soil was ground in order to sieve through a 5-mm mesh sieve, and being thoroughly mixed before filling a pot. A subsample of the sieved soil was analyzed to determine its different physical chemical properties. The soil was silty loam with pH 6.3, 67.7 mg/kg hydrolyzable N, 25.7 mg/kg available P, 75.8 mg/kg exchangeable K and 2.0 mg/kg available Zn. A total of 9 kg sieved soil was transferred into each plastic pot.
Two rice genotypes were used in this experiment, namely Nipponbare and Jiaxing27. Thirty-day old seedlings of each genotype were transplanted to the pots with three hills per pot and two seedlings per hill. Before transplanting, NPK fertilizers within the recommended range were applied to each pot (in mg/kg dry soil). N at a rate of 180 mg was applied two times: 70% as basal and 30% at panicle initiation. P and K were applied as basal at a rate of 60 and 100 mg, respectively.
2.2. Fertilizer and irrigation treatments
Fertilizer treatments consisted of two Zn sources including ZnSO
4 and Zn-EDTA at a rate of 5 mg/kg, while fertilizer without Zn was applied as a control treatment. And irrigation regimes included CF and AWD, which were applied from 10 d after transplanting to maturity. On 10 d after transplanting, tensiometers were installed in one pot from each treatment. In the AWD regime, pots were not irrigated until the soil water potential reached −10 kPa. The cycle was repeated throughout the season. In the CF regime, the water layer (30 mm above the soil surface) was kept by applying distilled water until one week before harvest as recommended by good farming practices. Treatments were arranged randomly with three replications.
2.3. Sample preparation
All plants were harvested at maturity, and separated into root, straw and panicles. The dry weight of the straw was determined after oven-drying at 70 °C to constant weight, and the panicles were air-dried. The aboveground total biomass was the total dry matter of straw and rice panicles. The panicle number, percentage of filled grains, 1000-grain weight, and grain yield of each pot were recorded from all plants. Rice grains were manually threshed from panicles and air-dried. Brown rice was separated by removing the husk with a de-husker (JLGJ 4.5, Taizhou Cereal and Oil Instrument Co., Ltd., Zhejiang, China), and the polished rice was obtained by removing the bran with a polishing machine (JNM3, Taizhou Cereal and Oil Instrument Co. Ltd., Zhejiang, China). Rice roots were washed with ultrapure water (resistivity ≥18.2 MΩ/cm
2), and then oven-baked at 70 °C. All samples were ground to make powder using a ball mill (Retsch, MM-301, Germany) and kept in plastic bags until analysis.
2.4. Zn concentration determination
Samples (0.1 g, accuracy 0.1 mg) of each treatment were digested with 5.0 ml HNO
3-H
2O
2 (4:1, v/v) using a hot block system (LabTech ED36, Germany). After cooling, the digest was transferred to a 20-ml volumetric flask composed of ultrapure water and then filtered. Zn concentrations of these samples were determined using inductively coupled plasma mass spectrometry (ICP-MS; Agilent 7500a, Agilent Technologies, CA, USA).
Samples of rhizosphere soil were collected by gently shaking off from the root system and were analyzed for available Zn by diethylene triamine pentaacetic acid-triethanolamine (DTPA-TEA) (Lindsay and Norvell,
1978) determined using ICP-MS (Agilent 7500a, USA).
2.5. Phytic acid content determination
Phytic acid of the polished rice samples was determined according to Wei et al. (
2012). The rice flour (0.5 g) was placed into a 50-ml centrifuge tube and extracted with 10 ml 0.2 mol/L HCl, and vibrated in a rotary shaker for 2 h, then centrifuged at 10 000×
g for 10 min. The resulting supernatants (2.5 ml) were transferred into an anther centrifuge tube, and 2 ml of 2 g/L FeCl
3 was added, then mixed thoroughly. The mixtures were boiled in a bath for 30 min, cooled at room temperature, and then centrifuged at 10 000×
g for 15 min. The resulting supernatants were discarded, while the precipitates were washed three times with 5 ml ultrapure water. After adding 3 ml of 1.5 mol/L NaOH to the precipitates, the tubes were then centrifuged at 10 000×
g for 10 min. Supernatants was discarded, and 3 ml of 0.5 mol/L HCl was added to dissolve the precipitates. Finally, ultrapure water was added to the solution up to a volume of 20 ml. The Fe concentration in the solution was determined by ICP-MS (Agilent 7500a, USA). Phytic acid content was measured by multiplying Fe content by the factor 4.2.
2.6. Statistical analysis
All statistical analyses of the data were analyzed using Statistic version 5.5 (SataSoft, Tulsa, OK, USA). Each value represented the average of three replicates. Data were subjected to an analysis of variance (ANOVA), and significant differences in mean values were determined using Duncan’s multiple range test (
P<0.05).
3. Results
3.1. ANOVA of experimental factors
Table
1 shows the analysis for the differences in grain yield, straw dry weight, Zn concentration in rice tissues and phytic acid content in the polished rice. All measurements were significantly affected by genotype, water management, and Zn fertilizer. Phytic acid was significant in the interaction between genotype and water management. No significant interaction effect was observed between the genotype and Zn fertilizer on the measurements, except for Zn concentration in the polished rice. Interaction between water management and Zn fertilizer had a significant effect on the grain yield and Zn concentration in the polished rice. Interaction among genotype, water management, and Zn fertilizer had a significant effect on the Zn concentration in the root and polished rice.
Table 1
ANOVA for grain yield, straw dry weight, Zn concentration and phytic acid content of rice under different water regimes and Zn source treatments
| Source of variation |
Yield |
Straw dry weight |
Shoot Zn concentration |
Root Zn concentration |
Brown rice Zn concentration |
Polished rice Zn concentration |
Phytic acid content |
| Genotype (G) |
**
|
**
|
**
|
**
|
**
|
**
|
**
|
| Water (W) |
**
|
**
|
**
|
**
|
*
|
**
|
**
|
| Zinc (Z) |
**
|
**
|
**
|
**
|
**
|
**
|
**
|
| G×W |
ns
|
ns
|
ns
|
ns
|
ns
|
ns
|
**
|
| G×Z |
ns
|
ns
|
ns
|
ns
|
ns
|
**
|
ns
|
| W×Z |
*
|
ns
|
ns
|
ns
|
ns
|
**
|
ns
|
| G×W×Z |
ns
|
ns
|
ns
|
*
|
ns
|
*
|
ns
|
ns: not significant
*Significant at P<0.05
**Significant at P<0.01
3.2. Plant growth and yield components
Grain yield, straw and root dry weight of Nipponbare were significantly higher than those of Jiaxing27 (Table
2). Regardless of genotypes, the water-saving management and Zn fertilization significantly increased grain yield, straw and root dry weight (Table
2). The AWD regime significantly increased grain yield, straw and root dry weight by 11.4%, 11.0%, and 14.1%, respectively, as compared to those under the CF regime. For the harvest index, no significant differences were observed between CF and AWD or between the two genotypes (Table
2). However, Zn fertilization significantly increased the harvest index by 6.23%–10.20%, and the highest harvest index was observed with ZnSO
4 fertilization (Table
2). Plant growth was significantly impacted by Zn fertilization. When compared to the control, the grain yield increased by 29.6% and 19.9% with the ZnSO
4 and Zn-EDTA fertilization, respectively. The straw dry weight significantly increased by 20.0% and 11.9% with the ZnSO
4 and Zn-EDTA application, respectively. Root dry weight was significantly increased by 12.10%–21.61%, with more pronounced effects of ZnSO
4 observed as compared with Zn-EDTA.
Table 2
Grain yield, straw and root dry weight (DW), and harvest index of rice under different water regimes and Zn source treatments
| Genotype |
Zn treatment |
Grain yield (g/pot)
|
Straw DW (g/pot)
|
Root DW (g/pot)
|
Harvest index (%)
|
| CF |
AWD |
CF |
AWD |
CF |
AWD |
CF |
AWD |
| Nipponbare |
Control |
29.9c |
33.4c |
55.4b |
60.2c |
6.9c |
7.6c |
35.1c |
34.9b |
| ZnSO4
|
38.6a |
44.2a |
61.0a |
71.3a |
7.9a |
9.4a |
40.7a |
38.3a |
| Zn-EDTA |
36.0b |
39.6b |
57.0a |
66.1b |
7.3b |
8.4b |
37.1b |
39.4a |
| Mean |
34.8A |
39.1A |
57.8A |
65.9A |
7.3A |
8.5A |
37.6A |
37.5A |
| Jiaxing27 |
Control |
27.4c |
29.6c |
48.9b |
51.0b |
6.2c |
6.7c |
35.9b |
35.5b |
| ZnSO4
|
34.5a |
38.9a |
60.0a |
65.7a |
7.4a |
8.6a |
37.9a |
38.7a |
| Zn-EDTA |
32.7b |
36.1b |
56.4a |
61.7a |
7.0b |
8.0b |
36.8ab |
36.8ab |
| Mean |
31.5B |
34.9B |
55.1A |
59.4B |
6.9B |
7.7B |
36.9A |
37.0A |
Within a column, means followed by different letters are significantly different at P<0.05 according to Duncan’s multiple range test. Lower-case and upper-case letters indicate comparisons among three Zn treatments and between two genotypes, respectively
Panicles per pot for Nipponbare were significantly higher than that of Jiaxing27 (Table
3). No significant differences were detected in kernels per panicle, filled grain or 1000-grain weight between genotypes, as well as water managements (Table
3). Zn fertilization significantly increased spikelet per panicle and grain filling percentage, while showing no influence on panicle per pot (Table
3).
Table 3
Yield components of rice under different water regimes and Zn source treatments
| Genotype |
Zn treatment |
Panicle (pot−1)
|
Kernel (panicle−1)
|
Filled-grain (%)
|
1000-grain weight (g)
|
| CF |
AWD |
CF |
AWD |
CF |
AWD |
CF |
AWD |
| Nipponbare |
Control |
24.5a |
25.3a |
64.8b |
70.5b |
79.7b |
81.4b |
22.4a |
23.0a |
| ZnSO4
|
26.8a |
27.5a |
71.3a |
77.8a |
88.9a |
90.2a |
22.7a |
22.9a |
| Zn-EDTA |
26.1a |
26.2a |
68.9a |
74.3a |
87.4a |
89.9a |
22.9a |
22.6a |
| Mean |
25.8A |
26.3A |
69.5A |
74.2A |
85.3A |
87.2A |
22.7A |
22.8A |
| Jiaxing27 |
Control |
24.7a |
23.9a |
60.1b |
66.5b |
81.7b |
84.2b |
22.6a |
22.1a |
| ZnSO4
|
25.5a |
25.1a |
70.4a |
75.2a |
85.9a |
89.5a |
22.4a |
23.0a |
| Zn-EDTA |
23.9a |
24.6a |
68.5a |
73.1b |
87.6a |
91.9a |
22.8a |
22.8a |
| Mean |
24.7A |
24.2A |
66.3A |
71.6A |
85.1A |
88.5A |
22.6A |
22.6A |
Within a column, means followed by different letters are significantly different at P<0.05 according to Duncan’s multiple range test. Lower-case and upper-case letters indicate comparisons among three Zn treatments and between two genotypes, respectively
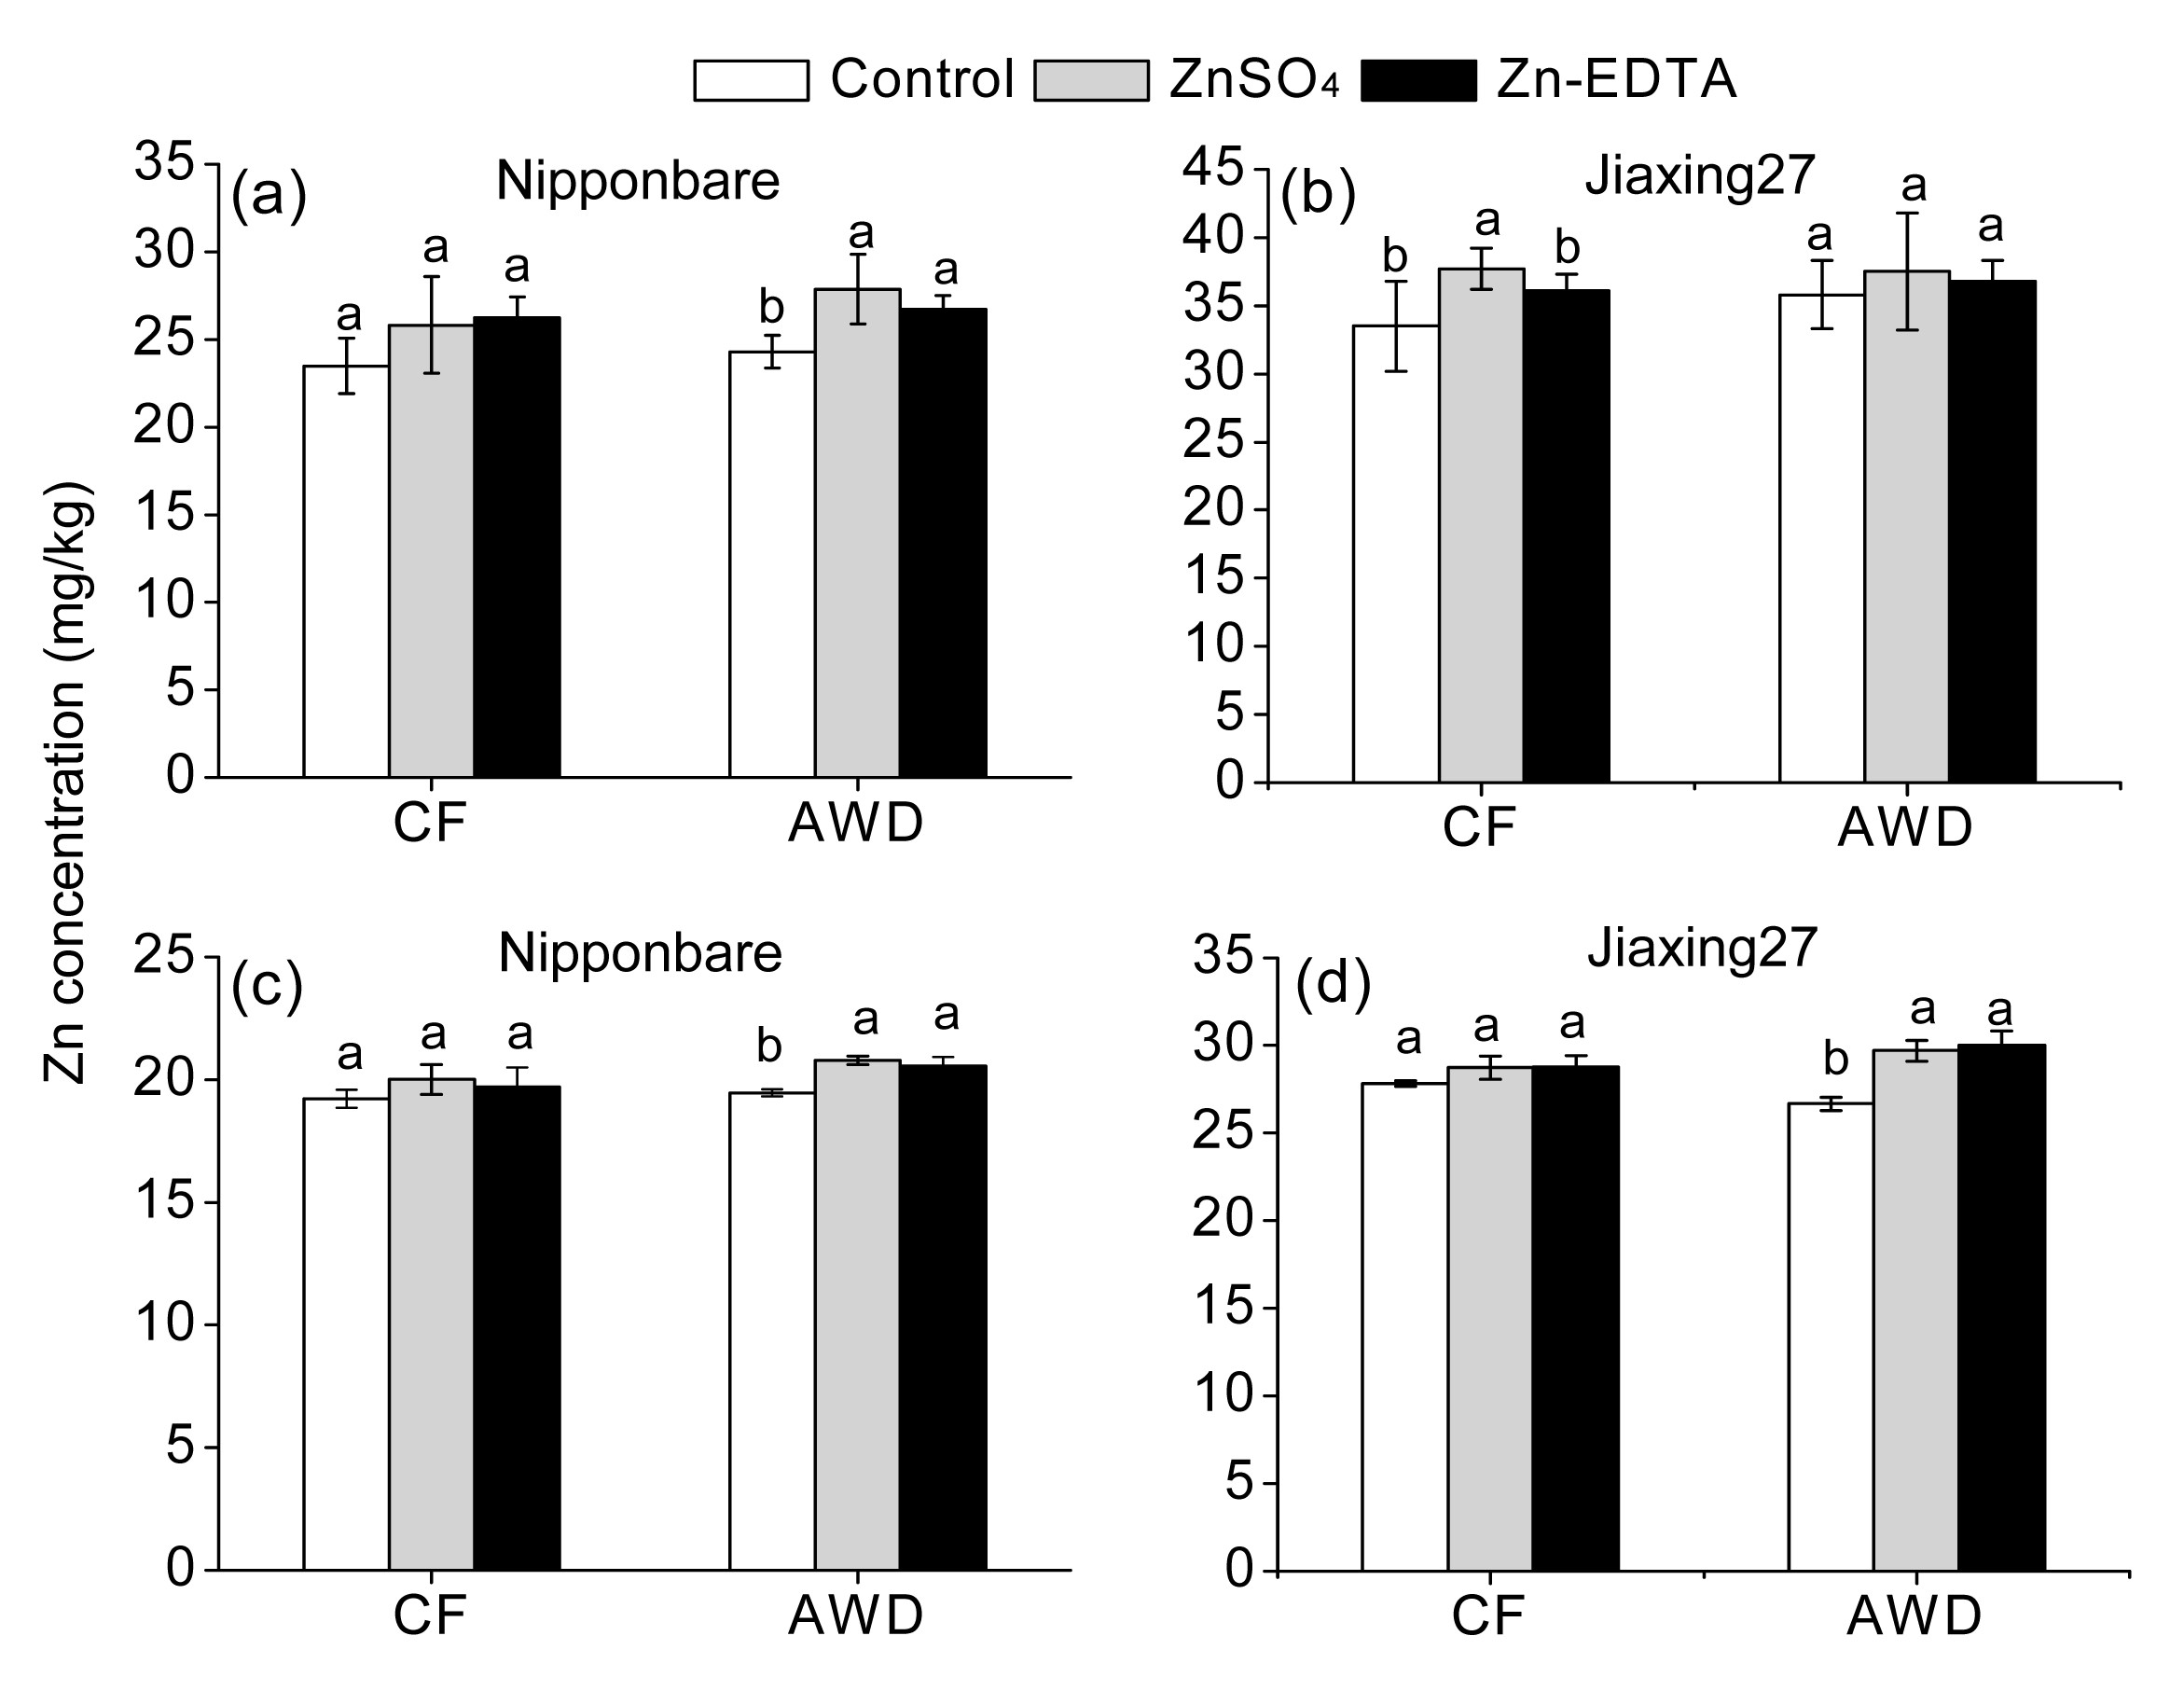
3.3. Zn concentrations in rice tissues
Genotypes varied significantly in concentrations of Zn in rice tissues and Zn accumulation in the rice grain. In all treatments, Jiaxing27 had significantly higher Zn concentration (Table
4, Fig.
1) and Zn accumulation (Fig.
2) than Nipponbare. Significant variations of water managements were also observed in Zn concentration and accumulation in rice plant (Table
4, Fig.
1) and rice grain (Fig.
2). Compared with CF, AWD significantly increased Zn concentrations in both shoot and root by 5.88% and 7.12%, respectively. And Zn concentration and accumulation in both brown rice and polished rice increased by 2.0%–3.9% and 13.8%–15.5%, respectively.
Table 4
Zn concentrations in shoot and root of rice under different water regimes and Zn source treatments
| Genotype |
Zn treatment |
Shoot Zn concentration (mg/kg)
|
Root Zn concentration (mg/kg)
|
| CF |
AWD |
CF |
AWD |
| Nipponbare |
Control |
50.2b |
54.6b |
86.9c |
90.7c |
| ZnSO4
|
60.7a |
63.6a |
130.6a |
143.9a |
| Zn-EDTA |
59.6a |
61.3a |
119.5b |
117.7b |
| Mean |
56.9B |
59.8B |
112.3A |
117.5B |
| Jiaxing27 |
Control |
62.0b |
65.3b |
96.2c |
102.1b |
| ZnSO4
|
68.7a |
72.6a |
144.5a |
153.5a |
| Zn-EDTA |
66.2ab |
71.5a |
130.0b |
149.9a |
| Mean |
65.6A |
69.8A |
123.6A |
135.1A |
Within a column, means followed by different letters are significantly different at P<0.05 according to Duncan’s multiple range test. Lower-case and upper-case letters indicate comparisons among three Zn treatments and between two genotypes, respectively
Fig.1
Zn concentration in brown rice (a, b) and polished rice (c, d) under different water regimes and Zn source treatments
Different letters indicate significant differences (P<0.05) according to Duncan’s multiple range test. Lower-case letters indicate comparisons among three Zn treatments. Error bars indicate the standard deviations of three replicate determinations
Fig.2
Effects of different water managements and Zn sources on Zn accumulations in brown rice (a, b) and polished rice (c, d)
Different letters indicate significant differences (P<0.05) according to Duncan’s multiple range test. Lower-case letters and * indicate comparisons among three Zn treatments and between two water managements, respectively
Zn fertilization had significant impacts on Zn concentration and accumulation in the rice plants (Table
4) and grains (Figs.
1 and
2). Compared to no Zn application, Zn fertilization significantly increased Zn concentrations in both shoot and root by 11.4%–14.5% and 37.4%–52.2%, respectively. Zn concentration in brown rice increased from 29.3 mg/kg in the control treatment to 32.4 mg/kg by ZnSO
4 fertilization and to 31.5 mg/kg by Zn-EDTA fertilization, and increased overall by 10.6% and 7.5%, respectively. And the Zn concentration in polished rice increased from 23.3 mg/kg in the control treatment to 24.7 mg/kg by ZnSO
4 application and to 24.8 mg/kg by Zn-EDTA application, and increased overall by 6.3% and 6.6%, respectively. Zn accumulations in both brown rice and polished rice showed increases of 27.8%–38.3% and 29.7%–43.7%, respectively, depending on different Zn sources. And these effects were much more pronounced when Zn was supplied with ZnSO
4.
3.4. Phytic acid content and molar ratio of phytic acid to Zn in polished rice
Phytic acid content of polished rice varied in different water managements and Zn sources. Compared to CF, the AWD regime significantly reduced phytic acid content by 24.2% in polished rice (Table
5). Zn fertilization also significantly reduced the phytic acid content (Table
5). Generally, phytic acid concentrations decreased with Zn application, being the highest for the control, intermediate for the Zn-EDTA application, and the lowest for the ZnSO
4 application. The mean value of the phytic acid content of the two genotypes decreased from 2.78 mg/g for the control to 2.24 mg/g by ZnSO
4 and to 2.34 mg/g by Zn-EDTA, and decreased overall by 24.1% and 18.8%, respectively. Genotype Jiaxing27 had a higher phytic acid content than that of Nipponbare (Table
5). There was a significant interaction between AWD and ZnSO
4 on the phytic acid content in the polished rice, which had the lowest phytic acid content in Nipponbare or Jiaxing27.
Table 5
Effects of different Zn sources and water managements on phytic acid content and moral ratio of phytic acid to Zn (r
PA/Zn) in polished rice
| Genotype |
Zn treatment |
Phytic acid (mg/g)
|
r
PA/Zn
|
| CF |
AWD |
CF |
AWD |
| Nipponbare |
Control |
2.57a |
2.23a |
13.31a |
11.30a |
| ZnSO4
|
2.10b |
1.65b |
10.33b |
7.83c |
| Zn-EDTA |
2.06b |
1.85b |
10.26b |
8.86b |
| Mean |
2.24B |
1.91B |
11.30A |
9.33A |
| Jiaxing27 |
Control |
3.49a |
2.84a |
12.36a |
10.50a |
| ZnSO4
|
2.99b |
2.21b |
10.26b |
7.32b |
| Zn-EDTA |
3.12b |
2.34b |
10.78b |
7.67b |
| Mean |
3.20A |
2.46A |
11.13A |
8.50A |
Within a column, means followed by different letters are significantly different at P<0.05 according to Duncan’s multiple range test. Lower-case and upper-case letters indicate comparisons among three Zn treatments and between two genotypes, respectively
Both water-saving management and Zn fertilization significantly reduced the molar ratio of phytic acid to Zn in the polished rice (Table
5). Compared to CF, the molar ratio of phytic acid to Zn was significantly decreased by 25.8% under AWD treatment. The molar ratio of phytic acid to Zn ranged from 11.9 in no Zn treatment to 8.9 by ZnSO
4 application and to 9.4 by Zn-EDTA application, and decreased overall by 33.7% and 26.6%, respectively. However, no significant difference was observed in the molar ratio of phytic acid to Zn between the two genotypes (Table
5).
4. Discussion
Zn deficiency is a critical problem in flooded rice, causing rice grains with low Zn content to contribute to human Zn deficiency (Impa and Johnson-Beebout,
2012). Water management and Zn fertilization are important agricultural practices for rice plants, both of which were proved through impacting soil conditions to affect Zn uptake by rice (Gao et al.,
2011; Impa and Johnson-Beebout,
2012). In order to obtain high grain yield and Zn content in rice grain, optimization of Zn source fertilizer and water management should be assessed.
Though AWD is considered to be a promising water-saving strategy under an intensive rice production system, it remains debatable to achieve the dual goal of increasing grain yield and saving water (Zhang et al.,
2009). The results of our present study demonstrated that except for water-saving, an AWD regime significantly increased grain yield by 11.4% (Table
2), in agreement with the previous studies (Belder et al.,
2004; Bouman et al.,
2007). The AWD regime leading to higher yield may be attributed to plant water status during the drying period. It is reported that the soil water potential (−10 kPa) during the rice-growing season was usually not a limitation factor for plant growth and yield formation when water-saving AWD was practiced (Belder et al.,
2004). In our current study, plants were re-watered when soil potential was −10 kPa in AWD and the rice plants did not experience water stress during the entire growing season. Moreover, genotype variance in grain yield under AWD conditions showed that Nipponbare produced an 11.7% more grain yield than Jiaxing27 (Table
2), which is in agreement with the previous studies (Belder et al.,
2004), and the increase of grain yield was pronounced with Zn fertilization under an AWD regime. The results suggest that high-yielding variety developed for continuously flood-irrigated rice systems could still produce a high yield under safe AWD conditions.
Under water-saving conditions, the decrease of soil water content maybe restricted to Zn transport to the plant roots and transpiration rate, resulting in reduced Zn transport towards plants and loading into the grains as well (Rehman et al.,
2012). However, accord to Zhang et al. (
2009), AWD not only enhanced root growth, but also maintained the transpiration rate of leaves when plants were re-watered (Zhang et al.,
2009). In this present study, AWD also significantly increased root growth (Table
2), Zn concentration in both root and shoot (Table
4) as well as rice grain (Fig.
1). In addition, Zn concentration in rhizosphere soil was not decreased under AWD conditions when compared with CF (data not shown). The results demonstrated that Zn transport to rice roots was not restricted when safe AWD was practiced, and the increases of yield and Zn concentration in grain rice resulted in higher Zn accumulation in brown rice and polished rice (Fig.
2).
In this present study, Zn fertilization significantly increased total dry weight and grain yield under both AWD and CF regimes (Tables
1 and
2), consistent with the previous studies that a Zn application could significantly increase plant growth and grain yield in both low Zn status and high Zn status (Wissuwa et al.,
2008). A Zn application also significantly increased Zn concentrations in rice tissues, and significant interaction effects were observed between AWD and ZnSO
4 (Tables
1 and
4, Fig.
1). As for different Zn sources, the results confirmed that the effectivenesses of ZnSO
4 and Zn-EDTA fertilizations were observed to be equal in improving Zn concentration in rice grain (Fig.
1). However, measurements of grain yield and harvest index showed that ZnSO
4 fertilization tended to be more effective than Zn-EDTA fertilization (Table
2), and thus the grain Zn accumulation with ZnSO
4 fertilization was higher than that with Zn-EDTA fertilization, consistent with the previous studies (Kang and Okoro,
1976; Giordano,
1977). In addition, it is reported that the use of Zn-EDTA on rice proves to be not cost-effective because high cost is not offset by greater efficiency as a Zn source (Giordano,
1977). In general, the results above demonstrated that ZnSO
4 fertilization was more effective than Zn-EDTA in increasing Zn accumulation, especially in the case of water-saving management.
Phytic acid is considered as anti-nutrient component, which complexes with Zn in rice grain and reduces the bioavailability of Zn (Cakmak,
2008a; Roohani et al.,
2012; Wei et al.,
2012). The molar ratio of phytic acid to Zn is another important parameter for evaluating Zn bioavailability (Cakmak,
2008b). The molar ratio of phytic acid to Zn above 15 would result in low availability of the Zn in the diet (Alloway,
2009), and even lower molar ratio of 4–8 would also decrease the Zn absorption (Hurrell,
2003). Thus, it is important to enhance Zn bioavailability by decreasing the level of phytic acid content (Ning et al.,
2009) and the molar ratio of phytic acid to Zn in rice grain. In our current study, phytic acid contents and molar ratios in polished rice were significantly decreased by Zn fertilization, consistent with the previous studies (Hussain et al.,
2012), and these decreases were also observed under AWD conditions (Table
5). The decrease in phytic acid content might be related to the effect of Zn fertilization on uptake, translocation, and metabolism of phosphorus (Cakmak,
2008a), while the AWD regime increased the efficacy of the Zn fertilizer. And the dropping of the molar ratio of phytic acid to Zn might be related to a decrease in phytic acid and an increase in Zn concentration in polished rice (Table
5, Fig.
1).
5. Conclusions
Water-saving management was shown to be more effective in improving grain yield, Zn concentration and accumulation in rice grain than CF conditions. Thus, AWD represents not only a promising rice production system but also a strategy for Zn biofortification. Zn fertilization significantly increased grain yield and Zn concentration, and maximum Zn accumulation was observed with ZnSO
4 fertilization under AWD. Moreover, Zn fertilization reduced the phytic acid content and molar ratio of phytic acid to Zn in polished rice, and consequentially enhanced the Zn bioavailability in the rice grain. According to the current results, AWD regime combined with ZnSO
4 fertilization was recommended in rice production systems to obtain higher yield, Zn concentration and bioavailability in grain.
* Project supported by the HarvestPlus-China Program (No. 8271), the Fundamental Research Funds for the Central Universities (No. 2013FZA6005), and the National Key Technology R&D Program of China (No. 2012BAC17B02)Compliance with ethics guidelines Yu-yan WANG, Yan-yan WEI, Lan-xue DONG, Ling-li LU, Ying FENG, Jie ZHANG, Feng-shan PAN, and Xiao-e YANG declare that they have no conflict of interest.References
[1] Alloway, B.J., 2009. Soil factors associated with zinc deficiency in crops and humans.
Environ Geochem Health, 31(5):537-548.


[2] Belder, P., Bouman, B.A.M., Cabangon, R., 2004. Effect of water-saving irrigation on rice yield and water use in typical lowland conditions in Asia.
Agric Water Manage, 65(3):193-210.
[3] Bouman, B.A.M., Hengsdijk, H., Hardy, B., 2002. Water-Wise Rice Production. International Rice Research Institute,Los Baños, Philippines :89-102.
[4] Bouman, B.A.M., Lampayan, R.M., Tuong, T.P., 2007. Water Management in Irrigated Rice: Coping with Water Scarcity. International Rice Research Institute,Los Baños, Philippines :17-32.
[5] Cakmak, I., 2008. Enrichment of cereal grains with zinc: agronomic or genetic biofortification?.
Plant Soil, 302(1-2):1-17.
[6] Cakmak, I., 2008. Zinc deficiency in wheat in Turkey.
Micronutrient Deficiencies in Global Crop Production, Springer Netherlands,:181-200.
[7] Chapagain, T., Yamaji, E., 2010. The effects of irrigation method, age of seedling and spacing on crop performance, productivity and water-wise rice production in Japan.
Paddy Water Environ, 8(1):81-90.
[8] Chasapis, C.T., Loutsidou, A.C., Spiliopoulou, C.A., 2012. Zinc and human health: an update.
Arch Toxicol, 86(4):521-534.
[9] Fitzgerald, M.A., Mccouch, S.R., Hall, R.D., 2009. Not just a grain of rice: the quest for quality.
Trends Plant Sci, 14(3):133-139.
[10] Gao, X., Zou, C., Fan, X., 2006. From flooded to aerobic conditions in rice cultivation: consequences for zinc uptake.
Plant Soil, 280(1-2):41-47.
[11] Gao, X., Hoffland, E., Stomph, T., 2011. Improving zinc bioavailability in transition from flooded to aerobic rice. A review.
Agron Sustain Dev, 32(2):465-478.
[12] Giordano, P.M., 1977. Efficiency of zinc fertilization for flooded rice.
Plant Soil, 48(3):673-684.
[13] Hurrell, R.F., 2003. Influence of vegetable protein sources on trace element and mineral bioavailability.
J Nutr, 133(9):2973S-2977S.
[14] Hussain, S., Maqsood, M.A., Rengel, Z., 2012. Biofortification and estimated human bioavailability of zinc in wheat grains as influenced by methods of zinc application.
Plant Soil, 361(1-2):279-290.
[15] Impa, S.M., Johnson-Beebout, S.E., 2012. Mitigating zinc deficiency and achieving high grain Zn in rice through integration of soil chemistry and plant physiology research.
Plant Soil, 361(1-2):3-41.
[16] Kang, B.T., Okoro, E.G., 1976. Response of flooded rice grown on a vertisol from northern Nigeria to zinc sources and methods of application.
Plant Soil, 44(1):15-25.
[17] Kgel-Knabner, I., Amelung, W., Cao, Z., 2010. Biogeochemistry of paddy soils.
Geoderma, 157(1-2):1-14.
[18] Li, Y.H., Barker, R., 2004. Increasing water productivity for paddy irrigation in China.
Paddy Water Environ, 2(4):187-193.
[19] Lindsay, W.L., Norvell, W.A., 1978. Development of a DTPA soil test for zinc, iron, manganese, and copper.
Soil Sci Soc Am J, 42(3):421-428.
[20] Lonergan, P.F., Pallotta, M.A., Lorimer, M., 2009. Multiple genetic loci for zinc uptake and distribution in barley (
Hordeum vulgare).
New Phytol, 184(1):168-179.
[21] Ning, H., Liu, Z., Wang, Q., 2009. Effect of nitrogen fertilizer application on grain phytic acid and protein concentrations in japonica rice and its variations with genotypes.
J Cereal Sci, 50(1):49-55.
[22] Phattarakul, N., Rerkasem, B., Li, L.J., 2012. Biofortification of rice grain with zinc through zinc fertilization in different countries.
Plant Soil, 361(1-2):131-141.
[23] Rehman, H.U., Aziz, T., Farooq, M., 2012. Zinc nutrition in rice production systems: a review.
Plant Soil, 361(1-2):203-226.
[24] Roohani, N., Hurrell, R., Wegmueller, R., 2012. Zinc and phytic acid in major foods consumed by a rural and a suburban population in central Iran.
J Food Compos Anal, 28(1):8-15.
[25] Salunke, R., Neelam, K., Rawat, N., 2011. Bioavailability of iron from wheat aegilops derivatives selected for high grain iron and protein contents.
J Agric Food Chem, 59(16):9048
[26] Takrattanasaran, N., Chanchareonsook, J., Johnson, P.G., 2013. Amelioration of zinc deficiency of corn in calcareous soils of Thailand: zinc sources and application methods.
J Plant Nutr, 36(8):1275-1286.
[27] Tiong, J., McDonald, G.K., Genc, Y., 2014. HvZIP7 mediates zinc accumulation in barley (
Hordeum vulgare) at moderately high zinc supply.
New Phytol, 201(1):131-143.
[28] Wei, Y.Y., Shohag, M.J.I., Yang, X.E., 2012. Biofortification and bioavailability of rice grain zinc as affected by different forms of foliar zinc fertilization.
PLoS ONE, 7(9):e45428
[29] Wissuwa, M., Ismail, A., Graham, R., 2008. Rice grain zinc concentrations as affected by genotype, native soil-zinc availability, and zinc fertilization.
Plant Soil, 306(1-2):37-48.
[30] Wu, C.Y., Feng, Y., Shohag, M.J., 2011. Characterization of
68Zn uptake, translocation, and accumulation into developing grains and young leaves of high Zn-density rice genotype.
J Zhejiang Univ-Sci B (Biomed & Biotechnol), 12(5):408-418.
[31] Xu, R.K., Zhao, A.Z., Li, Q.M., 2003. Acidity regime of the red soils in a subtropical region of southern China under field conditions.
Geoderma, 115(1-2):75-84.
[32] Yao, F., Huang, J., Cui, K., 2012. Agronomic performance of high-yielding rice variety grown under alternate wetting and drying irrigation.
Field Crops Res, 126:16-22.
[33] Yilmaz, A., Ekiz, H., Torun, B., 1997. Effect of different zinc application methods on grain yield and zinc concentration in wheat cultivars grown on zinc-deficient calcareous soils.
J Plant Nutr, 20(4-5):461-471.
[34] Zhang, H., Xue, Y., Wang, Z., 2009. An alternate wetting and moderate soil drying regime improves root and shoot growth in rice.
Crop Sci, 49(6):2246-2260.
[35] Zhao, F.J., Mcgrath, S.P., 2009. Biofortification and phytoremediation.
Curr Opin Plant Biol, 12(3):373-380.


Open peer comments: Debate/Discuss/Question/Opinion
<1>