1. Introduction
Coronary artery disease (CAD) is the most common chronic disease in humans and has extremely complex etiology. Epidemiological studies demonstrated that the incidences of CAD and sequelae such as myocardial infarction (MI) are lower in pre-menopausal women than in age-matched men (Tunstall-Pedoe et al.,
1999). However, cardiovascular morbidity and mortality increase sharply after the onset of menopause, suggesting that endogenous estrogen protects women against CAD (Gurevitz et al.,
2000). Clinical trials of postmenopausal estrogen therapy in CAD have yielded mixed results. Results from a study of nurses suggested that women who used postmenopausal hormones had a lower mortality than non-users (Grodstein et al.,
1997). In particular, there was a reduction in death due to coronary heart disease (Grodstein et al.,
1997). However, the results from a randomized controlled primary prevention trial, the Women’s Health Initiative Trial, showed that the regimen of estrogen plus progestin brought more health risks than benefits, and indicated that hormone therapy did not decrease the risk of cardiovascular events in women with CAD (Rossouw et al.,
2002). These findings underscore the complexity of the cardiovascular effects of estrogen and support the need for a better understanding of its role in cardiovascular biology and of population-level genetic variation in the sex steroid hormone system. It has been suggested that the cardiovascular functions of estrogen depend on estrogen receptors α (ERα) and β (ERβ) encoded by separate genes,
ESR1 and
ESR2, respectively (Mendelsohn and Karas,
2005). ERα plays a more important role than ERβ in cardioprotection, and is involved in vasodilation (Figtree et al.,
2003), attenuation of cardiac cell apoptosis (Wang et al.,
2010; Liu et al.,
2011), and stimulation of neovascularization (Hamada et al.,
2006; Jesmin et al.,
2010).
ESR1, located on chromosome 6, locus 6q24-q27, comprises eight exons and seven introns. There are two common site polymorphisms in the first intron, located at the recognition sites of the restriction enzymes known as
PvuII and
XbaI, respectively (Mansur et al.,
2005; Rokach et al.,
2005). The
PvuII polymorphism, also known as c.454-397T>C or rs2234693, results from a T/C transition (Yaich et al.,
1992).
ESR1 PvuII polymorphism might affect
ESR1 gene expression by altering the binding of transcription factors (Herrington et al.,
2002) and influencing the splicing of the
ESR1 gene. Previous studies have suggested that the
PvuII polymorphism is related to many diseases, such as breast cancer (St-Hilaire et al.,
2011), hypertension (Peter et al.,
2005), blood lipid changes (Klos et al.,
2008), and coronary atherosclerosis (Figtree et al.,
2009).
The relationship between the
ESR1 gene
PvuII polymorphism and cardiovascular disease is still controversial. Shen et al. (
2012) showed that it conferred an increased risk of CAD in Chinese men. Almeida and Hutz (
2006) also suggested that the
ESR1 PvuII polymorphism was associated with CAD severity independent of gender. However, Matsubara et al. (
1997) found no significant association between the
ESR1 c.454-397T>C polymorphism and CAD in a Japanese population. Similarly, a large study with 3657 patients and 1211 controls, from a predominantly European population, showed that the genotype distribution of the
ESR1 PvuII polymorphism was not significantly different between the case and control groups (Koch et al.,
2005). Overall, the current evidence on the link between
ESR1 PvuII polymorphism and CAD risk is inconsistent. In addition, individual studies have been limited by small sample sizes and often involved populations of a single ethnicity. Therefore, we performed a meta-analysis of 21 studies, aiming to summarize and clarify the relationship between
ESR1 PvuII polymorphism and CAD risk.
2. Materials and methods
2.1. Search methods and selection criteria
The present meta-analysis followed the preferred reporting items for systematic reviews and meta-analyses (PRISMA) criteria. Relevant studies published or presented up to 30th May 2013 were searched in several sources including MEDLINE, Cochrane database, Embase, PubMed, SinoMed (China Biological Medicine Database), and CNKI (China National Knowledge Infrastructure). We used various combinations of the following keywords and MeSH (Medical Subject Headings) terms: “estrogen receptor”, “estrogen”, “receptor”, “polymorphism”, “gene”, “coronary artery disease”, “CAD”, and “cardiovascular”. To search as completely as possible, we also retrieved potential studies via “related articles” in the identified articles. The relevant studies included in this meta-analysis had to meet all the following inclusion criteria: (1) They used a case-control design or cohort or cross-sectional study design; (2) They were studies of human subjects without country and language restrictions; (3) If studies were performed by the same researchers, the one with the largest sample size was selected; (4) The studies provided sufficient data of genotype and allele frequencies for analysis; (5) The genotype distribution of the control group had to correspond with Hardy-Weinberg equilibrium (HWE).
CAD was defined as angiographic evidence of ≥50% stenosis in at least one coronary artery or major branch segment together with clinical symptoms of angina, and/or acute coronary syndrome (ACS), including unstable angina pectoris, fatal or non-fatal MI confirmed by objective clinical evidence, such as the presence of typical electrocardiographic changes and elevation in the levels of cardiac biomarkers of necrosis (Wright et al.,
2011; Jneid,
2012). The selection process is shown in Fig.
1.
Fig.1
Flow chart of the selection process used for the meta-analysis of the relationship between ESR1 PvuII polymorphism and CAD risk
2.2. Data extraction
To extract sufficient and useful data from the articles included in this meta-analysis, we reviewed the full text of eligible studies. Characteristics of the studies were gathered including the name of the first author, year of publication, country, type of study design, sample size, mean age, source of the control population, method of genotyping, criteria for matching between case and control, quality score of each study, and HWE of control groups (Table
1). The distribution of genotype and allele frequencies in each study, the sample sizes of cases and controls, and the
P-values of the HWE of control groups are summarized in Table
2. Data were carefully extracted independently by two reviewers (X.G. GUO and J. DING) according to the eligibility criteria listed above. When the two investigators made different recommendations about a particular study, either they reached a consensus by discussion, or another reviewer intervened to make a decision.
Table 1
Main characteristics of relevant studies selected for meta-analysis
| Study |
Country |
Type of study |
Sample size (% women)
|
Mean age (year)
|
Control source |
Genotyping method |
Matching criteria |
Quality score |
HWE |
| Case |
Control |
Case |
Control |
| Matsubara et al. (1997) |
Japan |
Case-control |
87 (25.3) |
94 (20.2) |
M: 58.2±9.4, F: 64.7±6.2 |
M: 49.0±5.5, F: 61.8±8.3 |
PB |
PCR-RFLP |
BMI |
9.0 |
Y |
| Guo et al. (2002) |
China |
Case-control |
72 (19.4) |
53 (22.6) |
65.1±5.6 |
64.3±4.2 |
HB, PB |
PCR-RFLP |
Age/sex |
9.5 |
Y |
| Huang et al. (2002) |
China |
Case-control |
135 (40.0) |
118 (57.6) |
|
|
PB |
PCR-RFLP |
Age/BMI |
8.0 |
Y |
| Lu et al. (2002) |
Japan |
Case-control |
119 (20.0) |
176 (42.0) |
M: 50.3±11.7, F: 61.4±7.1 |
M: 52.3±12.8, F: 63.3±7.4 |
HB |
PCR-RFLP |
Age |
11.0 |
Y |
| Zheng (2002) |
China |
Case-control |
51 (100.0) |
54 (100.0) |
64.2±9.8 |
62.1±7.8 |
HB |
PCR |
Age/sex |
7.0 |
Y |
| Shearman et al. (2003) |
USA |
Cohort study |
178 (31.5) |
1561 (51.8) |
|
|
PB |
PCR-RFLP |
Age/BMI |
11.0 |
Y |
| Schuit et al. (2004) |
Netherlands |
Cohort study |
440 (38.2) |
5968 (60.7) |
|
|
PB |
TaqMan |
Unknown |
12.0 |
Y |
| Koch et al. (2005) |
Germany |
Case-control |
3657 (24.2) |
1211 (49.4) |
64.0±12.0 |
60.3±11.9 |
PB |
TaqMan |
Unknown |
12.0 |
Y |
| Mansur et al. (2005) |
Brazil |
Case-control |
153 (40.0) |
142 (51.0) |
43.4±7.5 |
44.2±11.8 |
PB |
PCR-RFLP |
Age/sex |
8.0 |
Y |
| Almeida and Hutz (2006) |
Brazil |
Case-control |
210 (28.6) |
143 (55.9) |
M: 61.0±10.4, F: 64.0±10.5 |
M: 59.0±11.2, F: 58.0±8.8 |
PB |
PCR |
BMI |
10.0 |
Y |
| Cheng et al. (2006) |
China |
Case-control |
200 (47.5) |
190 (48.4) |
56.5±0.4 |
52.4±0.6 |
PB |
PCR-RFLP |
Age/sex |
8.0 |
Y |
| Li et al. (2006) |
China |
Case-control |
165 (100.0) |
80 (100.0) |
61.7±8.2 |
59.9±7.7 |
HB |
PCR-RFLP |
Age/BMI/sex |
9.0 |
Y |
| Alevizaki et al. (2007) |
Greece |
Case-control |
87 (100.0) |
70 (100.0) |
65.0±0.95 |
65.0±0.95 |
HB |
PCR |
Unknown |
11.0 |
Y |
| Kjaergaard et al. (2007) |
Denmark |
Case-control |
2495 (27.8) |
4447 (60.0) |
|
|
PB |
TaqMan |
Unknown |
12.0 |
Y |
| Yilmaz et al. (2007) |
Turkey |
Case-control |
168 (35.7) |
99 (62.6) |
57.02±8.62 |
55.9±9.97 |
HB |
PCR-RFLP |
Age |
11.0 |
Y |
| Tang et al. (2008) |
China |
Case-control |
161 (0.0) |
158 (0.0) |
61.4±8.1 |
60.9±6.4 |
PB |
PCR-RFLP |
Age/sex |
9.0 |
Y |
| Xu et al. (2008) |
China |
Case-control |
210 (44.8) |
174 (51.1) |
56.0±7.3 |
55.0±8.6 |
PB |
PCR |
Age/sex |
11.0 |
Y |
| Boroumand et al. (2009)*
|
Iran |
Case-control |
210 (31.4) |
240 (61.7) |
58.79±10.44 |
55.1±10.2 |
HB |
PCR-RFLP |
Unknown |
11.0 |
Y |
| Karadağ et al. (2009) |
Turkey |
Cross-sectional |
140 (32.1) |
47 (44.7) |
60.7±12.3 |
56.2±15.1 |
HB |
PCR-RFLP |
Sex |
10.0 |
Y |
| Lluís-Ganella et al. (2009) |
Spain |
Case-control |
423 (25.0) |
1269 (25.0) |
61.21±11.16 |
60.72±10.65 |
PB |
TaqMan |
Age/sex |
12.0 |
Y |
| Jin et al. (2010) |
China |
Case-control |
236 (28.4) |
117 (35.9) |
64.0±11.0 |
62.0±11.0 |
HB, PB |
PCR-RFLP |
Age/sex |
9.5 |
Y |
| Shen et al. (2012) |
China |
Case-control |
539 (46.4) |
539 (46.9) |
57.3±7.2 |
56.4±9.1 |
PB |
PCR-RFLP |
Age/sex |
12.0 |
Y |
M: male; F: female; PB: population-based; HB: hospital-based; PCR: polymerase chain reaction; RFLP: restriction fragment length polymorphism; BMI: body mass index; HWE: Hardy-Weinberg equilibrium; Y: genotype distribution and allele frequency of control group followed HWE
*This study was excluded because of its criterion for diagnosis of CAD (Gensini score>6)
Table 2
Summarization of the distribution of genotype and allele frequencies, the sample sizes of cases and controls, and the P-values of the HWE of control groups
| Included study |
Group |
Sample size |
Genotype
|
Allele (%)
|
P of HWE |
| TT |
TC |
CC |
T |
C |
| Matsubara et al. (1997) |
Case |
87 |
27 |
47 |
13 |
58.0 |
42.0 |
| Control |
94 |
34 |
46 |
14 |
60.6 |
39.4 |
0.81 |
| Guo et al. (2002) |
Case |
72 |
10 |
42 |
20 |
43.1 |
56.9 |
| Control |
53 |
23 |
23 |
7 |
65.1 |
34.9 |
0.74 |
| Huang et al. (2002) |
Case |
135 |
80 |
41 |
14 |
74.4 |
25.6 |
| Control |
118 |
51 |
54 |
13 |
66.1 |
33.9 |
0.82 |
| Lu et al. (2002) |
Case |
119 |
35 |
50 |
34 |
50.4 |
49.6 |
| Control |
176 |
67 |
74 |
35 |
59.1 |
40.9 |
0.08 |
| Zheng (2002) |
Case |
51 |
9 |
35 |
7 |
52.0 |
48.0 |
| Control |
54 |
18 |
30 |
6 |
61.1 |
38.9 |
0.21 |
| Shearman et al. (2003) |
Case |
178 |
50 |
86 |
42 |
52.2 |
47.8 |
| Control |
1561 |
475 |
776 |
310 |
55.3 |
44.7 |
0.83 |
| Schuit et al. (2004) |
Case |
440 |
87 |
216 |
137 |
44.3 |
55.7 |
| Control |
5968 |
1305 |
2958 |
1705 |
46.6 |
53.4 |
0.74 |
| Koch et al. (2005) |
Case |
3657 |
1074 |
1781 |
802 |
53.7 |
46.3 |
| Control |
1211 |
360 |
595 |
256 |
54.3 |
45.7 |
0.73 |
| Mansur et al. (2005) |
Case |
153 |
17 |
85 |
51 |
38.9 |
61.1 |
| Control |
142 |
26 |
69 |
47 |
42.6 |
57.4 |
0.94 |
| Almeida and Hutz (2006) |
Case |
210 |
72 |
96 |
42 |
57.1 |
42.9 |
| Control |
143 |
54 |
72 |
17 |
62.9 |
37.1 |
0.34 |
| Cheng et al. (2006) |
Case |
200 |
65 |
92 |
43 |
55.5 |
44.5 |
| Control |
190 |
67 |
85 |
38 |
57.6 |
42.4 |
0.25 |
| Li et al. (2006) |
Case |
165 |
33 |
88 |
44 |
46.7 |
53.3 |
| Control |
80 |
21 |
36 |
23 |
48.8 |
51.3 |
0.37 |
| Alevizaki et al. (2007) |
Case |
87 |
25 |
45 |
17 |
54.6 |
45.4 |
| Control |
70 |
32 |
31 |
7 |
67.9 |
32.1 |
0.90 |
| Kjaergaard et al. (2007) |
Case |
2495 |
740 |
1268 |
487 |
55.1 |
44.9 |
| Control |
4447 |
1296 |
2237 |
914 |
54.3 |
45.7 |
0.37 |
| Yilmaz et al. (2007) |
Case |
168 |
8 |
117 |
43 |
39.6 |
60.4 |
| Control |
99 |
22 |
53 |
24 |
49.0 |
51.0 |
0.48 |
| Tang et al. (2008) |
Case |
161 |
48 |
76 |
37 |
53.4 |
46.6 |
| Control |
158 |
46 |
79 |
33 |
54.1 |
45.9 |
0.93 |
| Xu et al. (2008) |
Case |
210 |
92 |
88 |
30 |
64.8 |
35.2 |
| Control |
174 |
82 |
78 |
14 |
69.5 |
30.5 |
0.44 |
| Karadağ et al. (2009) |
Case |
140 |
40 |
68 |
32 |
52.9 |
47.1 |
| Control |
47 |
8 |
29 |
10 |
47.9 |
52.1 |
0.11 |
| Lluís-Ganella et al. (2009) |
Case |
423 |
117 |
231 |
75 |
55.0 |
45.0 |
| Control |
1269 |
383 |
636 |
250 |
55.2 |
44.8 |
0.63 |
| Jin et al. (2010) |
Case |
236 |
84 |
105 |
47 |
57.8 |
42.2 |
| Control |
117 |
49 |
57 |
11 |
66.2 |
33.8 |
0.33 |
| Shen et al. (2012) |
Case |
539 |
245 |
226 |
68 |
66.4 |
33.6 |
| Control |
539 |
274 |
217 |
48 |
71.0 |
29.0 |
0.59 |
2.3. Quality assessment
Two reviewers (J. DING and X. YIN) independently assessed the quality of the included studies, according to a set of criteria (Table
3) modified on the basis of previous studies (Thakkinstian et al.,
2005; Camargo et al.,
2006). Scores ranged from 0 to 13, with 0 as the lowest and 13 as the highest quality.
Table 3
Scale for quality assessment
| Criteria |
Score |
| Representativeness of cases |
| Consecutively/randomly selected from case population with clearly defined sampling frame |
2 |
| Consecutively/randomly selected from case population without clearly defined sampling frame or with extensive inclusion/exclusion criteria |
1 |
| No method of selection described |
0 |
| Representativeness of controls |
| Population-based or community-based |
2 |
| Both population-based and hospital-based/healthy volunteers/blood donors |
1.5 |
| Hospital-based controls without CAD |
1 |
| Not described |
0 |
| Ascertainment of CAD |
| Clearly described objective criteria for diagnosis of CAD, histological confirmation |
2 |
| Diagnosis of CAD by patient self-report or by patient history |
1 |
| Not described |
0 |
| Ascertainment of controls |
| Controls were tested to screen out CAD |
2 |
| Controls were subjects who did not report CAD: no objective testing |
1 |
| Not described |
0 |
| Genotyping examination |
| Genotyping done under “blinded” condition |
1 |
| Unblinded or not mentioned |
0 |
| Hardy-Weinberg equilibrium |
| Hardy-Weinberg equilibrium in control group |
2 |
| Hardy-Weinberg disequilibrium in control group |
1 |
| No checking for Hardy-Weinberg equilibrium |
0 |
| Association assessment |
| Assess association between genotypes and CAD with appropriated statistics and adjustment for confounders |
2 |
| Assess association between genotypes and CAD with appropriated statistics without adjustment for confounders |
1 |
| Inappropriate statistics used |
0 |
2.4. Statistical analysis
To investigate the association of
PvuII polymorphism and CAD, we performed the meta-analysis using a series of models, including allele genetic model (C vs. T), homozygote comparison (CC vs. TT), dominant genetic model (CC/CT vs. TT), and recessive genetic model (CC vs. CT/TT) separately. Odds ratios (ORs) and corresponding 95% confidence intervals (CIs) were calculated to measure the strength of the relationship between
PvuII polymorphism and CAD. We conducted chi-square-based
Q-tests to assess the heterogeneity among different studies (Higgins and Thompson,
2002). The index
I
2 was used to quantify the effect of heterogeneity. The value of
I
2 indicates the percentage of variation caused by heterogeneity rather than by chance among the studies (Higgins et al.,
2003). If the
P-value of a
Q-test was not larger than 0.1, we used a random-effect model to test the existence of significant heterogeneity. Otherwise, we chose a fixed-effect model (Cochran,
1968). We also performed sensitivity analyses and meta-regression analysis to evaluate the heterogeneity more clearly. A
P-value of less than 0.1 was considered to be significant.
The HWE of control groups was examined using chi-square tests. The genotype distributions and allele frequencies of control populations were considered to be consistent with HWE if the
P-value was less than 0.05. Funnel plot, Egger’s linear regression (Egger et al.,
1997), and Begg’s test (Begg and Mazumdar,
1994) were used to estimate potential publication bias.
P-values of less than 0.05 from Egger’s test and Begg’s test indicated that publication bias existed.
Statistical analysis was performed using Review Manager (RevMan) 5.2 (
http://ims.cochrane.org/revman/download) and STATA11.0 (STATA Corp., College Station, Texas, USA).
3. Results
3.1. Characteristics of studies
After searching the electronic databases as described above, we identified a total of 159 potentially relevant studies. According to the inclusion criteria defined previously, 21 eligible studies with sufficient data were finally included in this meta-analysis (Fig.
1). The study by Boroumand et al. (
2009) was excluded because CAD was diagnosed by the Gensini score. The characteristics of the relevant studies are described in Table
1. In all studies, blood samples were used to determine genotypes. The genotype distributions and allele frequencies of these studies are summarized in Table
2. Based on the
P-values of the HWE of control groups, no study was found to be in disequilibrium.
Eleven of the 21 selected studies consisted of 1975 CAD patients and 1753 controls from the Asian region (Matsubara et al.,
1997; Guo et al.,
2002; Huang et al.,
2002; Lu et al.,
2002; Zheng,
2002; Cheng et al.,
2006; Li et al.,
2006; Tang et al.,
2008; Xu et al.,
2008; Jin et al.,
2010; Shen et al.,
2012). The remaining 10 studies with 7951 patients and 14 957 controls were from Western countries (Shearman et al.,
2003; Schuit et al.,
2004; Koch et al.,
2005; Mansur et al.,
2005; Almeida and Hutz,
2006; Alevizaki et al.,
2007; Kjaergaard et al.,
2007; Yilmaz et al.,
2007; Karadağ et al.,
2009; Lluís-Ganella et al.,
2009). Both population-based (PB) and hospital-based (HB) studies were included in the analysis. Thirteen studies were PB (Matsubara et al.,
1997; Huang et al.,
2002; Shearman et al.,
2003; Schuit et al.,
2004; Koch et al.,
2005; Mansur et al.,
2005; Cheng et al.,
2006; Almeida and Hutz,
2006; Kjaergaard et al.,
2007; Tang et al.,
2008; Xu et al.,
2008; Lluís-Ganella et al.,
2009; Shen et al.,
2012), six were HB (Lu et al.,
2002; Zheng,
2002; Li et al.,
2006; Alevizaki et al.,
2007; Yilmaz et al.,
2007; Karadağ et al.,
2009), and the others had both PB and HB controls (Guo et al.,
2002; Jin et al.,
2010).
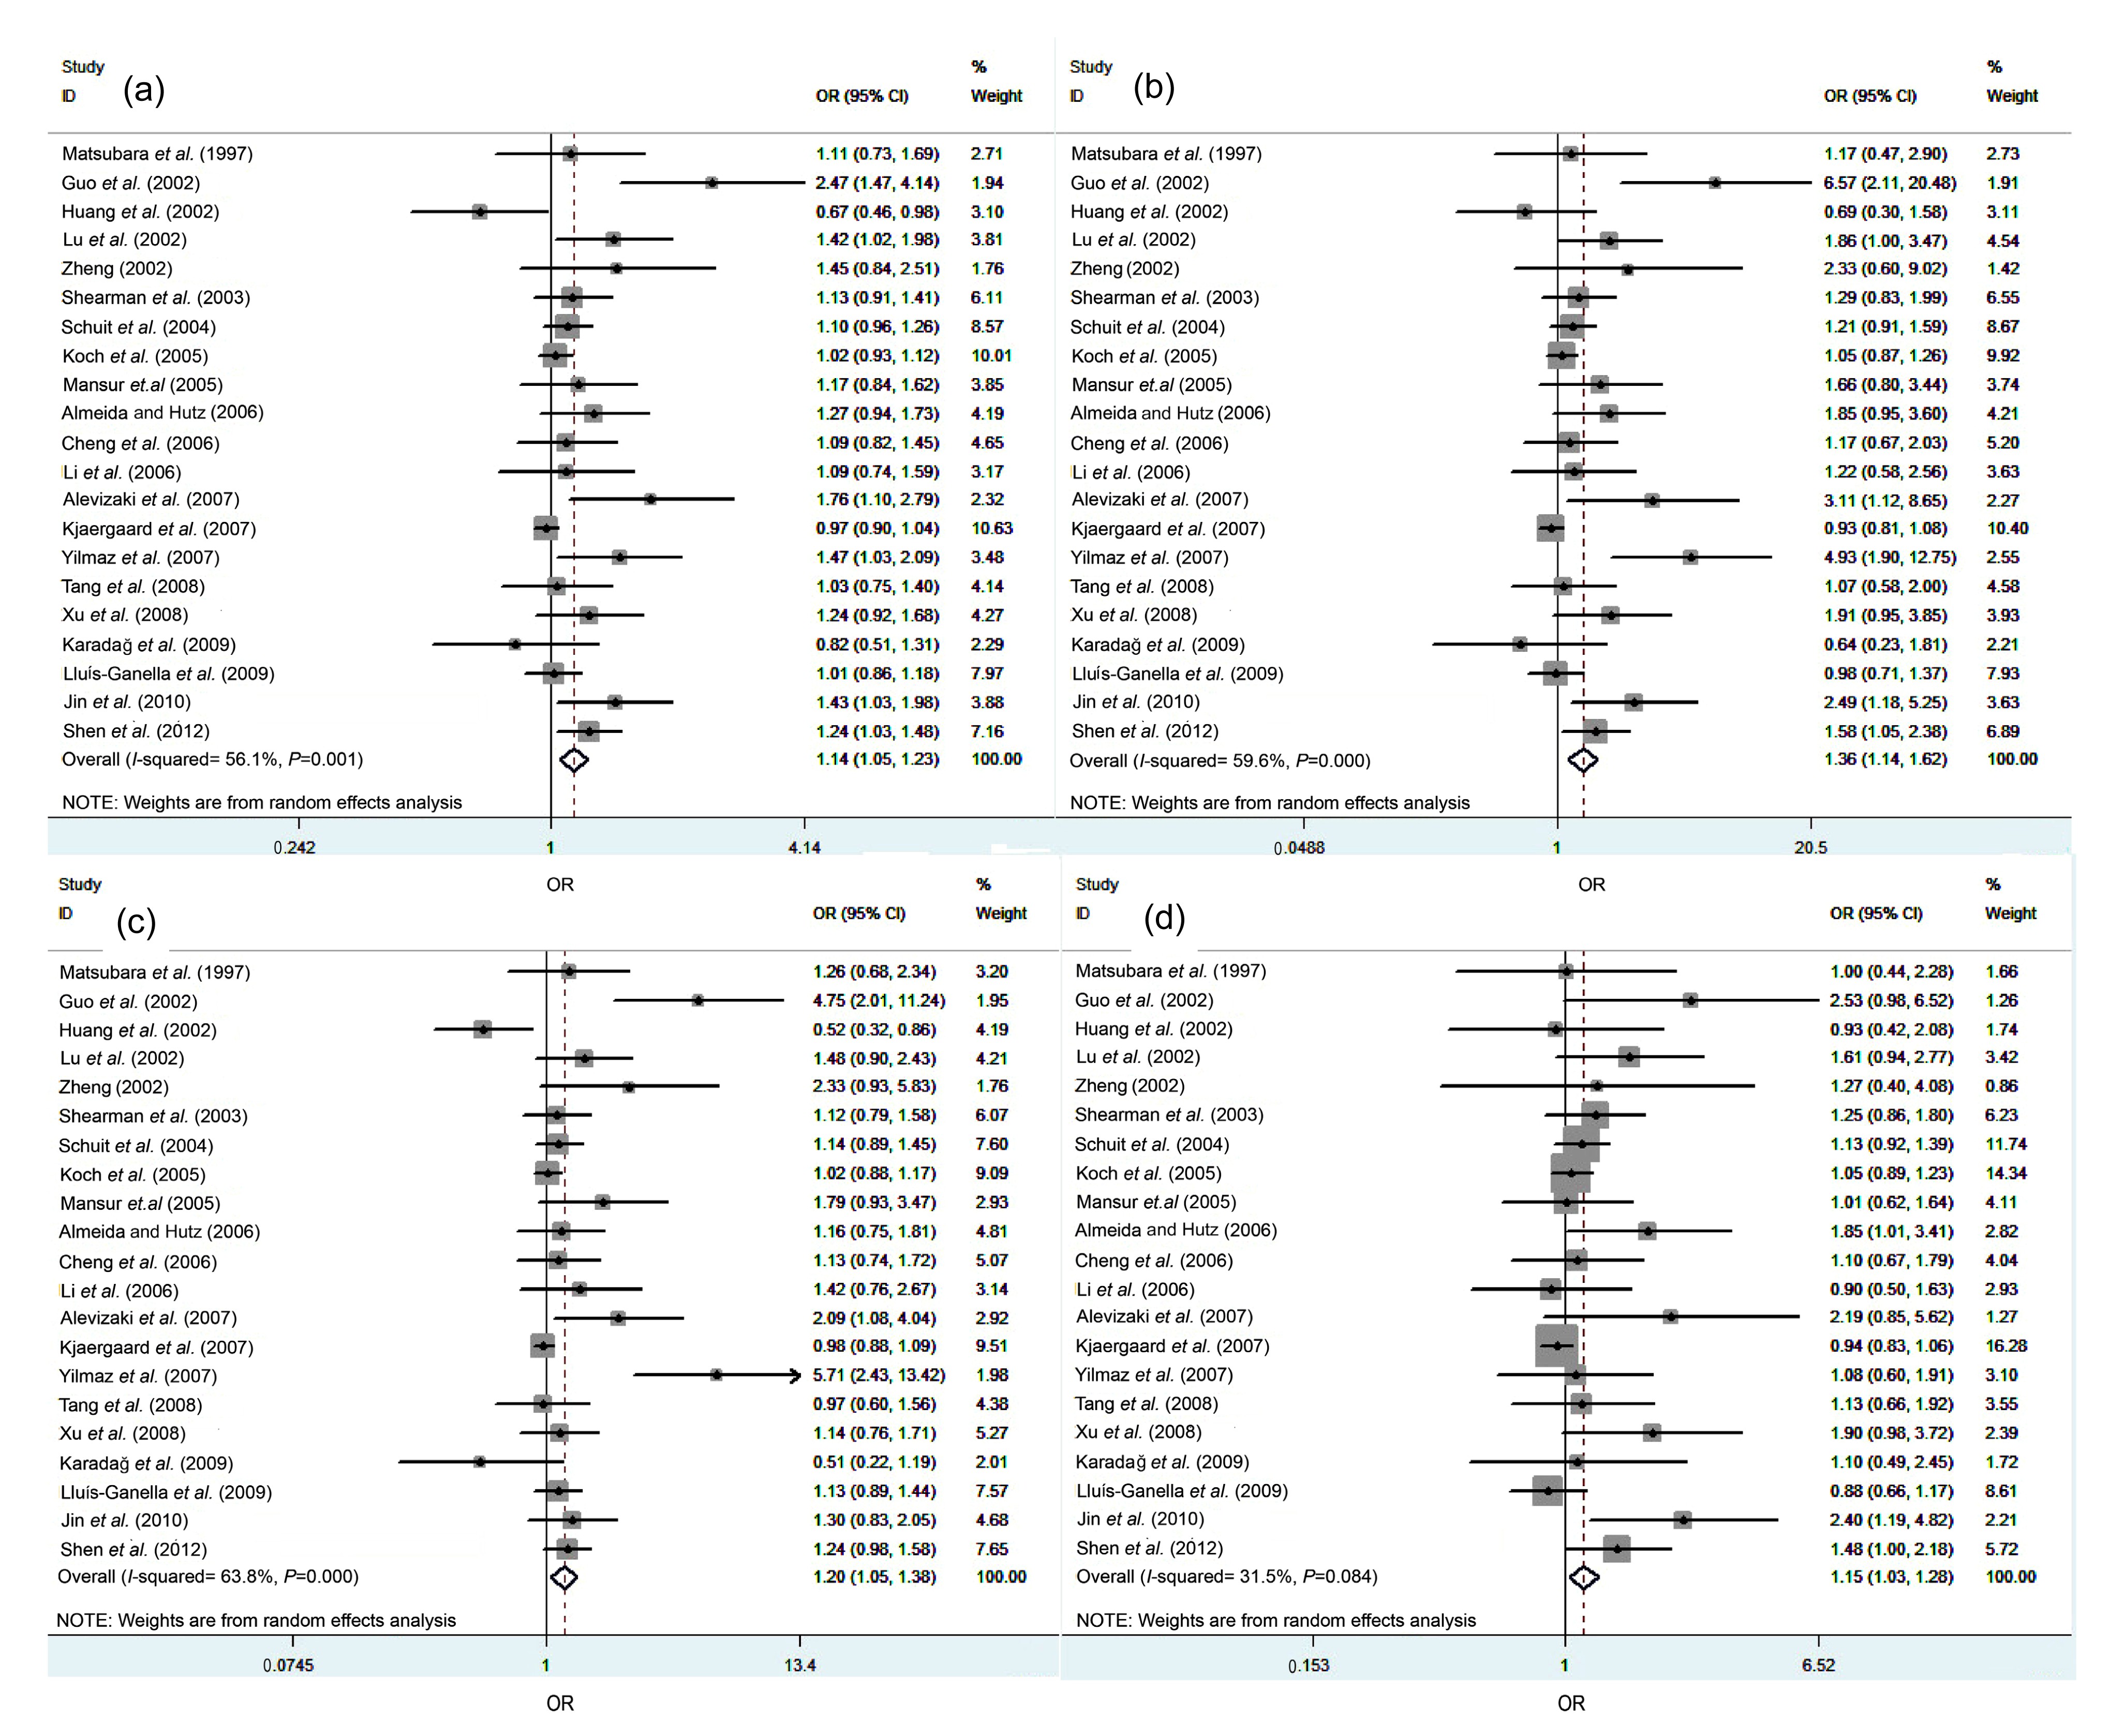
3.2. Main results of the meta-analysis
We used four inheritance models of
ESR1 PvuII separately to investigate the potential association between
ESR1 PvuII polymorphism and CAD risk. When all the eligible studies were pooled into the analysis, the association between
PvuII polymorphism and CAD was significant under the allele genetic model (C vs. T: OR=1.14, 95% CI=1.05–1.23,
P=0.002,
I
2=56%,
P
Heterogeneity=0.0009) (Fig.
2a), homozygote comparison (CC vs. TT: OR=1.36, 95% CI=1.14–1.62,
P=0.0005,
I
2=60%,
P
Heterogeneity=0.0003) (Fig.
2b), dominant genetic model (CC+CT vs. TT: OR=1.20, 95% CI=1.05–1.38,
P=0.007,
I
2=64%,
P
Heterogeneity<0.0001) (Fig.
2c), and recessive genetic model (CC vs. CT+TT: OR=1.15, 95% CI=1.03–1.28,
P=0.02,
I
2=31%,
P
Heterogeneity=0.08) (Fig.
2d).
Fig.2
Forest plots of the association of ESR1 PvuII polymorphism and CAD risk in total population
(a) Allele genetic model (C vs. T); (b) Homozygote comparison (CC vs. TT); (c) Dominant genetic model (CC+CT vs. TT); (d) Recessive genetic model (CC vs. CT+TT)
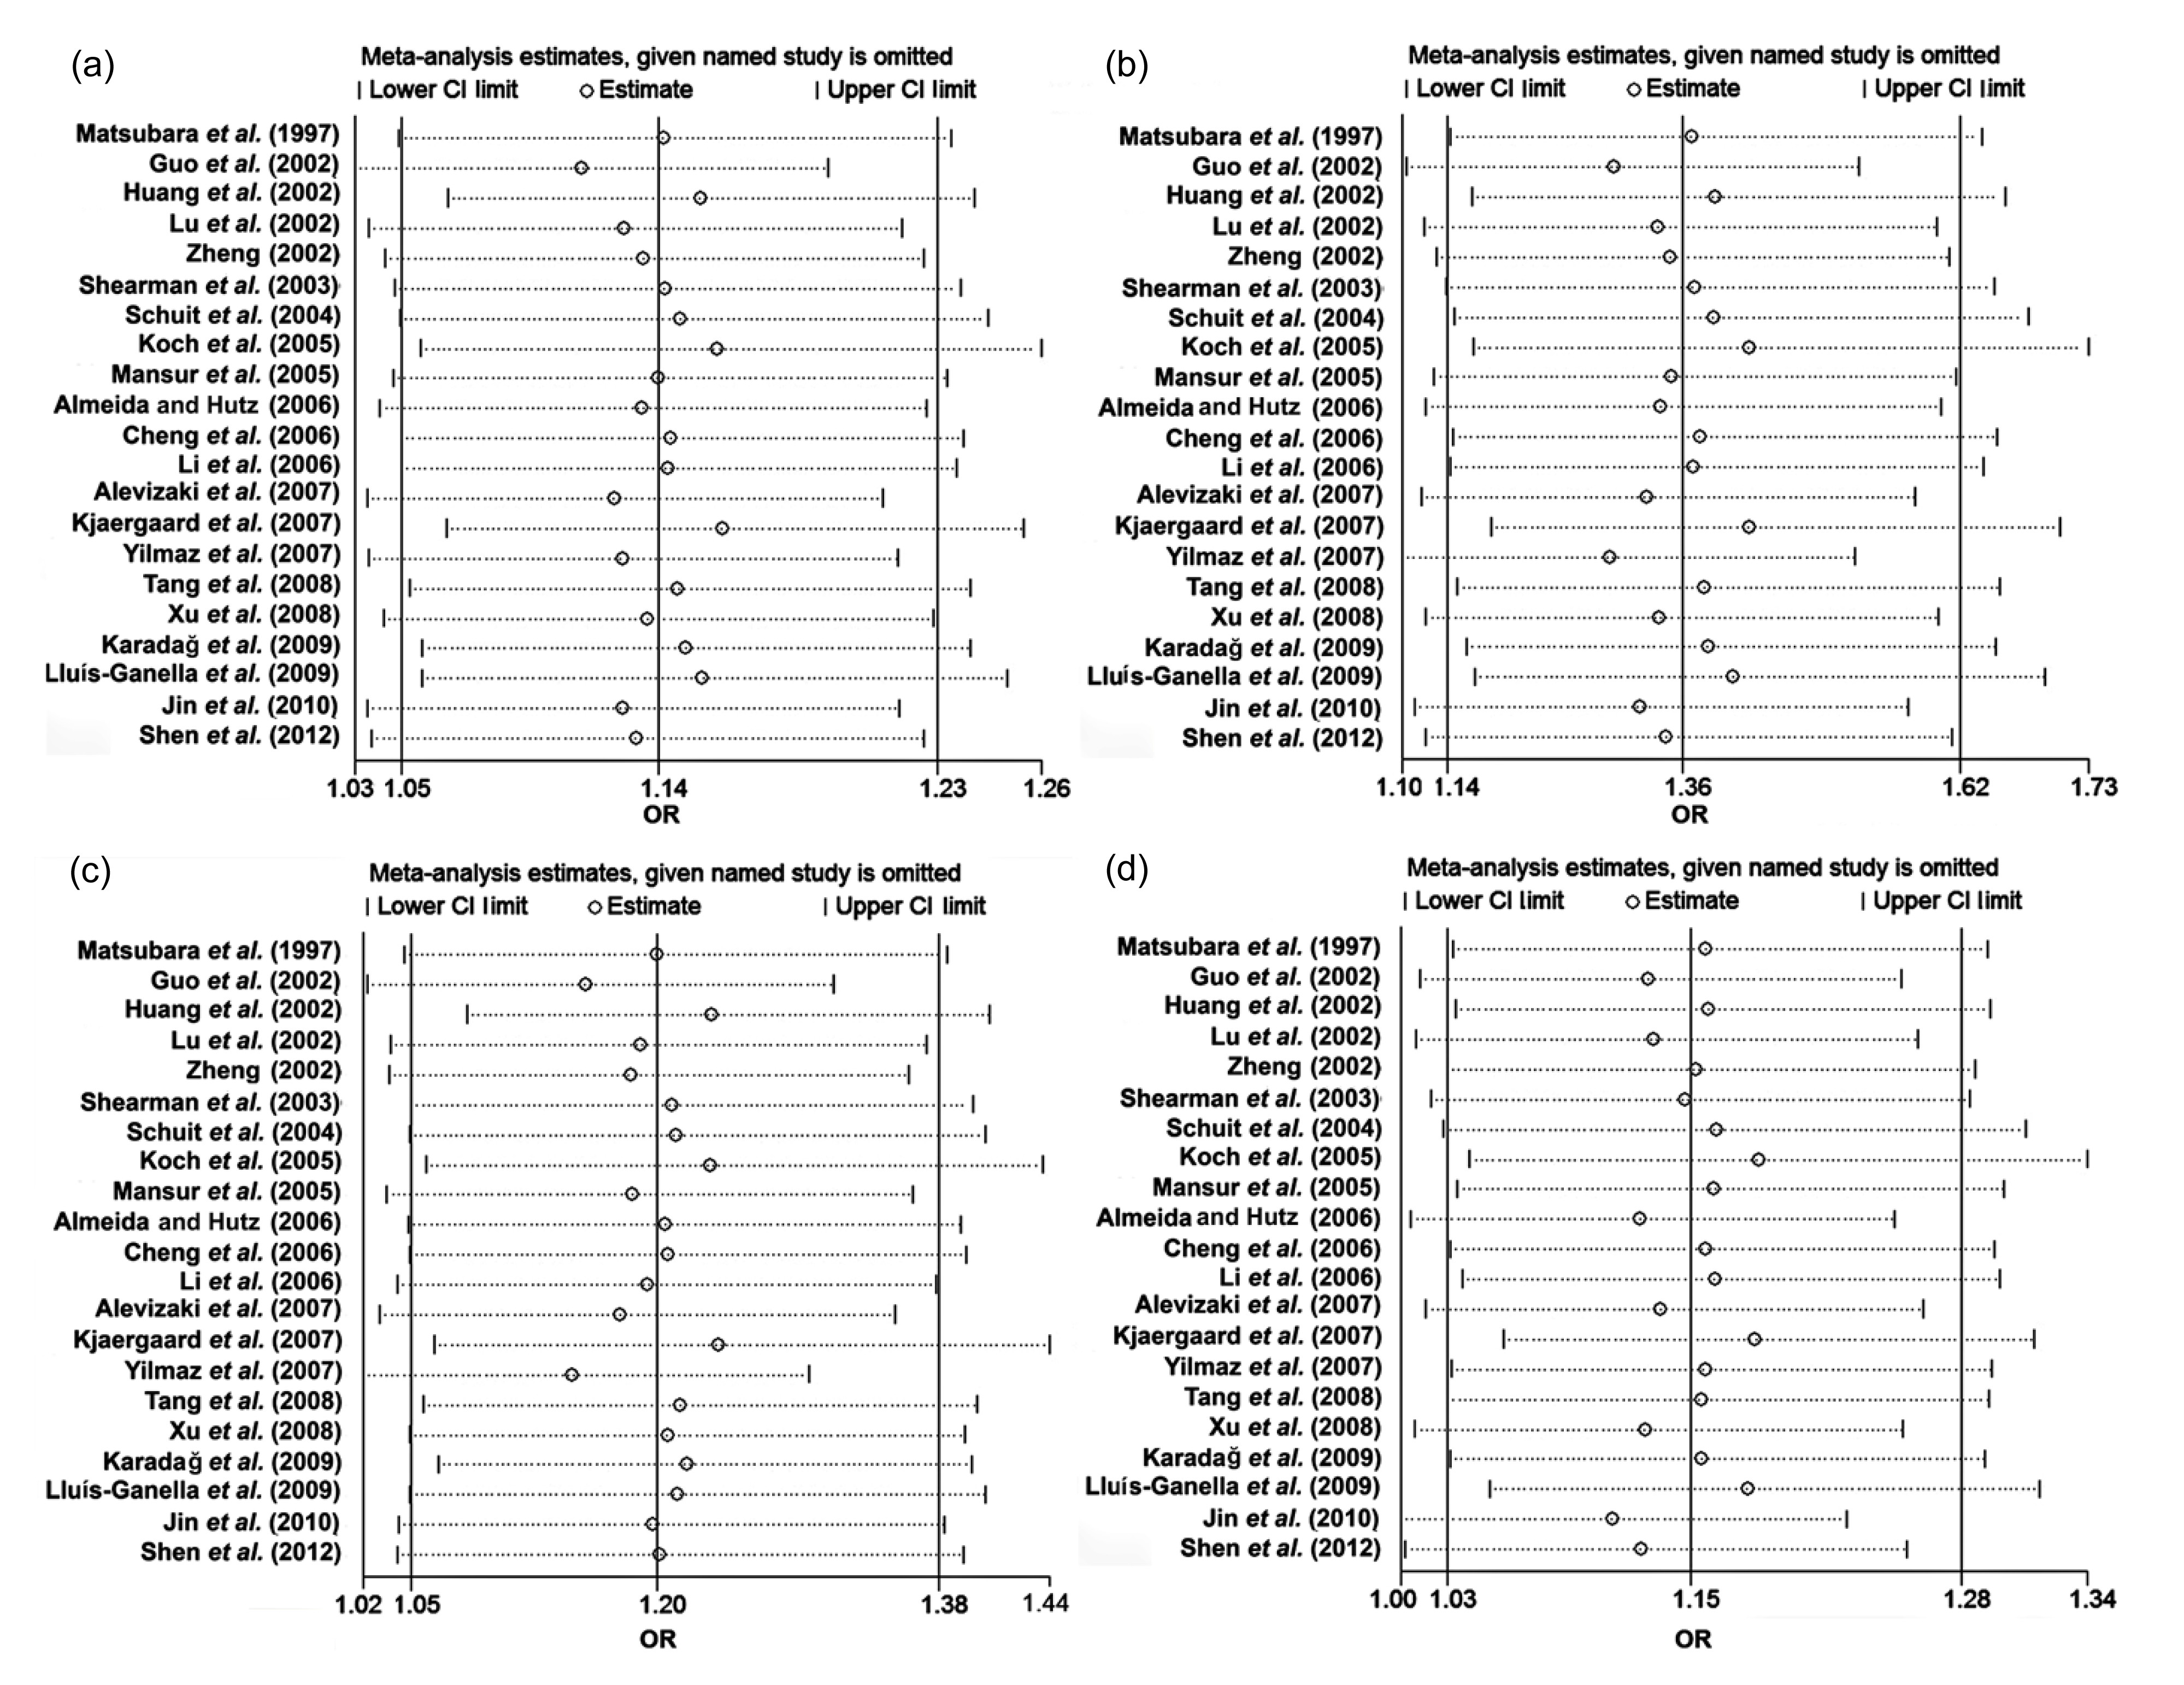
3.3. Heterogeneity test and sensitivity analysis
Q-test and
I
2 index were used to evaluate the heterogeneity in each genetic model. The heterogeneity among different studies was significant in most models (
P<0.1). To explore the potential sources of heterogeneity among studies, we performed a meta-regression. According to the characteristics of studies included in our meta-analysis, we considered the following as potential confounding factors: publication year, region of study population, source of population of control group, total sample size of study population, and ratio of CAD group sample size to control group sample size (RR). Among these factors, the source of the control group (
P=0.03) might have contributed to the heterogeneity. The low heterogeneity seen in subgroup analysis by source of control supports this explanation.
Sensitivity analysis, carried out by excluding each study sequentially in the allele genetic model (C vs. T), showed that the studies by Guo et al. (
2002) and Kjaergaard et al. (
2007) might have contributed to the heterogeneity. When we omitted these two studies from allele genetic model (
I
2=56%, OR=1.14, 95% CI=1.05–1.23), the heterogeneity among the remaining studies decreased markedly (
I
2=48% after deleting the study of Kjaergaard et al. (
2007), and
I
2=46% after omitting the study of Guo et al. (
2002)). We also assessed whether each individual study influenced the pooled ORs by sequential omission of individual studies. No individual study seemed to affect the results significantly in the total population (Fig.
3).
Fig.3
Sensitivity analysis to examine the influence of individual studies on the pooled ORs
The circles represent the pooled ORs when the given named study on the left is omitted, and the dotted lines between “Lower CI limit” and “Upper CI limit” indicate the 95% CIs. Random-effect model was used. (a) Allele genetic model (C vs. T); (b) Homozygote comparison (CC vs. TT); (c) Dominant genetic model (CC+CT vs. TT); (d) Recessive genetic model (CC vs. CT+TT)
3.4. Subgroup analysis
To investigate whether the association between
ESR1 PvuII polymorphism and CAD varies among different populations, we performed subgroup analysis based on the region of origin of the study population. We found an increased risk of CAD in Asian populations under the allele genetic and recessive genetic models (for C vs. T: OR=1.20, 95% CI=1.04–1.39,
I
2=51.9%; for CC vs. CT+TT: OR=1.36, 95% CI=1.13–1.63,
I
2=1.4%) (Table
4). In contrast, no significant relationship was observed between
PvuII polymorphism and CAD in Western populations (Table
4).
Table 4
Pooled ORs and 95% CIs of the stratified meta-analysis
| Stratification |
n
|
OR (95% CI)
|
| CC vs. TT |
CC+CT vs. TT |
CC vs. CT+TT |
C vs. T |
| CAD |
21 |
1.36 (1.14–1.62)*
|
1.20 (1.05–1.38)*
|
1.15 (1.03–1.28)*
|
1.14 (1.05–1.23)*
|
| Source of control |
| HB |
6 |
1.89 (1.11–3.23)*
|
1.74 (1.02–2.96)*
|
1.24 (0.94–1.64) |
1.30 (1.07–1.59)*
|
| PB |
13 |
1.13 (1.00–1.28) |
1.06 (0.97–1.16) |
1.07 (0.97–1.19) |
1.06 (0.99–1.12) |
| PB & HB |
2 |
3.67 (1.45–9.30)*
|
2.36 (0.67–8.35) |
2.44 (1.39–4.28)*
|
1.81 (1.07–3.07)*
|
| Region |
| Asia |
11 |
1.53 (1.17–2.00)*
|
1.25 (0.99–1.57) |
1.36 (1.13–1.63)*
|
1.20 (1.04–1.39)*
|
| Western |
10 |
1.22 (1.00–1.49) |
1.17 (0.99–1.38) |
1.04 (0.94–1.16) |
1.07 (0.99–1.16) |
n: number of studies involved; CC vs. TT: homozygote comparison; CC+CT vs. TT: dominant genetic model; CC vs. CT+TT: recessive genetic model; C vs. T: allele genetic model. CAD: coronary artery disease; PB: population-based; HB: hospital-based. The random model was chosen for data pooling when P<0.10; otherwise, the fixed model was used
*OR had statistical significance with corresponding 95% CI not including 1
In the subgroup analysis stratified by source of control, we found an increased risk of CAD in HB studies (OR=1.3, 95% CI=1.07–1.59) and in studies with both PB and HB controls (OR=1.81, 95% CI=1.07–3.07) under the allele genetic model (C vs. T), but not in PB studies (OR=1.06, 95% CI=0.99–1.12) (Table
4). Furthermore, no significant association of
PvuII polymorphism and CAD risk was found in PB studies either under the recessive genetic model or under the dominant genetic model (Table
4).
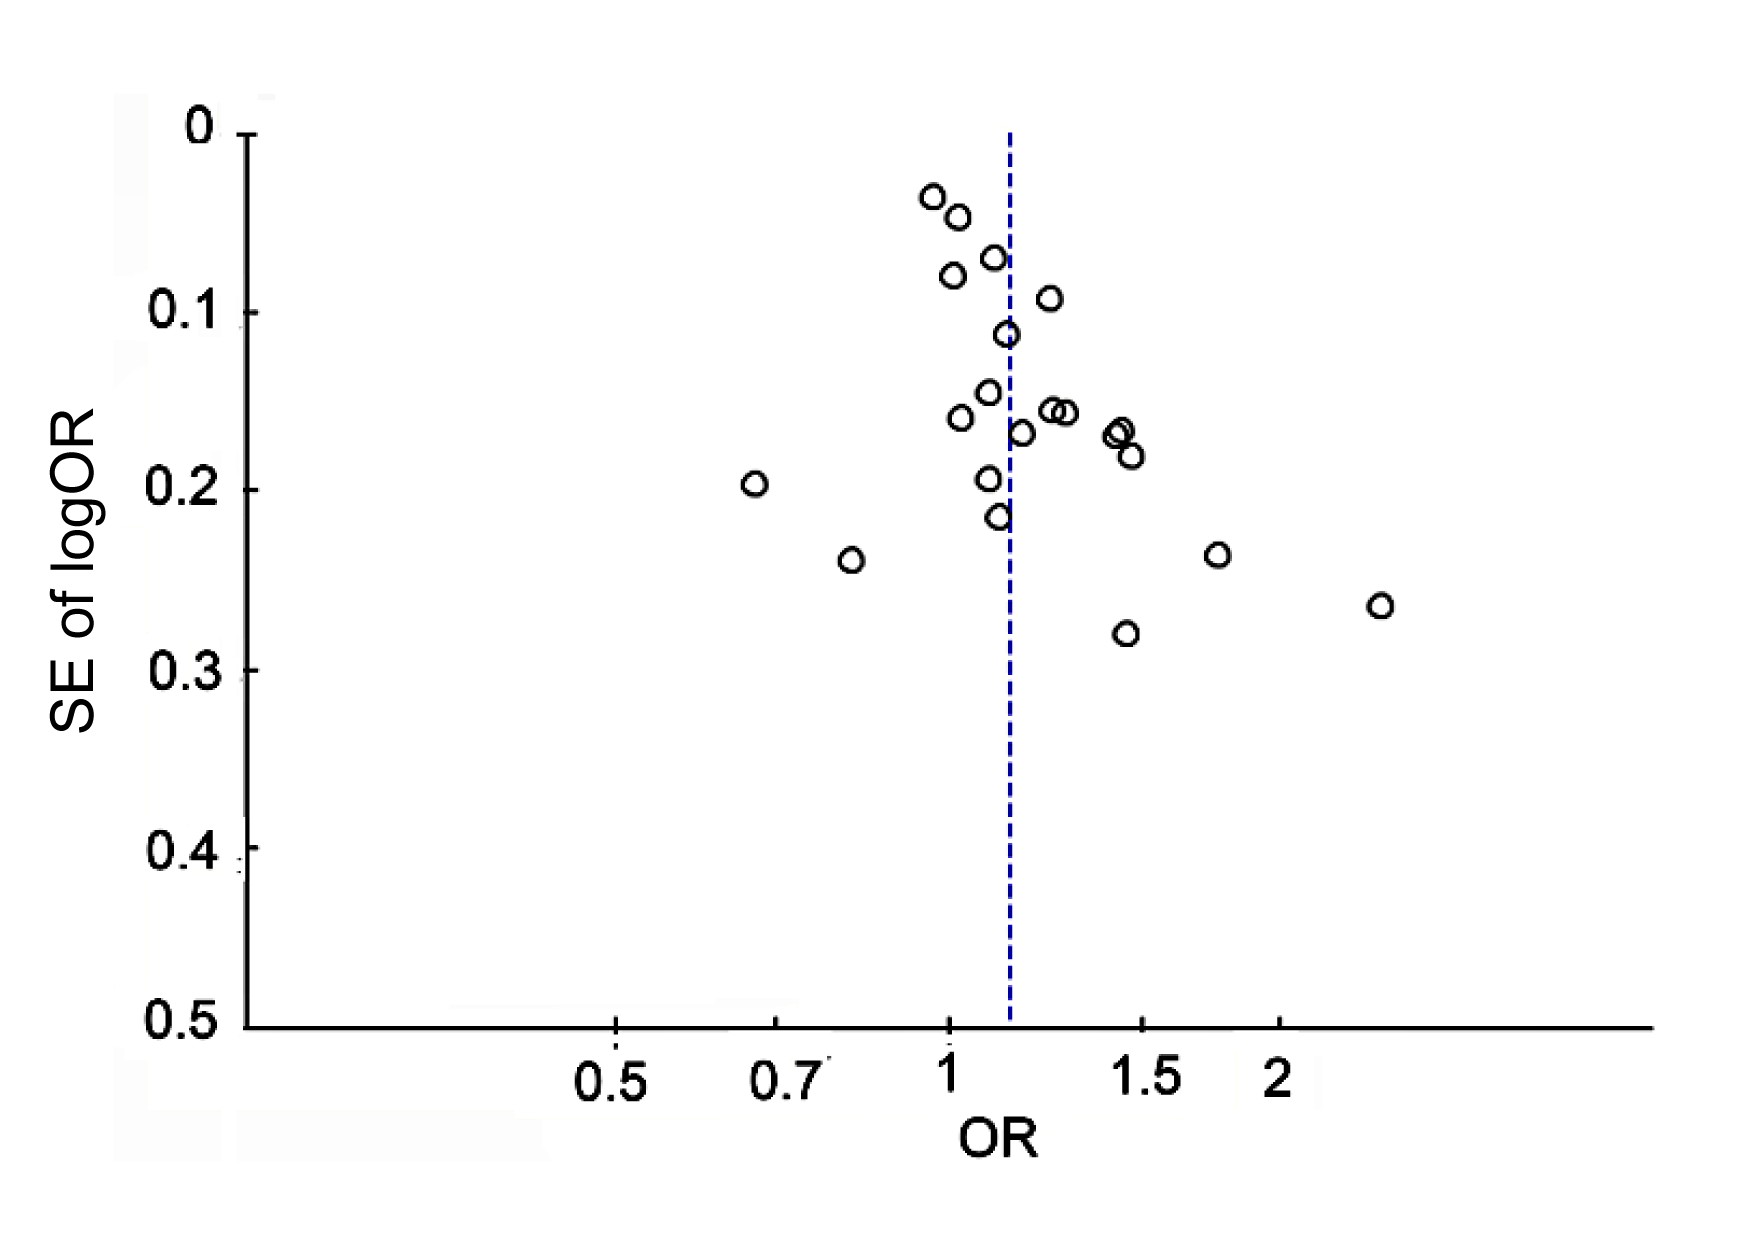
3.5. Publication bias
A funnel plot of publication bias (Fig.
4) showed that the symmetry of the patterning was not ideal. To detect publication bias in a visual and quantified manner, Begg’s test (Fig.
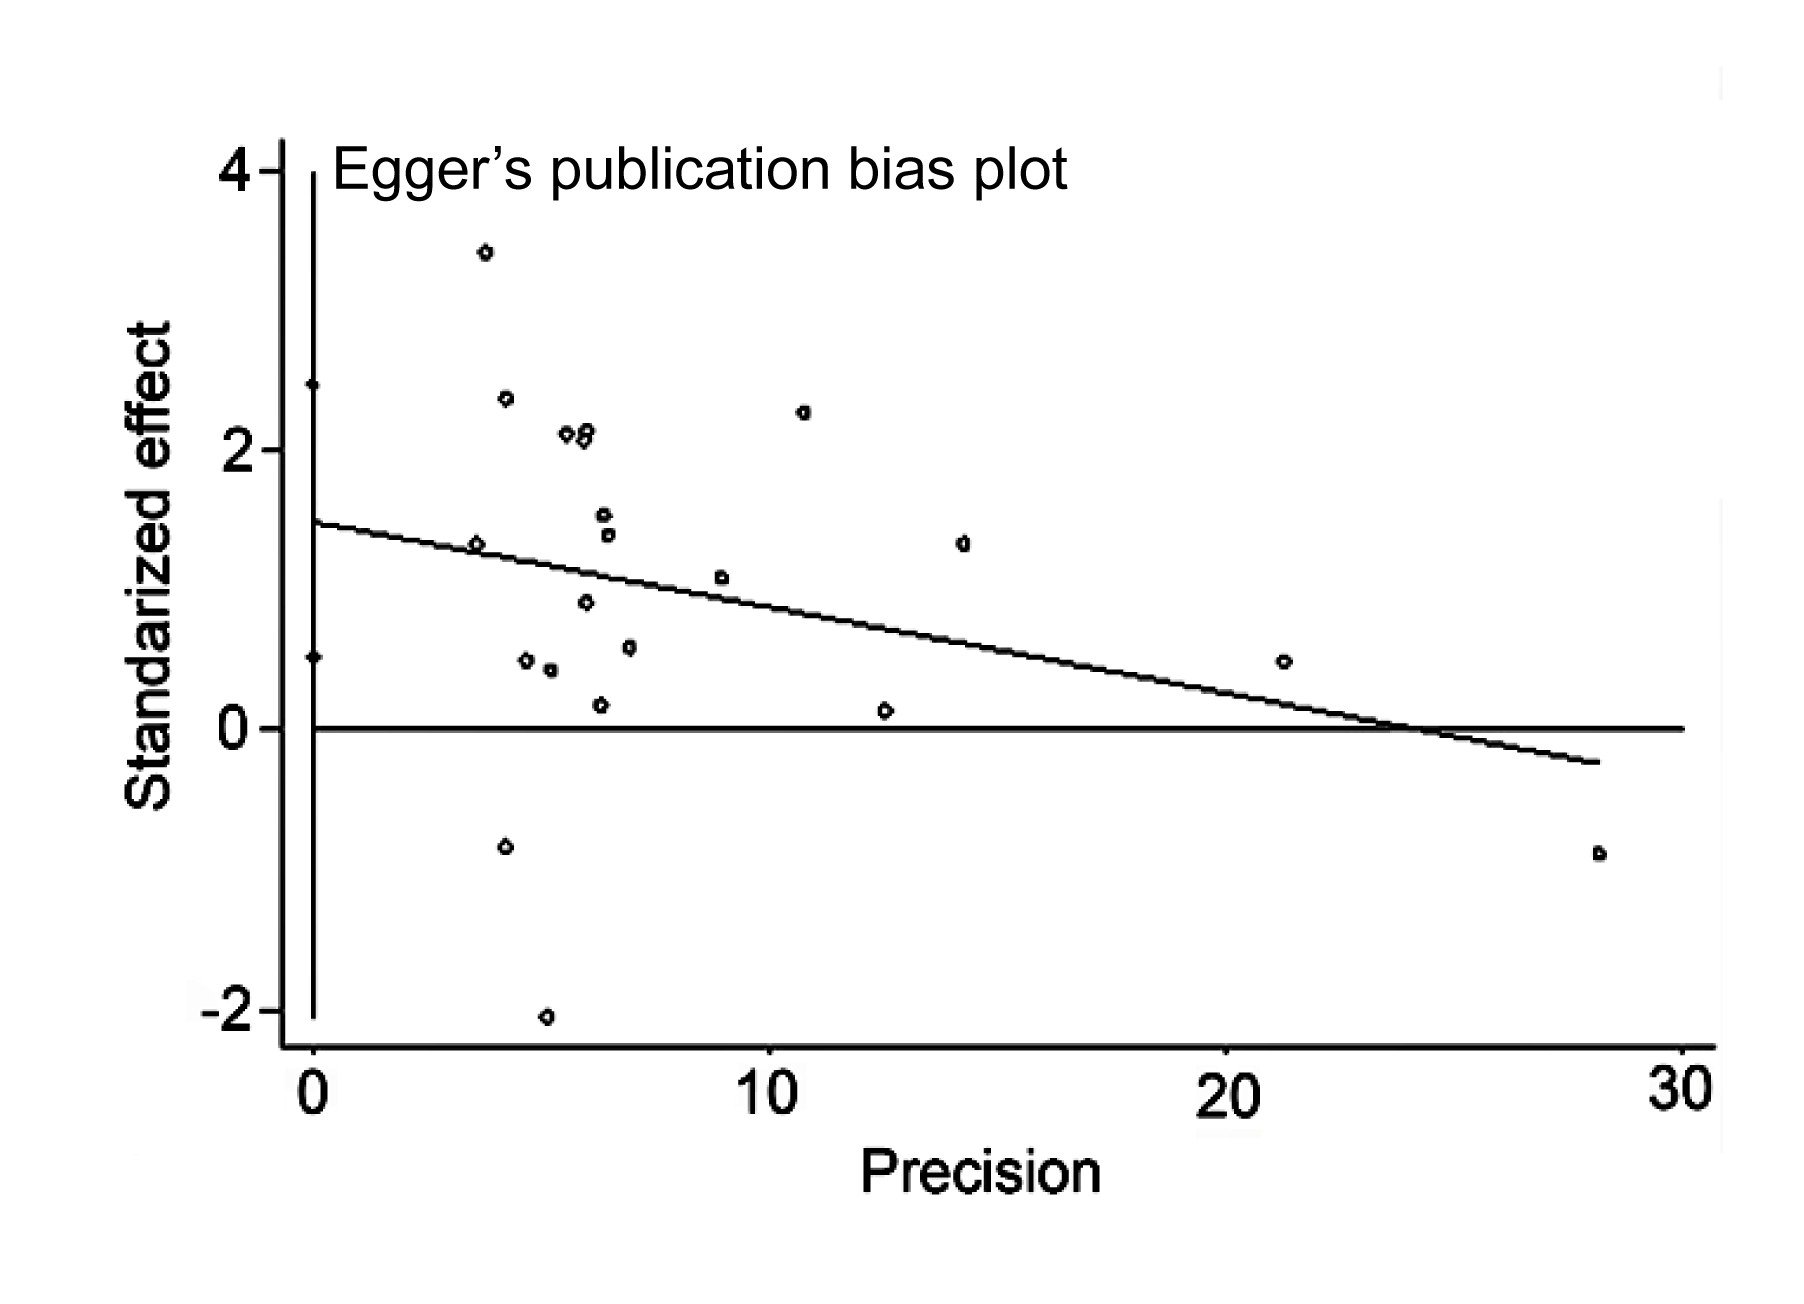
5) and Egger’s test (Fig.
6) were used. The Egger’s test (
t=3.22,
P=0.004) suggested the presence of a potential publication bias, a language bias, inflated estimates by a flawed methodological design in smaller studies, and/or a lack of publication of small trials with opposite results. Although sensitivity analysis by sequential omission of individual studies suggested that the results of our meta-analysis were fairly stable and no individual study was found to affect the results significantly, the results of the present meta-analysis should be interpreted cautiously in the context of this limitation.
Fig.4
Funnel plot of publication bias for the meta-analysis under the allelic genetic model (C vs. T)
The SE of logOR is plotted against the OR for each study. The dotted line indicates the estimated OR. OR: odds ratio; SE: standard error
Fig.5
Begg’s funnel plot of publication bias in the meta-analysis of the association of ESR1 PvuII polymorphism and CAD risk under the allelic genetic model (C vs. T)
Each point represents an individual study included in this meta-analysis. OR: odds ratio; SE: standard error
Fig.6
Egger’s linear regression analysis of publication bias for the meta-analysis under the allelic genetic model (C vs. T) (P=0.004, t=3.22)
The standard normal deviation (SND) was regressed against the estimated precision (p). The regression equation is SND=a+bp, where SND is the odds ratio (OR) divided by its standard error (SE), a is the intercept of the regression line, b is the slope of the regression line, and p is precision, the inverse of the SE
4. Discussion
Our study found that the
ESR1 PvuII polymorphism was significantly associated with CAD risk under the allele genetic model, homozygote comparison, dominant genetic model, and recessive genetic model. To our knowledge, the present study is the largest systematic review by means of meta-analysis to investigate the association between the
ESR1 PvuII polymorphism and CAD risk. A previous meta-analysis by Wei et al. (
2013), which found that the CC genotype of the
ESR1 PvuII polymorphism was significantly associated with an increased risk of CAD in Chinese populations, included 10 studies with 1853 CAD patients and 1544 controls. With 9926 CAD cases and 16 710 controls, our meta-analysis had a much larger sample size and covered a wider range of countries or regions and languages.
The association between
ESR1 PvuII polymorphism and CAD susceptibility was significant in Asian populations in stratification analysis by region. However, no significant results were observed among the Western populations. Our results are consistent with a previous meta-analysis by Kjaergaard et al. (
2007) which reported that the
ESR1 PvuII polymorphism did not influence the risk of CAD in Western populations. Several reasons might explain the contrasting results between Asian and Western populations. Firstly, racial differences between Eastern and Western populations may lead to differences in CAD susceptibility (Thomas et al.,
2010; Batchelor et al.,
2013), due to potential differences in genetic expression and epigenetic effects. Secondly, it is known that CAD is a complicated disease caused by multiple genetic and environmental factors as well as gene-environment interactions, such that differences in lifestyles, geographic conditions, and climate, for example, may influence the role of the genes (Ioana et al.,
2012; Labonté et al.,
2012; Yu et al.,
2012). Finally, the number of eligible studies included in the stratified analysis of Western populations was relatively small. Thus, the lack of association between the
ESR1 PvuII polymorphism and CAD among Western populations might be due to insufficient statistical power.
In the present meta-analysis, the source of controls was considered as one source of heterogeneity based on the meta-regression. After adjusting for the source of controls, no significant heterogeneity was observed in PB studies (
I
2=30.7%) or HB studies (
I
2=29.5%) under genetic models, while significant heterogeneity still existed in the subgroup with both PB and HB sources of controls (
I
2=67.1%). The association between the
ESR1 PvuII polymorphism and CAD risk was still significant in HB studies and in studies with both PB and HB sources of controls, but not in PB studies, under the allele genetic model (C vs. T). The control population of HB studies might be disease-related, and therefore not representative of the general population. This could affect the reliability and authenticity of the findings. Therefore, the results of our present meta-analysis should be interpreted with caution.
There are several limitations in this current meta-analysis. First, the Egger’s test suggested the presence of a potential publication bias. Inevitable literature retrieval bias may exist in our study because we searched papers published in only English or Chinese language. Second, this meta-analysis focused only on the association between
ESR1 c.454-397T>C single nucleotide polymorphisms (SNPs) and CAD risk, while potential interactions between genes were not considered. For example, Schuit et al. (
2004) reported that postmenopausal women who carried the
ESR1 haplotype 1 c.454-397 T allele and the c.454-351 A allele (T-A) had a higher susceptibility to MI. Third, due to incomplete information about the study populations, such as mean age and sex structure, we could not perform further analysis based on these potential confounding factors. The gender-specific role of the
ESR1 PvuII polymorphism in CAD risk was reported previously. Kunnas et al. (
2000) suggested that the
ESR1 PvuII polymorphism contributed to a higher risk of CAD only in men in a Finnish population. Shearman et al. (
2003) also reported that men with the
PvuII CC genotype had a higher risk of MI. In contrast, Alevizaki et al. (
2007) reported that the
ESR1 polymorphism might influence the severity of CAD in postmenopausal women. In addition, as some young controls currently without CAD may suffer from CAD later in life, and age may also have an impact on the final results. The use of much stricter matching criteria between cases and controls may control these possible confounding factors to some extent.
In conclusion, our meta-analysis suggested that the
ESR1 PvuII polymorphism may be associated with CAD susceptibility, especially among Asian populations. The results of the present meta-analysis may have important implications for clinical decisions, for example, whether to use hormone replacement therapy (HRT) (Stampfer and Colditz,
1991; Grady et al.,
1992) for patients with cardiovascular diseases. Additionally, it raises the question of whether the
ESR1 PvuII polymorphism could be considered as a candidate genetic marker to identify genetic susceptibility to CAD. Further well-designed studies with larger sample sizes are needed to clarify the effects of estrogen on the cardiovascular system and to elucidate the mechanism of action more clearly.
Acknowledgements
We thank Prof. R. H. ZHUGE from the University of Massachusetts Medical School (USA) for critical reading and language revision of the manuscript.
* Project supported by the Zhejiang Provincial Natural Science Foundation of China (No. LY12H02006) and the Health Bureau of Zhejiang Province (No. 2011RCB016), ChinaCompliance with ethics guidelines Jie DING, Hui XU, Xiang YIN, Fu-rong ZHANG, Xiao-ping PAN, Yi-an GU, Jun-zhu CHEN, and Xiao-gang GUO declare that they have no conflict of interest.References
[1] Alevizaki, M., Saltiki, K., Cimponeriu, A., 2007. Severity of cardiovascular disease in postmenopausal women: associations with common estrogen receptor α polymorphic variants.
Eur J Endocrinol, 156(4):489-496.


[2] Almeida, S., Hutz, M.H., 2006. Estrogen receptor 1 gene polymorphisms and coronary artery disease in the Brazilian population.
Braz J Med Biol Res, 39(4):447-454.
[3] Batchelor, W.B., Ellis, S.G., Ormiston, J.A., 2013. Racial differences in long-term outcomes after percutaneous coronary intervention with paclitaxel-eluting coronary stents.
J Interv Cardiol, 26(1):49-57.
[4] Begg, C.B., Mazumdar, M., 1994. Operating characteristics of a rank correlation test for publication bias.
Biometrics, 50(4):1088-1101.
[5] Boroumand, M., Ghaedi, M., Mohammadtaghvaei, N., 2009. Association of estrogen receptor α gene polymorphism with the presence of coronary artery disease documented by coronary angiography.
Clin Biochem, 42(9):835-839.
[6] Camargo, M.C., Mera, R., Correa, P., 2006. Interleukin-1β and interleukin-1 receptor antagonist gene polymorphisms and gastric cancer: a meta-analysis.
Cancer Epidemiol Biomarkers Prev, 15(9):1674-1687.
[7] Cheng, A.J., Fu, N.K., Xu, J., 2006. A study of the correlation between estrogen receptor gene polymorphism and coronary heart disease as well as serum lipid levels in postmenopausal women.
Hebei Med J, (in Chinese),28(7):568-570.
[8] Cochran, W.G., 1968. The effectiveness of adjustment by subclassification in removing bias in observational studies.
Biometrics, 24(2):295-313.
[9] Egger, M., Davey Smith, G., Schneider, M., 1997. Bias in meta-analysis detected by a simple, graphical test.
BMJ, 315(7109):629-634.
[10] Figtree, G.A., McDonald, D., Watkins, H., 2003. Truncated estrogen receptor α 46-kDa isoform in human endothelial cells: relationship to acute activation of nitric oxide synthase.
Circulation, 107(1):120-126.
[11] Figtree, G.A., Noonan, J.E., Bhindi, R., 2009. Estrogen receptor polymorphisms: significance to human physiology, disease and therapy.
Recent Pat DNA Gene Seq, 3(3):164-171.
[12] Grady, D., Rubin, S.M., Petitti, D.B., 1992. Hormone therapy to prevent disease and prolong life in postmenopausal women.
Ann Intern Med, 117(12):1016-1037.
[13] Grodstein, F., Stampfer, M.J., Colditz, G.A., 1997. Postmenopausal hormone therapy and mortality.
N Engl J Med, 336(25):1769-1775.
[14] Guo, Z.G., Zheng, H., Wu, S.Z., 2002. Relationship between estrogen receptor gene polymorphism and coronary heart disease.
Chin J Geriatr Cardiovasc Cerebrovasc Dis, (in Chinese),4(6):374-377.
[15] Gurevitz, O., Jonas, M., Boyko, V., 2000. Clinical profile and long-term prognosis of women ≤50 years of age referred for coronary angiography for evaluation of chest pain.
Am J Cardiol, 85(7):806-809.
[16] Hamada, H., Kim, M.K., Iwakura, A., 2006. Estrogen receptors α and β mediate contribution of bone marrow-derived endothelial progenitor cells to functional recovery after myocardial infarction.
Circulation, 114(21):2261-2270.
[17] Herrington, D.M., Howard, T.D., Brosnihan, K.B., 2002. Common estrogen receptor polymorphism augments effects of hormone replacement therapy on E-selectin but not C-reactive protein.
Circulation, 105(16):1879-1882.
[18] Higgins, J.P., Thompson, S.G., 2002. Quantifying heterogeneity in a meta-analysis.
Stat Med, 21(11):1539-1558.
[19] Higgins, J.P., Thompson, S.G., Deeks, J.J., 2003. Measuring inconsistency in meta-analyses.
BMJ, 327(7414):557-560.
[20] Huang, X.Z., Zhang, P.A., Li, Y., 2002. Association of estrogen receptor gene polymorphism with coronary heart disease.
Chin J Cardiol, (in Chinese),30(2):78-81.
[21] Ioana, M., Ferwerda, B., Plantinga, T.S., 2012. Different patterns of Toll-like receptor 2 polymorphisms in populations of various ethnic and geographic origins.
Infect Immun, 80(5):1917-1922.
[22] Jesmin, S., Mowa, C.N., Sultana, S.N., 2010. VEGF signaling is disrupted in the hearts of mice lacking estrogen receptor alpha.
Eur J Pharmacol, 641(2-3):168-178.
[23] Jin, L.Z., Chen, X.C., Ma, Y.D., 2010. Association of estrogen receptor α gene
PvuII and
XbaI polymorphisms with coronary artery disease.
Chin J Biomed Eng, (in Chinese),16(2):136-139.
[24] Jneid, H., 2012. The 2012 ACCF/AHA focused update of the unstable angina/non-ST-elevation myocardial infarction (UA/NSTEMI) guideline: a critical appraisal.
Methodist Debakey Cardiovasc J, 8(3):26-30.
[25] Karadağ, B., Gven, M., Hacioğlu, Y., 2009. Relationship between two estrogen receptor-α gene polymorphisms and angiographic coronary artery disease.
Anadolu Kardiyol Derg, 9(4):267-272.
[26] Kjaergaard, A.D., Ellervik, C., Tybjærg-Hansen, A., 2007. Estrogen receptor α polymorphism and risk of cardiovascular disease, cancer, and hip fracture: cross-sectional, cohort, and case-control studies and a meta-analysis.
Circulation, 115(7):861-871.
[27] Klos, K.L., Boerwinkle, E., Ferrell, R.E., 2008.
ESR1 polymorphism is associated with plasma lipid and apolipoprotein levels in Caucasians of the Rochester Family Heart Study.
J Lipid Res, 49(8):1701-1706.
[28] Koch, W., Hoppmann, P., Pfeufer, A., 2005. No replication of association between estrogen receptor α gene polymorphisms and susceptibility to myocardial infarction in a large sample of patients of European descent.
Circulation, 112(14):2138-2142.
[29] Kunnas, T.A., Laippala, P., Penttil, A., 2000. Association of polymorphism of human α oestrogen receptor gene with coronary artery disease in men: a necropsy study.
BMJ, 321(7256):273-274.
[30] Labont, B., Suderman, M., Maussion, G., 2012. Genome-wide epigenetic regulation by early-life trauma.
Arch Gen Psychiatry, 69(7):722-731.
[31] Li, L.H., Zhao, F.M., Li, G.Q., 2006. Association between estrogen receptor alpha gene variation and risks of cardiovascular disease.
Mol Cardiol China, (in Chinese),6(2):90-94.
[32] Liu, H., Pedram, A., Kim, J.K., 2011. Oestrogen prevents cardiomyocyte apoptosis by suppressing p38α-mediated activation of p53 and by down-regulating p53 inhibition on p38β.
Cardiovasc Res, 89(1):119-128.
[33] Llus-Ganella, C., Lucas, G., Subirana, I., 2009. Qualitative assessment of previous evidence and an updated meta-analysis confirms lack of association between the
ESR1 rs2234693 (
PvuII) variant and coronary heart disease in men and women.
Atherosclerosis, 207(2):480-486.
[34] Lu, H., Higashikata, T., Inazu, A., 2002. Association of estrogen receptor-α gene polymorphisms with coronary artery disease in patients with familial hypercholesterolemia.
Arterioscler Thromb Vasc Biol, 22(5):817-823.
[35] Mansur, A.P., Nogueira, C.C.M., Strunz, C.M.C., 2005. Genetic polymorphisms of estrogen receptors in patients with premature coronary artery disease.
Arch Med Res, 36(5):511-517.
[36] Matsubara, Y., Murata, M., Kawano, K., 1997. Genotype distribution of estrogen receptor polymorphisms in men and postmenopausal women from healthy and coronary populations and its relation to serum lipid levels.
Arterioscler Thromb Vasc Biol, 17(11):3006-3012.
[37] Mendelsohn, M.E., Karas, R.H., 2005. Molecular and cellular basis of cardiovascular gender differences.
Science, 308(5728):1583-1587.
[38] Peter, I., Shearman, A.M., Zucker, D.R., 2005. Variation in estrogen-related genes and cross-sectional and longitudinal blood pressure in the Framingham Heart Study.
J Hypertens, 23(12):2193-2200.
[39] Rokach, A., Pollak, A., Rosen, L., 2005. Estrogen receptor α gene polymorphisms are associated with the angiographic extent of coronary artery disease.
J Clin Endocrinol Metab, 90(12):6556-6560.
[40] Rossouw, J.E., Anderson, G.L., Prentice, R.L., 2002. Risks and benefits of estrogen plus progestin in healthy postmenopausal women: principal results from the Women’s Health Initiative randomized controlled trial.
JAMA, 288(3):321-333.
[41] Schuit, S.C.E., Oei, H.H., Witteman, J.C.M., 2004. Estrogen receptor α gene polymorphisms and risk of myocardial infarction.
JAMA, 291(24):2969-2977.
[42] Shearman, A.M., Cupples, L.A., Demissie, S., 2003. Association between estrogen receptor α gene variation and cardiovascular disease.
JAMA, 290(17):2263-2270.
[43] Shen, C., Chen, J., Fan, S., 2012. Association between the polymorphism of estrogen receptor α and coronary artery disease in a Chinese population.
Eur J Intern Med, 23(2):175-178.
[44] Stampfer, M.J., Colditz, G.A., 1991. Estrogen replacement therapy and coronary heart disease: a quantitative assessment of the epidemiologic evidence.
Prev Med, 20(1):47-63.
[45] St-Hilaire, S., Mandal, R., Commendador, A., 2011. Estrogen receptor positive breast cancers and their association with environmental factors.
Int J Health Geogr, 10:32
[46] Tang, Z.Z., Li, X.P., Yang, J.H., 2008. Relationship of estrogen receptor α gene polymorphism and risk of cardiovascular diseases.
Mil Med J South China, (in Chinese),22(2):35-37.
[47] Thakkinstian, A., McEvoy, M., Minelli, C., 2005. Systematic review and meta-analysis of the association between β
2-adrenoceptor polymorphisms and asthma: a HuGE review.
Am J Epidemiol, 162(3):201-211.
[48] Thomas, K.L., Honeycutt, E., Shaw, L.K., 2010. Racial differences in long-term survival among patients with coronary artery disease.
Am Heart J, 160(4):744-751.
[49] Tunstall-Pedoe, H., Kuulasmaa, K., Mhnen, M., 1999. Contribution of trends in survival and coronary-event rates to changes in coronary heart disease mortality: 10-year results from 37 WHO MONICA Project populations.
Lancet, 353(9164):1547-1557.
[50] Wang, F., He, Q., Sun, Y., 2010. Female adult mouse cardiomyocytes are protected against oxidative stress.
Hypertension, 55(5):1172-1178.
[51] Wei, C.D., Zheng, H.Y., Wu, W., 2013. Meta-analysis of the association of the rs2234693 and rs9340799 polymorphisms of estrogen receptor alpha gene with coronary heart disease risk in Chinese Han population.
Int J Med Sci, 10(4):457-466.
[52] Wright, R.S., Anderson, J.L., Adams, C.D., 2011. 2011 ACCF/AHA focused update incorporated into the ACC/AHA 2007 Guidelines for the Management of Patients with Unstable Angina/Non-ST-elevation Myocardial Infarction: a report of the American College of Cardiology Foundation/American Heart Association Task Force on Practice Guidelines.
J Am Coll Cardiol, 57(19):e215-e367.
[53] Xu, H., Hou, X., Wang, N., 2008. Gender-specific effect of estrogen receptor-1 gene polymorphisms in coronary artery disease and its angiographic severity in Chinese population.
Clin Chim Acta, 395(1-2):130-133.
[54] Yaich, L., Dupont, W.D., Cavener, D.R., 1992. Analysis of the
PvuII restriction fragment-length polymorphism and exon structure of the estrogen receptor gene in breast cancer and peripheral blood.
Cancer Res, 52(1):77-83.
[55] Yilmaz, A., Menevse, S., Erkan, A.F., 2007. The relationship of the
ESR1 gene polymorphisms with the presence of coronary artery disease determined by coronary angiography.
Genet Test, 11(4):367-371.
[56] Yu, Q., Liu, E.Q., Zhao, S.H., 2012. Association between
TaqIB polymorphism of cholesteryl ester transfer protein and coronary artery disease in the Chinese population.
J Zhejiang Univ-Sci B (Biomed & Biotechnol), 13(5):342-347.
[57] Zheng, H.M., 2002. Association of Estrogen Receptor (ER) Polymorphisms with Coronary Artery Disease and the Lipoprotein Metabolism in Women. MS Thesis, (in Chinese), Hebei Medical University,Hebei, China :


Open peer comments: Debate/Discuss/Question/Opinion
<1>